Evaluation Global Mean Time Series CMIP6
CMIP6 Multi-Model Mean Context
Comparison with CMIP6 ensemble mean from 11 members.
Contributing models: ACCESS-ESM1-5, AWI-CM-1-1-MR, CNRM-CM6-1, CNRM-ESM2-1, EC-Earth3, FGOALS-g3, GISS-E2-1-G, INM-CM5-0, IPSL-CM6A-LR, MPI-ESM1-2-LR, MRI-ESM2-0
Synthesis
Related diagnostics
Total Cloud Cover Global Mean Time Series
| Variables | clt |
|---|---|
| Models | IFS-FESOM2-SR, IFS-NEMO-ER, ICON-ESM-ER, HadGEM3-GC5, MPI-ESM1-2-LR, GISS-E2-1-G, IPSL-CM6A-LR, ACCESS-ESM1-5, EC-Earth3, CNRM-CM6-1, AWI-CM-1-1-MR, CNRM-ESM2-1, FGOALS-g3, INM-CM5-0, MRI-ESM2-0 |
| Reference Dataset | ERA5 |
| Units | % |
| Period | 1980–2014 |
Summary high
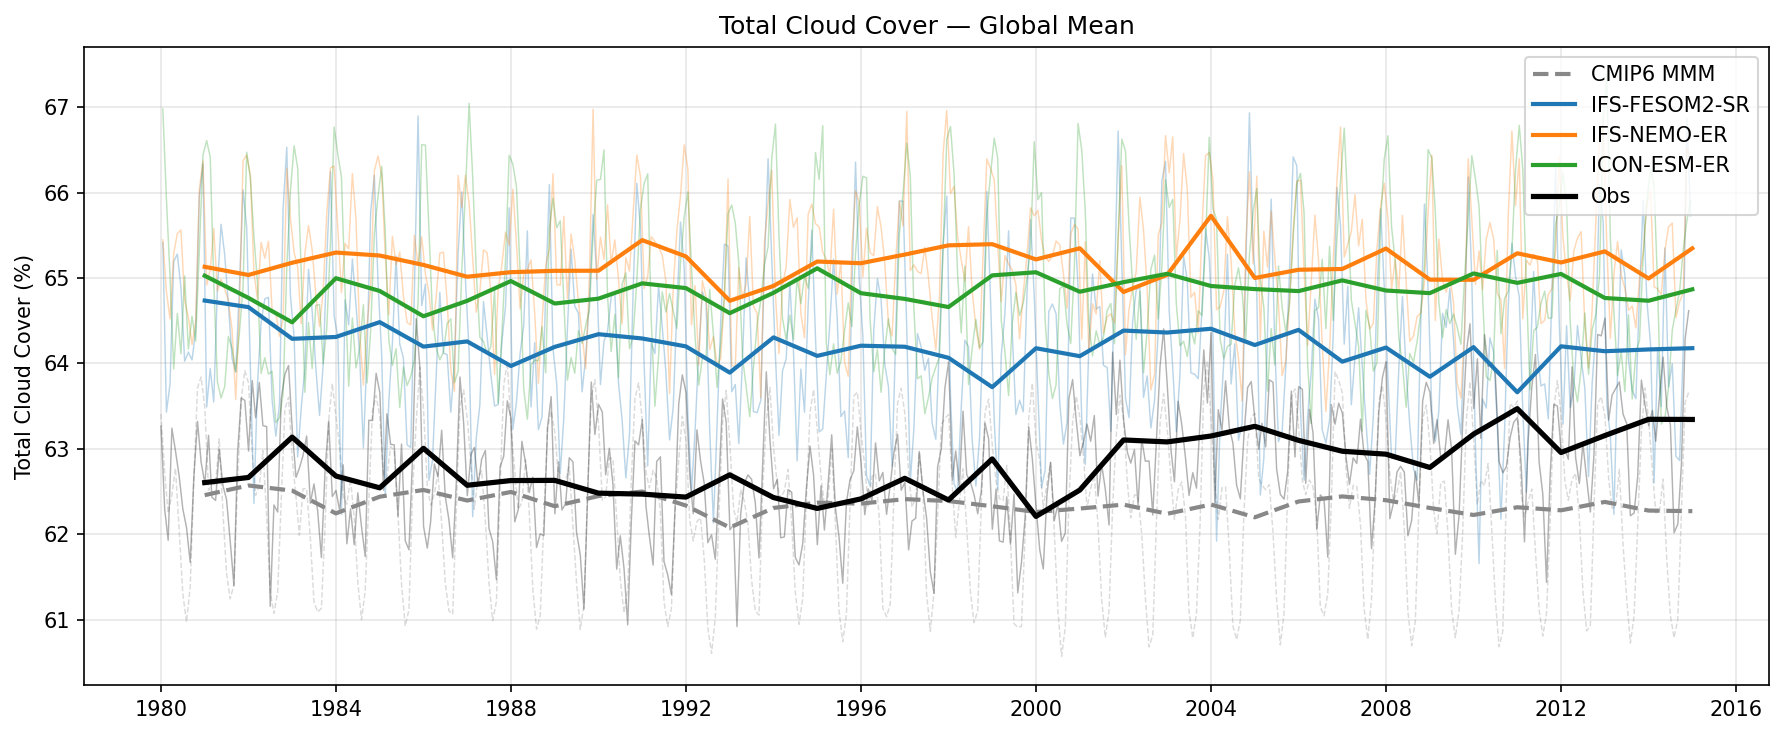
Time series analysis (1980–2014) of global mean total cloud cover comparing four high-resolution EERIE models against ERA5 reanalysis and the CMIP6 ensemble.
Key Findings
- HadGEM3-GC5 exhibits a substantial positive bias, overestimating global cloud cover by ~8-9% relative to ERA5 (roughly 71% vs 63%).
- IFS-FESOM2-SR, IFS-NEMO-ER, and ICON-ESM-ER cluster together with a moderate positive bias of ~2-3%, with IFS-FESOM2-SR being the closest of the high-res models to the ERA5 baseline.
- The CMIP6 Multi-Model Mean (MMM) aligns remarkably well with ERA5 (~62.5%), effectively outperforming the individual high-resolution simulations in this specific global metric, though individual CMIP6 members show a massive spread (ranging from ~53% to ~70%).
Spatial Patterns
While spatial patterns are integrated out, the temporal evolution is stable for most models. HadGEM3-GC5 shows a very slight decreasing trend over the period. The amplitude of the seasonal cycle (visible in the thin background lines) appears notably larger for HadGEM3-GC5 compared to the other models and ERA5.
Model Agreement
There is a distinct separation between the model groups: HadGEM3-GC5 is an outlier on the high side, while the IFS and ICON configurations form a tighter cluster closer to observations. None of the EERIE models match the ERA5 global mean as closely as the CMIP6 MMM, suggesting that increased resolution does not automatically correct global aggregate cloud fractions without specific tuning.
Physical Interpretation
Total cloud cover is sensitive to cloud overlap assumptions (e.g., maximum-random) and microphysics parameterizations. The systematic high bias in the high-resolution models suggests either an over-active generation of cloud condensate or insufficient clearing mechanisms. For HadGEM3, this 'too cloudy' state would likely result in excessive reflected Shortwave Radiation at the TOA (cooling effect) and reduced surface insolation, potentially influencing the model's energy balance and surface temperature biases.
Caveats
- Global means can mask significant regional compensating errors (e.g., biases in stratocumulus decks versus deep convective zones).
- ERA5 is a reanalysis product heavily reliant on its own underlying model physics; comparison against direct satellite products (e.g., CLARA-A2, ISCCP) might yield different absolute bias magnitudes.
Surface Latent Heat Flux Global Mean Time Series
| Variables | hfls |
|---|---|
| Models | IFS-FESOM2-SR, IFS-NEMO-ER, ICON-ESM-ER, HadGEM3-GC5 |
| Reference Dataset | ERA5 |
| Units | W/m2 |
| Period | 1980–2014 |
Summary high
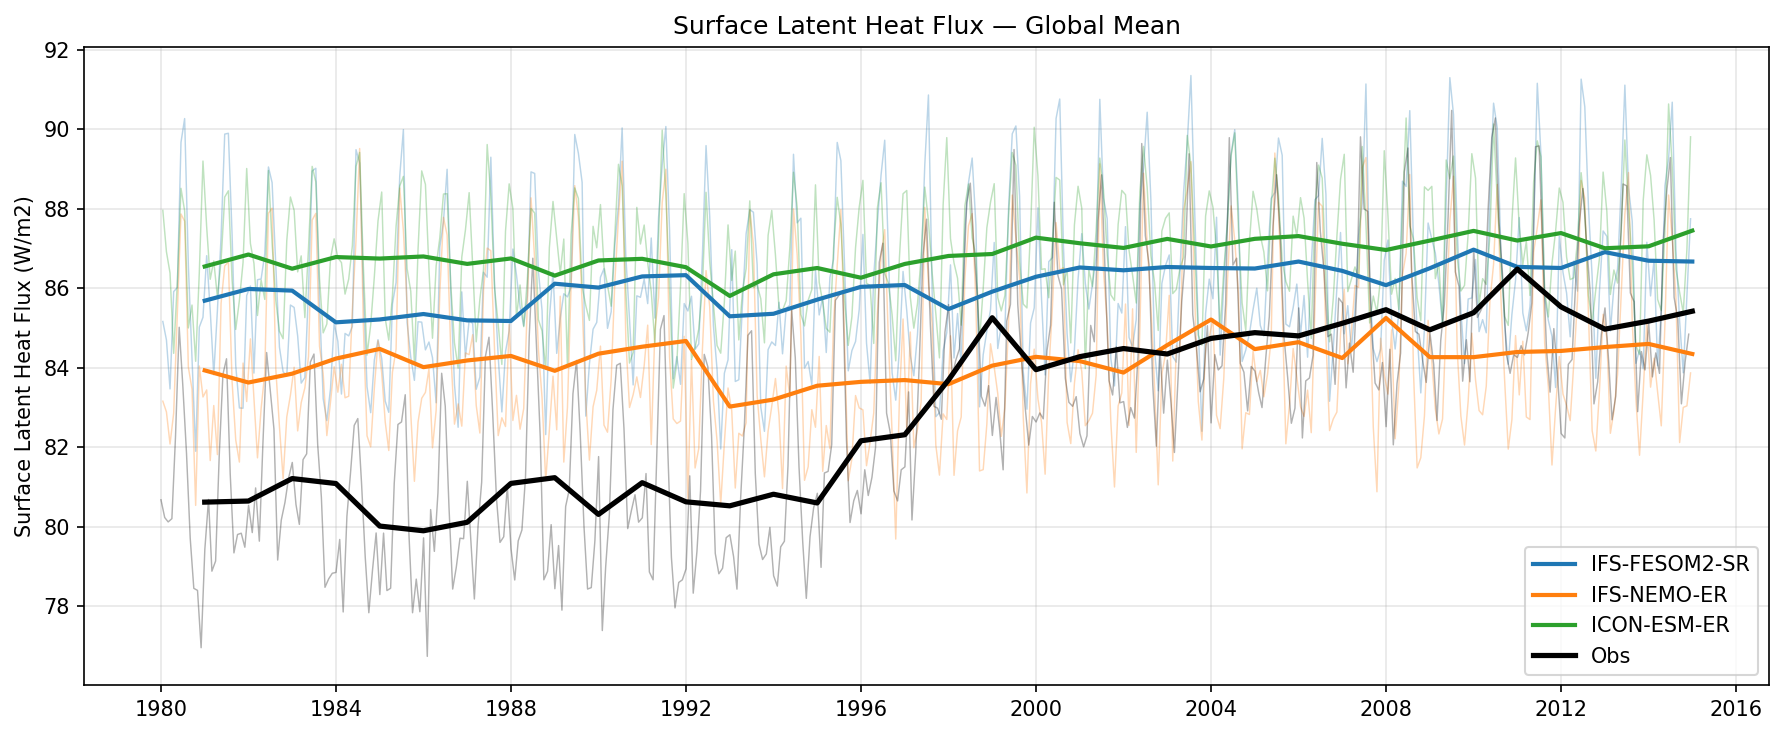
Time series of global mean surface latent heat flux (1980–2015) comparing three high-resolution coupled models against ERA5 reanalysis.
Key Findings
- ERA5 exhibits a strong, non-linear increasing trend (~5 W/m² increase) that is not reproduced by the models, particularly a steep rise between 1997 and 2000.
- All models show a positive bias (+3 to +6 W/m²) relative to ERA5 during the 1980s and early 1990s; however, due to the trend in ERA5, the values converge in the post-2010 period.
- ICON-ESM-ER simulates the most vigorous hydrological cycle (highest mean flux ~87 W/m²), while IFS-NEMO-ER is the lowest among models (~84 W/m²), with IFS-FESOM2-SR lying in between.
Spatial Patterns
Temporal evolution shows a distinct 'step' in ERA5 around the late 1990s, likely associated with observing system changes (e.g., ATOVS), which absent in the physically consistent model simulations. A dip in fluxes around 1992 (Pinatubo) is visible in most datasets.
Model Agreement
The models agree closely with each other on the long-term stability (weak trend) of the global latent heat flux, contrasting sharply with the reanalysis. Inter-model spread in the mean state is ~3 W/m².
Physical Interpretation
Global latent heat flux is energy-limited. The models, driven by historical forcings, show a stable response consistent with slowly warming SSTs. The strong trend in ERA5 is likely spurious, driven by changes in satellite data assimilation rather than physical climate change. The higher mean flux in models suggests either a warm SST bias or differences in bulk formula parameterisations compared to the reanalysis.
Caveats
- The significant trend in ERA5 makes it a problematic baseline for evaluating long-term trends in surface fluxes.
- HadGEM3-GC5 is listed in metadata but not visible in the plot legend.
Surface Sensible Heat Flux Global Mean Time Series
| Variables | hfss |
|---|---|
| Models | IFS-FESOM2-SR, IFS-NEMO-ER, ICON-ESM-ER, HadGEM3-GC5 |
| Reference Dataset | ERA5 |
| Units | W/m2 |
| Period | 1980–2014 |
Summary high
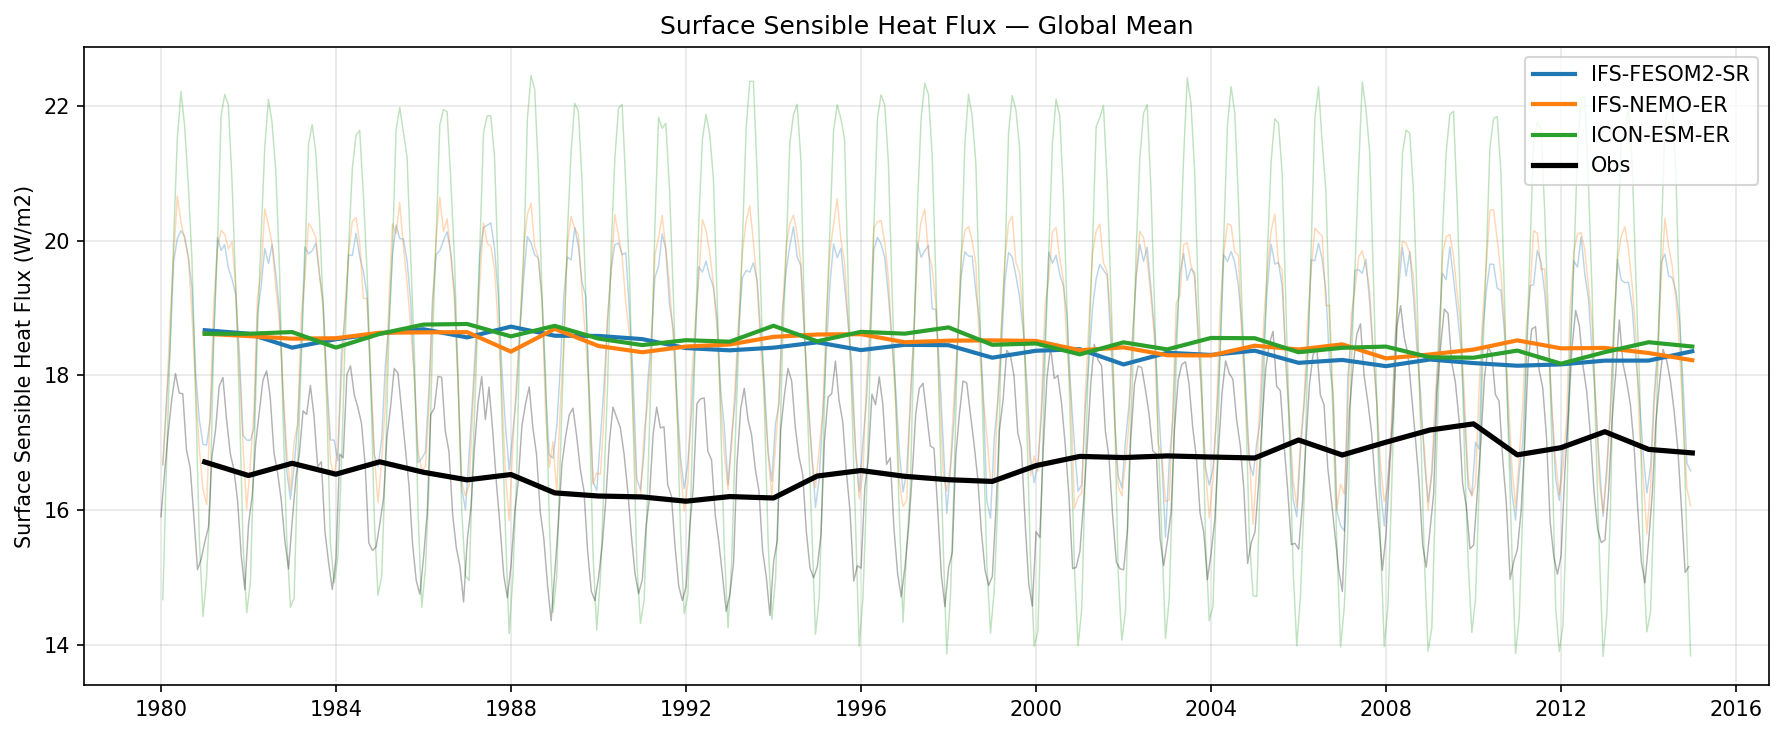
This time series compares the global mean surface sensible heat flux of three high-resolution EERIE models against ERA5 reanalysis from 1980 to 2014, revealing a systematic positive bias in all models.
Key Findings
- All three models (IFS-FESOM2-SR, IFS-NEMO-ER, ICON-ESM-ER) consistently overestimate global mean sensible heat flux by approximately 1.5–2.0 W/m² compared to ERA5 (models ~18.5 W/m² vs ERA5 ~16.5–17 W/m²).
- ICON-ESM-ER displays a significantly amplified seasonal cycle (amplitude ~8 W/m²) compared to the IFS-based models and ERA5 (amplitude ~3.5–4 W/m²).
- ERA5 shows a gradual upward trend in sensible heat flux, particularly evident after 2000 (rising from ~16.5 to ~17.2 W/m²), which is not clearly captured by the flatter model trends.
Spatial Patterns
N/A (Global mean time series). Temporally, the seasonal cycle dominates the variability, with ICON-ESM-ER showing much larger seasonal excursions (peaks >22 W/m², troughs <14 W/m²) than other datasets.
Model Agreement
The models show high inter-model agreement regarding the annual mean magnitude (clustering tightly around 18.5 W/m²), differing significantly from the observational reanalysis baseline. However, they disagree on seasonal amplitude, with ICON being an outlier.
Physical Interpretation
The systematic positive bias suggests that the coupled models maintain either larger air-sea/land-air temperature differences or stronger transfer coefficients (wind speed x drag) than the reanalysis. The large seasonal amplitude in ICON-ESM-ER likely points to specific sensitivity in its land surface coupling or sea-ice flux parameterizations during extreme seasons.
Caveats
- HadGEM3-GC5 is listed in the metadata but does not appear in the figure legend or plot traces.
- Fluxes in ERA5 are derived from model physics (forecast) rather than direct assimilation, meaning the 'observation' itself has model-dependent uncertainty.
Total Precipitation Rate Global Mean Time Series
| Variables | pr |
|---|---|
| Models | IFS-FESOM2-SR, IFS-NEMO-ER, ICON-ESM-ER, HadGEM3-GC5, MPI-ESM1-2-LR, GISS-E2-1-G, IPSL-CM6A-LR, ACCESS-ESM1-5, EC-Earth3, CNRM-CM6-1, AWI-CM-1-1-MR, CNRM-ESM2-1, FGOALS-g3, INM-CM5-0, MRI-ESM2-0 |
| Reference Dataset | ERA5 |
| Units | kg/m2/s |
| Period | 1980–2014 |
Summary high
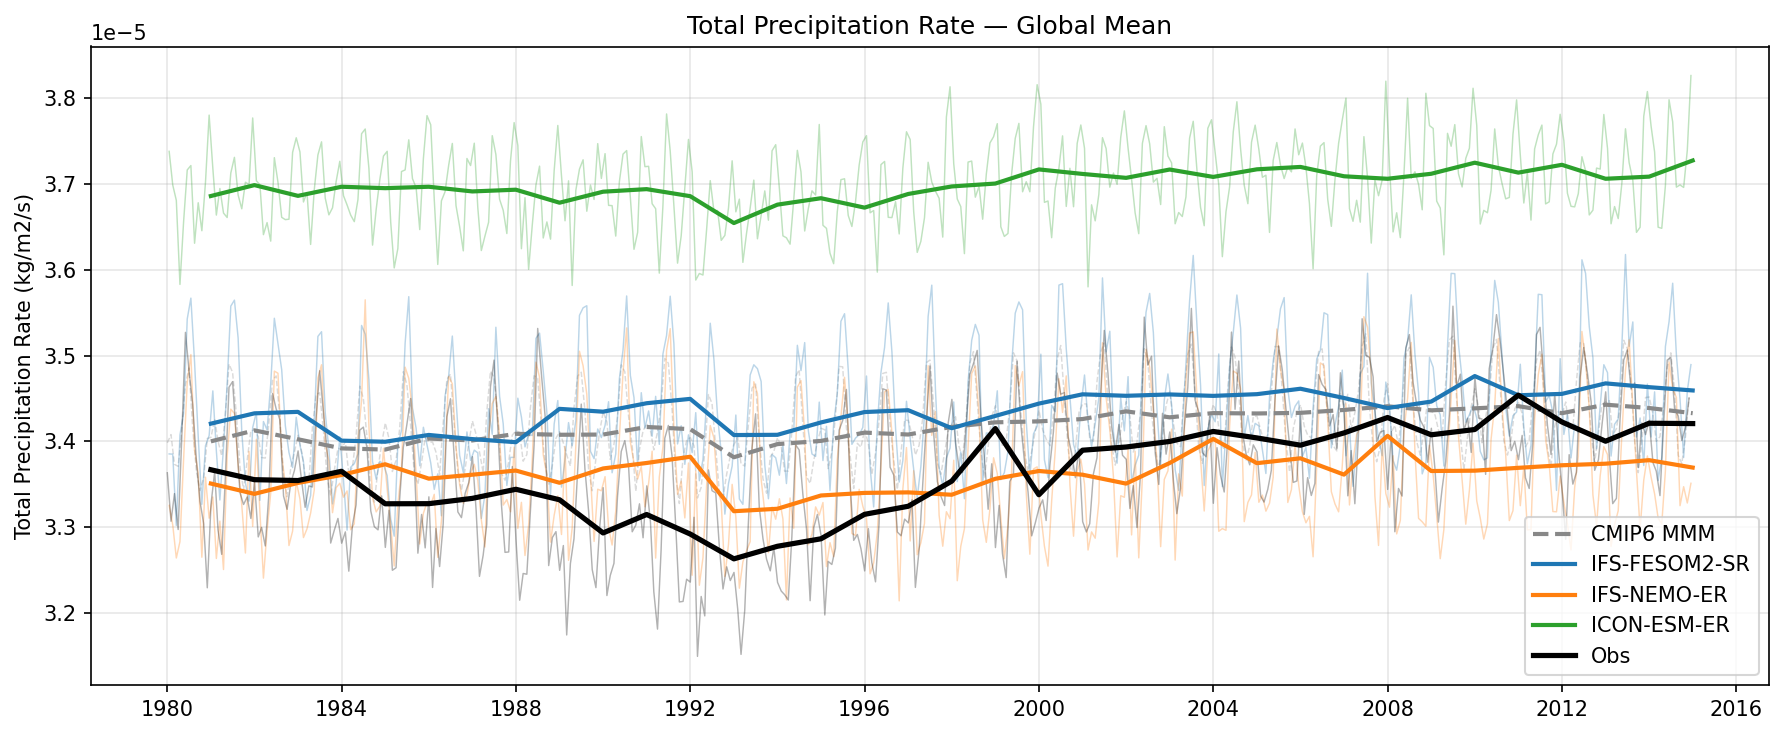
This time series compares global annual-mean total precipitation rates (1980–2014) from four high-resolution EERIE models against ERA5 reanalysis and the CMIP6 ensemble.
Key Findings
- IFS-NEMO-ER shows the best agreement with ERA5 in terms of absolute magnitude (~3.35 × 10⁻⁵ kg/m²/s), tracking the reanalysis closely throughout the period.
- ICON-ESM-ER and HadGEM3-GC5 exhibit a substantial systematic wet bias, with global mean precipitation rates (~3.7 × 10⁻⁵ kg/m²/s) approximately 10% higher than ERA5 and the CMIP6 multi-model mean.
- IFS-FESOM2-SR lies between the two groups, aligning very closely with the CMIP6 Multi-Model Mean (MMM) but remaining wet-biased relative to ERA5.
- ERA5 displays a notable dip in global precipitation around 1991–1992 (likely the Pinatubo eruption response) and a gradual increasing trend after 2000, features only partially captured by the models.
Spatial Patterns
Temporal evolution is dominated by the mean state offsets between model groups rather than shared interannual variability. ERA5 shows a distinct multi-decadal fluctuation (dip in 90s, rise in 2000s) that is not robustly reproduced in phase or amplitude by the free-running coupled models, which is expected as they are not assimilated runs.
Model Agreement
There is a distinct bifurcation in model behavior: the IFS-based models (NEMO and FESOM) cluster near the observational/CMIP6-mean range, while ICON and HadGEM3 cluster together at a significantly higher precipitation regime. The inter-model spread is large, exceeding the amplitude of internal variability.
Physical Interpretation
Global mean precipitation is energetically constrained by the atmospheric radiative cooling rate and surface latent heat flux. The high precipitation bias in ICON-ESM-ER and HadGEM3-GC5 suggests these models have a more intense hydrological cycle, likely driven by either excessive surface evaporation or stronger atmospheric radiative cooling balancing the latent heat release. The close match of IFS-NEMO to ERA5 suggests a well-tuned global energy and water budget in that configuration.
Caveats
- ERA5 is a reanalysis product; while it assimilates moisture data, precipitation is a forecast variable and can have its own biases compared to gauge/satellite products (e.g., GPCP).
- The 'wet' models (ICON/HadGEM3) are at the upper edge of the CMIP6 member distribution, indicating their behavior is extreme even within the context of standard resolution models.
Mean Sea Level Pressure Global Mean Time Series
| Variables | psl |
|---|---|
| Models | IFS-FESOM2-SR, IFS-NEMO-ER, ICON-ESM-ER, HadGEM3-GC5, MPI-ESM1-2-LR, GISS-E2-1-G, IPSL-CM6A-LR, ACCESS-ESM1-5, EC-Earth3, CNRM-CM6-1, AWI-CM-1-1-MR, CNRM-ESM2-1, FGOALS-g3, INM-CM5-0, MRI-ESM2-0 |
| Reference Dataset | ERA5 |
| Units | Pa |
| Period | 1980–2014 |
Summary high
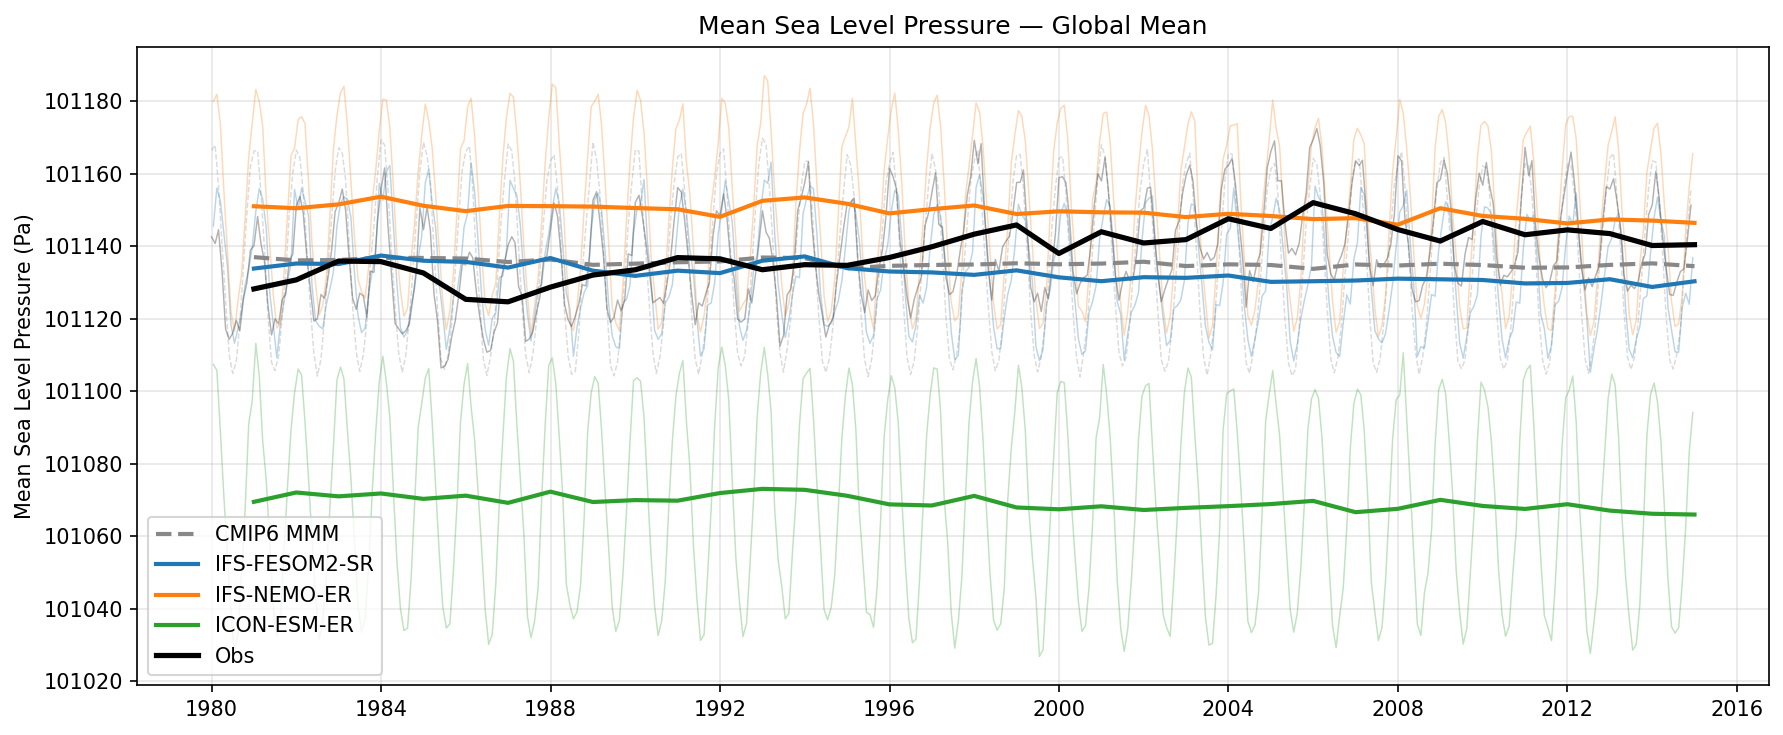
This time series illustrates the global mean Mean Sea Level Pressure (MSLP) from 1980 to 2014 for three high-resolution EERIE models (ICON-ESM-ER, IFS-FESOM2-SR, IFS-NEMO-ER) compared against ERA5 reanalysis and the CMIP6 ensemble.
Key Findings
- ICON-ESM-ER exhibits a distinct systematic negative bias of approximately 70 Pa (0.7 hPa) relative to ERA5, stabilizing around 101070 Pa.
- IFS-NEMO-ER and IFS-FESOM2-SR show excellent agreement with ERA5, maintaining global means within ~10–20 Pa of the observational baseline (~101130–101150 Pa).
- All three EERIE models demonstrate stable long-term means with negligible drift, indicating robust conservation of atmospheric mass.
- The CMIP6 ensemble background reveals a substantial spread in global mean MSLP (ranging from ~100950 to ~101280 Pa), significantly larger than the spread among the high-resolution EERIE models.
Spatial Patterns
While this is a global mean time series, the temporal evolution shows a clear seasonal cycle (thin lines) driven by global water vapor mass fluctuations. ERA5 displays a slight upward trend in annual mean pressure over the period (~10 Pa increase) which is not replicated by the free-running models.
Model Agreement
IFS-FESOM2-SR tracks the CMIP6 Multi-Model Mean and early-period ERA5 very closely. IFS-NEMO-ER is slightly higher but stable. ICON-ESM-ER is an outlier with a persistent low bias. The inter-model spread in the EERIE group is notably smaller than the full CMIP6 range.
Physical Interpretation
Global mean MSLP is a proxy for the total mass of the atmosphere (dry air + water vapor). Systematic offsets, like that seen in ICON-ESM-ER, typically result from differences in initial total dry air mass specification or methodologies used to reduce surface pressure to sea level over orography, rather than dynamical errors. The seasonal cycle reflects the annual cycle of global atmospheric water vapor content.
Caveats
- Differences in global mean MSLP are often due to initialization choices (total mass) rather than model physics performance.
- The slight trend in ERA5 may result from changes in the observing system or data assimilation inputs rather than a physical mass trend.
Surface Downwelling Longwave Global Mean Time Series
| Variables | rlds |
|---|---|
| Models | IFS-FESOM2-SR, IFS-NEMO-ER, ICON-ESM-ER |
| Reference Dataset | ERA5 |
| Units | W/m2 |
| Period | 1980–2014 |
Summary high
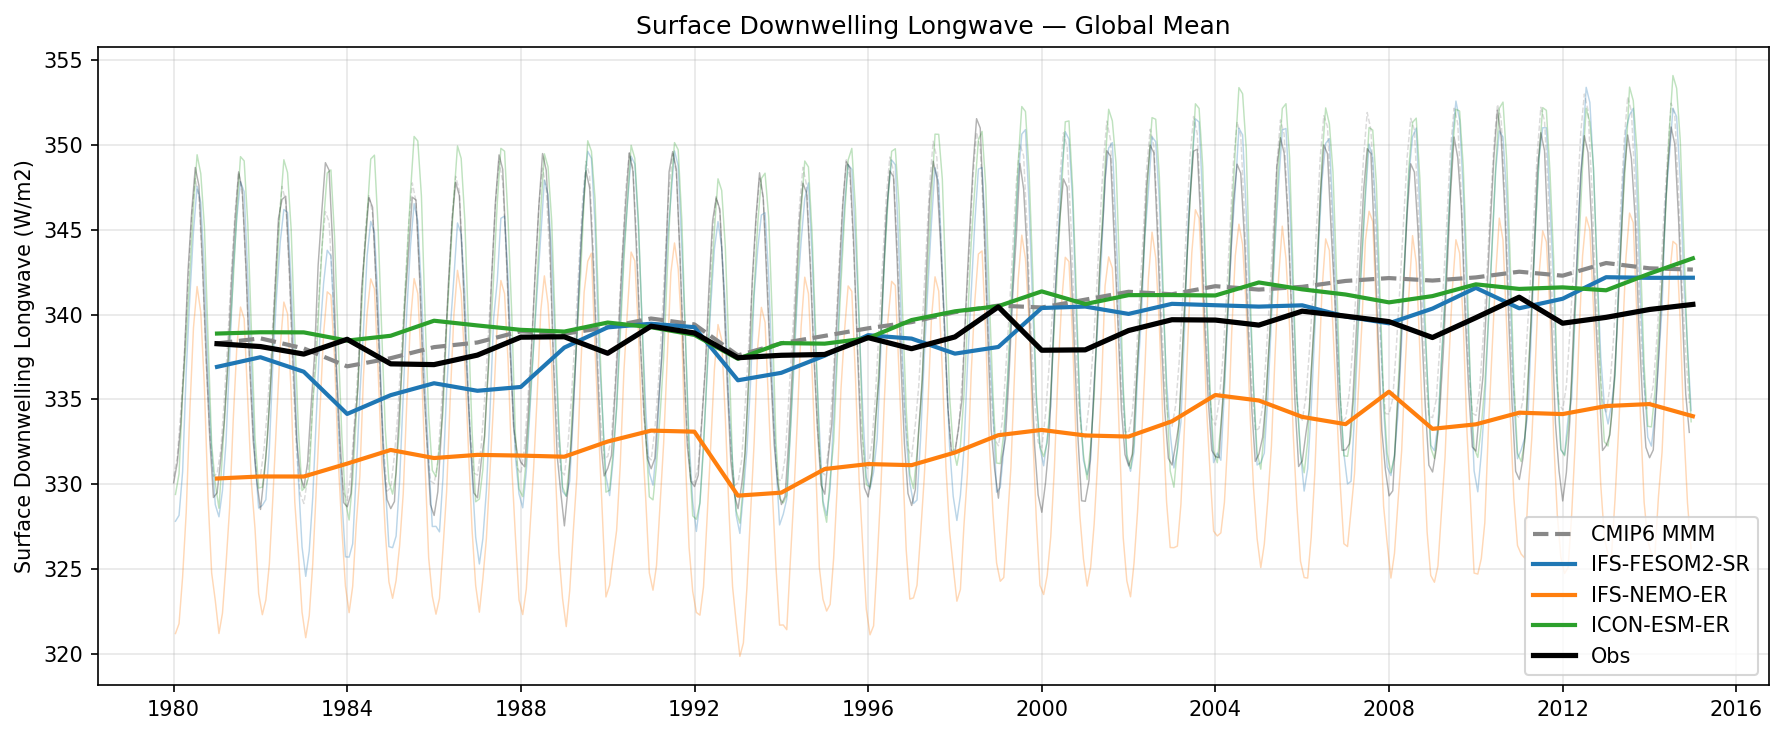
Global mean surface downwelling longwave radiation (1980–2014) exhibits a consistent upward trend across all datasets, driven by global warming. The models display distinct mean state biases relative to ERA5, with IFS-NEMO-ER underestimating significantly while ICON-ESM-ER and the CMIP6 ensemble slightly overestimate.
Key Findings
- IFS-NEMO-ER shows a substantial systematic negative bias of approximately -7 to -8 W/m² relative to ERA5 throughout the simulation period.
- ICON-ESM-ER closely tracks the CMIP6 Multi-Model Mean (MMM), both exhibiting a slight positive bias (~1–3 W/m²) compared to ERA5.
- IFS-FESOM2-SR shows a distinct evolution: it starts with a negative bias in the 1980s but converges toward ERA5, showing excellent agreement (within ~1 W/m²) from the mid-1990s onward.
- The radiative signature of the 1991 Mt. Pinatubo eruption is captured as a distinct dip (~1–2 W/m²) in 1992–1993 by all models and observations.
Spatial Patterns
While this is a global mean time series, the background monthly curves reveal seasonal amplitude differences. IFS-NEMO-ER displays a noticeably larger seasonal cycle than other models or observations, driven primarily by deeper annual minima (winter troughs), suggesting excessive radiative cooling in winter months.
Model Agreement
Inter-model spread is significant (~10 W/m²). ICON-ESM-ER aligns well with the conventional resolution CMIP6 MMM. IFS-FESOM2-SR provides the best match to ERA5 in the latter half of the period, while IFS-NEMO-ER is a distinct low-bias outlier.
Physical Interpretation
The upward trend in all time series reflects the increasing greenhouse effect (higher atmospheric temperature and emissivity due to CO₂ and water vapor). The strong negative bias in IFS-NEMO-ER likely stems from a deficit in lower tropospheric water vapor or cloud cover (reducing atmospheric emissivity), or a cold bias in the lower atmosphere. The pronounced winter minima in IFS-NEMO-ER reinforce the hypothesis of insufficient cloud cover allowing excessive surface radiative cooling. The initial discrepancy in IFS-FESOM2-SR suggests model spin-up or initialization drift before stabilising.
Caveats
- IFS-FESOM2-SR exhibits potential initialization shock or drift in the first decade (1980–1990).
- ERA5 is a reanalysis product and relies on its own model physics, though it is the standard reference for this metric.
Surface Downwelling Shortwave Global Mean Time Series
| Variables | rsds |
|---|---|
| Models | IFS-FESOM2-SR, IFS-NEMO-ER, ICON-ESM-ER |
| Reference Dataset | ERA5 |
| Units | W/m2 |
| Period | 1980–2014 |
Summary high
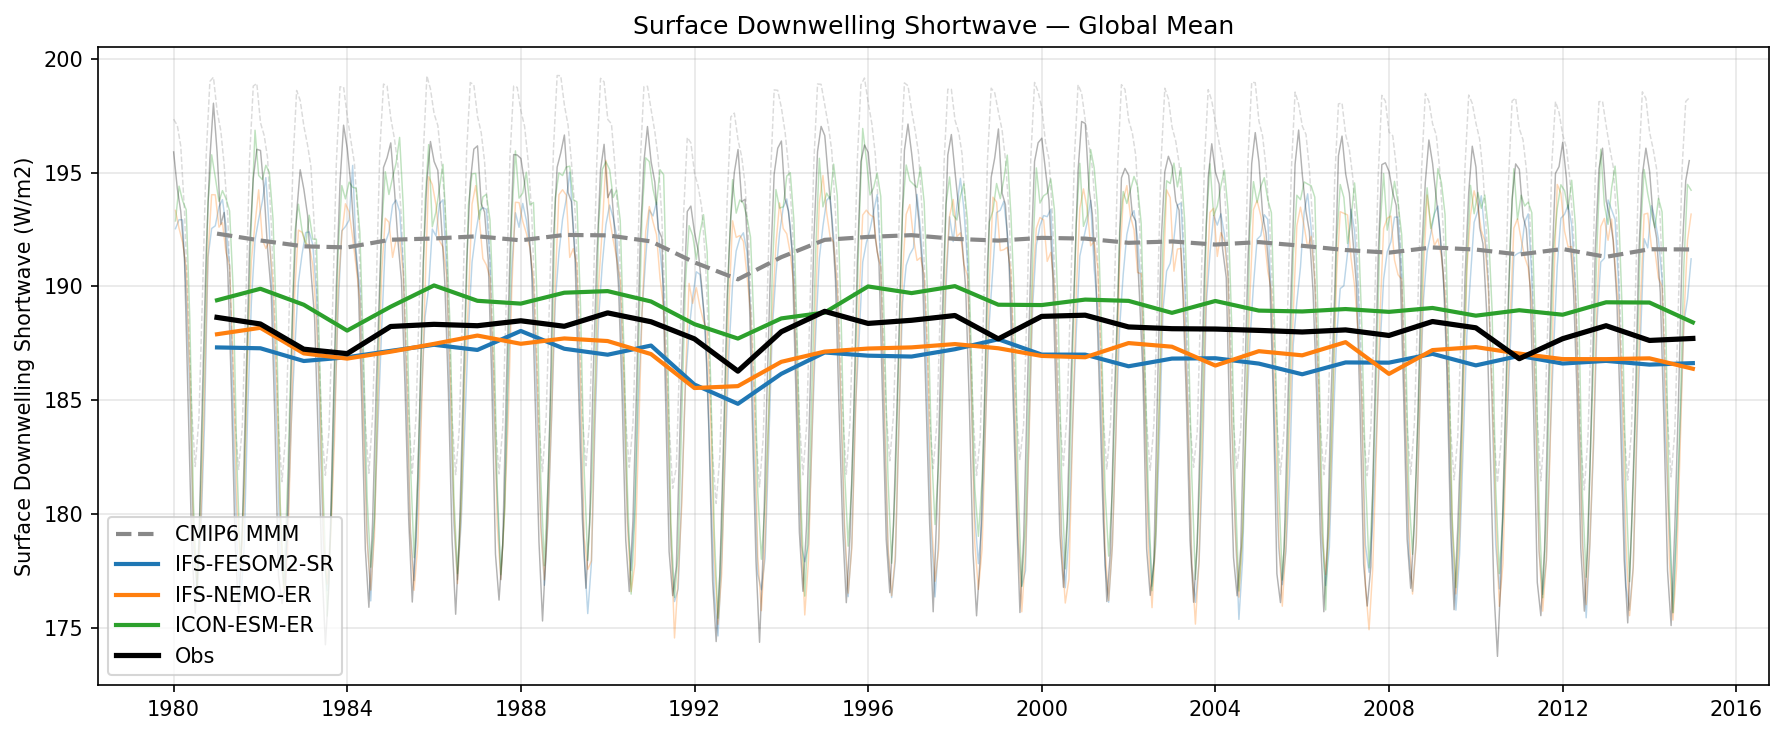
Global mean surface downwelling shortwave radiation time series (1980–2014) showing that IFS-based high-resolution models closely track ERA5 reanalysis, while ICON-ESM-ER and the CMIP6 multi-model mean exhibit systematic positive biases.
Key Findings
- The CMIP6 Multi-Model Mean significantly overestimates surface shortwave radiation (~192 W/m²) compared to ERA5 (~188 W/m²), a bias of approximately +4 W/m².
- ICON-ESM-ER shows a moderate positive bias (~+2 W/m²), while both IFS models (IFS-FESOM2-SR and IFS-NEMO-ER) slightly underestimate radiation (~-1 W/m²) but track the ERA5 reference very closely.
- All models and observations clearly capture the radiative dimming associated with the 1991 Mt. Pinatubo eruption, showing a distinct dip in surface insolation followed by a recovery over several years.
Spatial Patterns
N/A (Global mean time series). Temporally, the dominant low-frequency feature is the volcanic depression in the early 1990s, superimposed on the annual seasonal cycle.
Model Agreement
The two IFS-based models (NEMO and FESOM coupled) show high agreement with each other and the ERA5 reference, likely reflecting shared atmospheric physics. ICON-ESM-ER stands apart with higher insolation values, closer to but still lower than the CMIP6 mean.
Physical Interpretation
The positive biases in CMIP6 and ICON-ESM-ER indicate an underestimation of atmospheric attenuation, likely due to deficiencies in total cloud cover, cloud optical depth, or aerosol loading compared to the ERA5 reanalysis. The tight clustering of IFS models with ERA5 is expected given that ERA5 is produced using a version of the IFS atmosphere.
Caveats
- The observational reference is ERA5 reanalysis, which shares model lineage with the IFS simulations, likely inflating the apparent skill of the IFS-FESOM2-SR and IFS-NEMO-ER models relative to ICON.
- Surface downwelling shortwave is a derived product in reanalysis, not a direct observation like CERES.
2m Temperature Global Mean Time Series
| Variables | tas |
|---|---|
| Models | IFS-FESOM2-SR, IFS-NEMO-ER, ICON-ESM-ER, HadGEM3-GC5, MPI-ESM1-2-LR, GISS-E2-1-G, IPSL-CM6A-LR, ACCESS-ESM1-5, EC-Earth3, CNRM-CM6-1, AWI-CM-1-1-MR, CNRM-ESM2-1, FGOALS-g3, INM-CM5-0, MRI-ESM2-0 |
| Reference Dataset | ERA5 |
| Units | K |
| Period | 1980–2014 |
Summary high
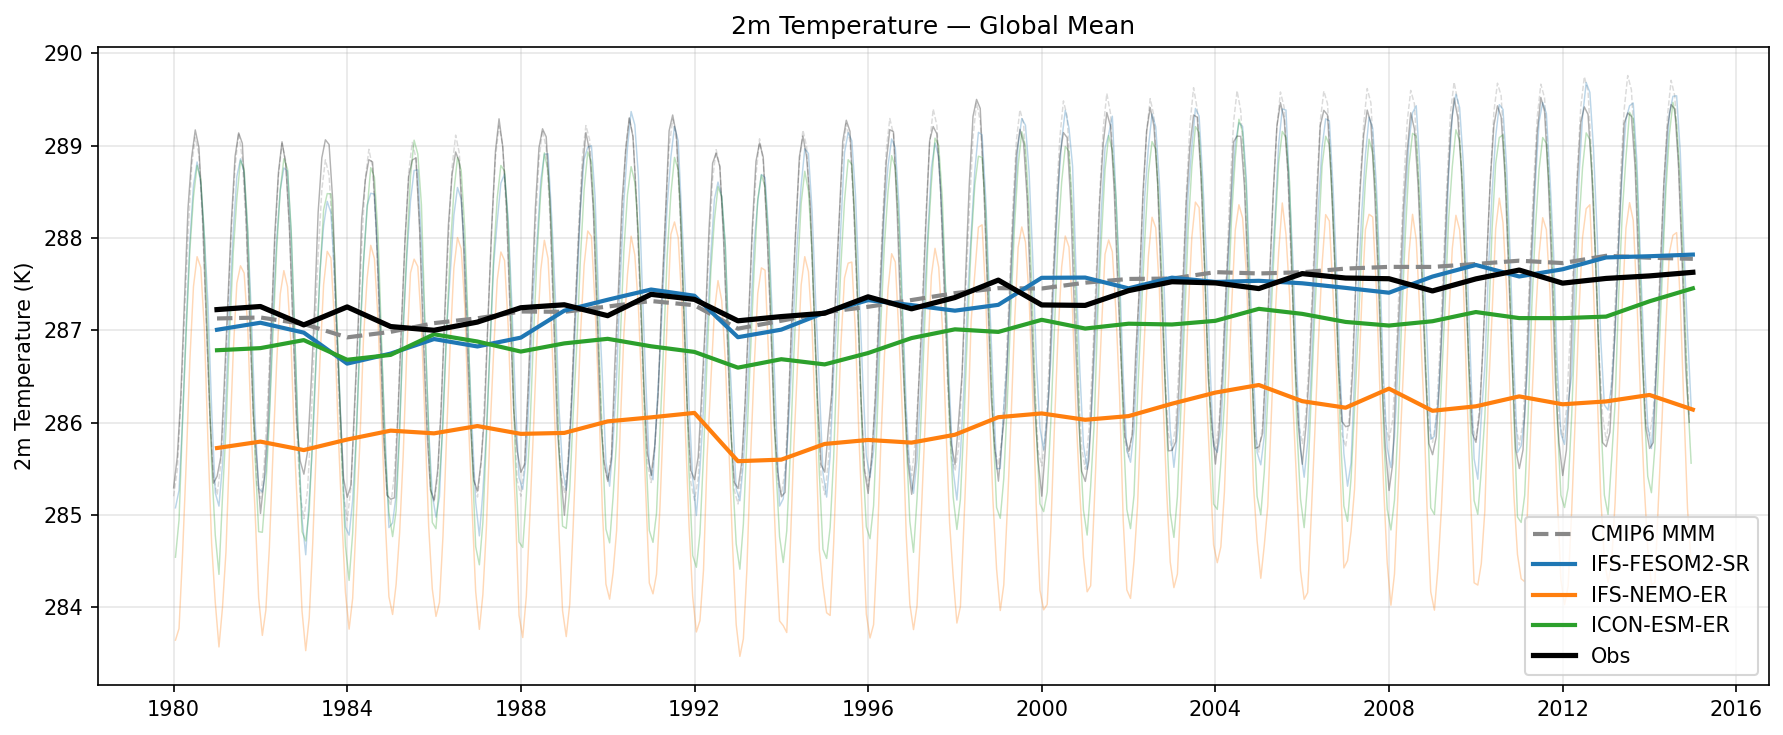
This time series compares the global mean 2m temperature evolution (1980–2014) of four high-resolution EERIE models against ERA5 reanalysis and the CMIP6 ensemble.
Key Findings
- IFS-FESOM2-SR (blue) demonstrates the highest skill in reproducing the absolute magnitude of global mean temperature, closely tracking ERA5 and the CMIP6 Multi-Model Mean.
- IFS-NEMO-ER (orange) exhibits a substantial systematic cold bias of approximately 1.5 K relative to ERA5, the largest deviation among the highlighted models.
- HadGEM3-GC5 (red) shows a warm bias of ~0.5–0.8 K and exhibits a stronger warming trend towards the end of the period (post-2010) compared to ERA5.
- ICON-ESM-ER (green) displays a moderate cold bias of ~0.4 K but captures the interannual variability and long-term warming trend consistent with observations.
Spatial Patterns
While this is a global mean time series, temporal patterns reveal that all models successfully capture the volcanic cooling signal following the 1991 Mount Pinatubo eruption, visible as a dip in the annual means. The seasonal cycle amplitude (indicated by the thin background lines) appears consistent across models, though IFS-NEMO-ER shows particularly deep seasonal minima.
Model Agreement
Inter-model spread in absolute global mean temperature is significant (~2.5 K range), larger than the difference between the CMIP6 multi-model mean and ERA5. However, all models agree on the sign of the long-term warming trend and the timing of major interannual variability features.
Physical Interpretation
The stark difference (~1.5 K) between IFS-FESOM2-SR and IFS-NEMO-ER—which share the same atmospheric core (IFS) but differ in ocean components—highlights the critical role of the ocean model and air-sea coupling strategy in determining the Earth system's equilibrium temperature state. The stronger warming in HadGEM3-GC5 may suggest a higher climate sensitivity or weaker aerosol cooling efficacy in that model configuration.
Caveats
- Absolute global mean temperature is a bulk metric often subject to tuning; biases here do not necessarily reflect the quality of regional anomalies or dynamics.
- The analysis period ends in 2014, omitting the record-warm years that followed.
10m U Wind Global Mean Time Series
| Variables | uas |
|---|---|
| Models | IFS-FESOM2-SR, IFS-NEMO-ER, ICON-ESM-ER, HadGEM3-GC5, MPI-ESM1-2-LR, GISS-E2-1-G, IPSL-CM6A-LR, ACCESS-ESM1-5, EC-Earth3, CNRM-CM6-1, AWI-CM-1-1-MR, CNRM-ESM2-1, INM-CM5-0, MRI-ESM2-0 |
| Reference Dataset | ERA5 |
| Units | m/s |
| Period | 1980–2014 |
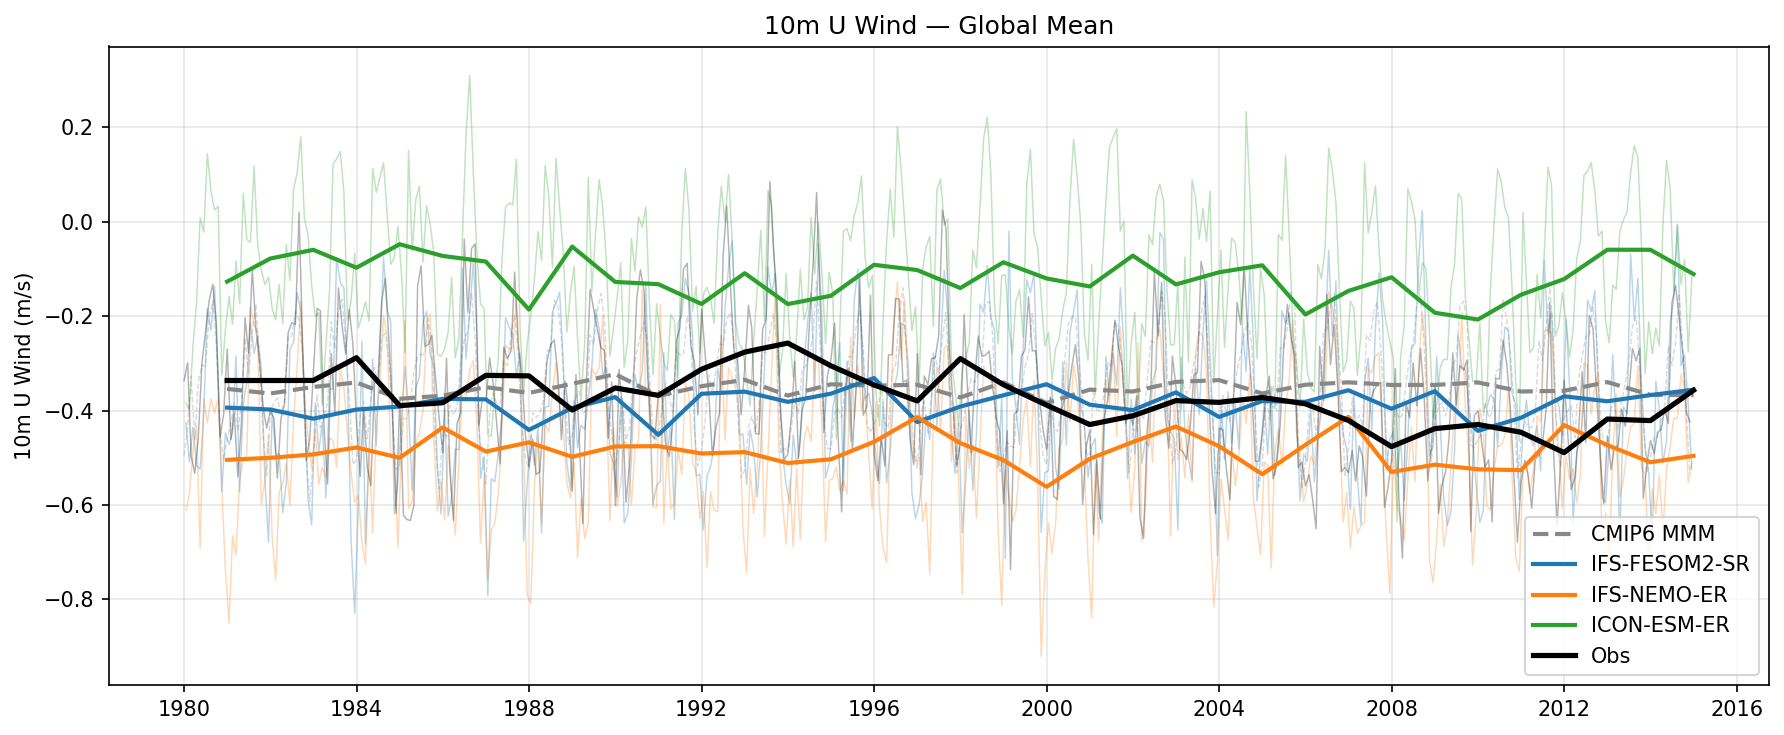
Summary high
This time series analyzes the global mean 10m zonal wind (U component) from 1980 to 2014, comparing four high-resolution EERIE climate models against ERA5 reanalysis and the CMIP6 ensemble.
Key Findings
- IFS-FESOM2-SR shows excellent agreement with ERA5, closely reproducing the observational global mean of approximately -0.4 m/s.
- ICON-ESM-ER exhibits a distinct positive bias (~ +0.25 m/s relative to ERA5), indicating a global deficit in easterly momentum or excessively strong westerlies.
- IFS-NEMO-ER displays a negative bias (~ -0.1 m/s), meaning its global mean easterly component is stronger than observed, contrasting with the shared-atmosphere IFS-FESOM2-SR.
- The CMIP6 Multi-Model Mean (MMM) aligns well with the ERA5 climatology, although individual CMIP6 members show a large spread (from -0.8 to +0.2 m/s) that encapsulates all EERIE models.
Spatial Patterns
While the diagnostic is a global mean time series, the temporal evolution shows no significant multi-decadal trend for either the models or ERA5. The global mean remains consistently negative (easterly dominance) throughout the period. Interannual variability is evident in all models, though the phasing does not match ERA5 due to the free-running nature of the simulations.
Model Agreement
IFS-FESOM2-SR provides the best match to ERA5. There is significant divergence between the two IFS-based configurations (FESOM2-SR vs NEMO-ER), with the latter producing stronger net easterlies (more negative mean). ICON-ESM-ER is the outlier with the weakest net easterlies.
Physical Interpretation
The global mean U wind represents a residual balance between the vast surface area of tropical trade winds (easterlies) and the mid-latitude westerlies. A negative global mean indicates the dominance of the trade wind area. Biases reflect shifts in this balance: ICON's positive bias suggests either weak trades or an equatorward shift of westerlies. The contrast between IFS-FESOM2-SR and IFS-NEMO-ER—which share atmospheric physics—suggests that ocean coupling strategies (surface current feedback, SST biases, or drag coefficients) play a critical role in determining the net global surface wind stress.
Caveats
- Global mean values can obscure compensating regional errors (e.g., too strong trades balancing too strong westerlies).
- As these are free-running coupled simulations, they are not expected to reproduce the specific timing of observed interannual variability (e.g., specific ENSO years) seen in ERA5.
10m V Wind Global Mean Time Series
| Variables | vas |
|---|---|
| Models | IFS-FESOM2-SR, IFS-NEMO-ER, ICON-ESM-ER, HadGEM3-GC5, MPI-ESM1-2-LR, GISS-E2-1-G, IPSL-CM6A-LR, ACCESS-ESM1-5, EC-Earth3, CNRM-CM6-1, AWI-CM-1-1-MR, CNRM-ESM2-1, INM-CM5-0, MRI-ESM2-0 |
| Reference Dataset | ERA5 |
| Units | m/s |
| Period | 1980–2014 |
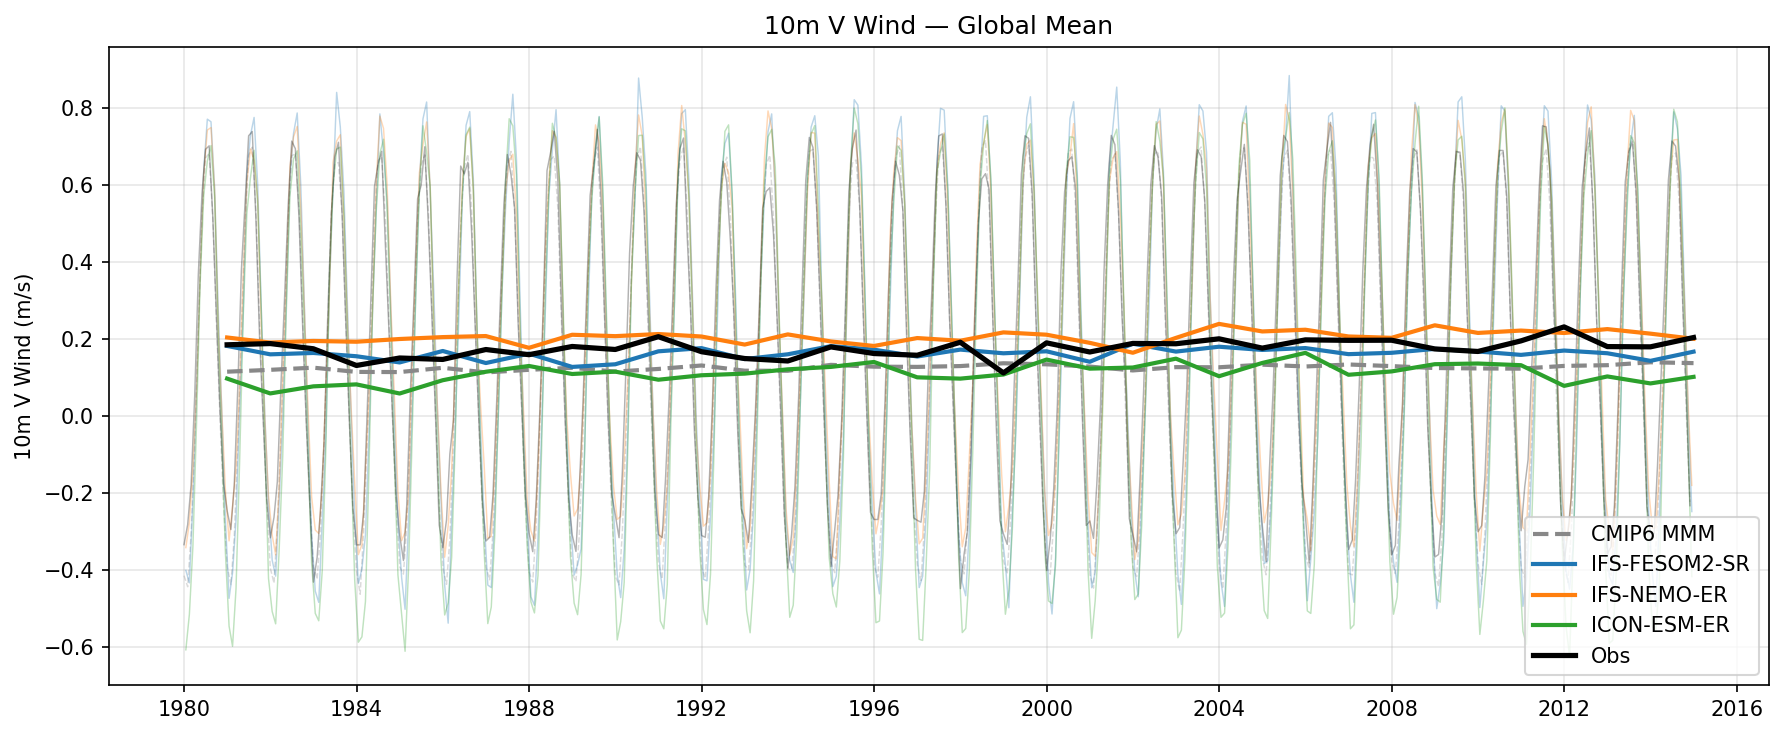
Summary high
Global mean 10m meridional (V) wind time series (1980–2014) comparing four high-resolution EERIE models and the CMIP6 ensemble against ERA5 reanalysis.
Key Findings
- The global mean V wind exhibits a strong seasonal cycle (amplitude ~1.4 m/s), oscillating between net southward (-0.6 m/s) and net northward (+0.8 m/s) surface flow.
- IFS-NEMO-ER and IFS-FESOM2-SR show the best agreement with ERA5 annual means (~0.18 m/s), with IFS-NEMO-ER slightly overestimating (~0.20 m/s) and IFS-FESOM2-SR tracking very closely.
- ICON-ESM-ER and HadGEM3-GC5 underestimate the annual mean global V wind relative to ERA5, clustering with the CMIP6 Multi-Model Mean around 0.10–0.14 m/s.
- Interannual variability in the annual means is captured to varying degrees, with IFS models showing some synchronization with ERA5 features (e.g., the dip around 2010-2011).
Spatial Patterns
While this is a global-mean time series, the strong seasonal oscillation reflects the hemispheric asymmetry of the general circulation, specifically the cross-equatorial flow associated with the Hadley cell migration and monsoons.
Model Agreement
High agreement on the amplitude and phase of the seasonal cycle across all models. For annual means, the IFS-based models outperform the CMIP6 mean and other EERIE models (ICON, HadGEM3) in matching the ERA5 magnitude.
Physical Interpretation
The consistently positive global mean annual V wind implies a net northward surface mass transport component in the boundary layer, likely compensating for upper-tropospheric southward transport or reflecting the mean position of the ITCZ north of the equator and stronger Southern Hemisphere trade winds. Deviations in models suggest biases in the strength or asymmetry of the Hadley circulation/trade winds.
Caveats
- Global mean V wind is a residual of large cancelling northward and southward flows; small regional biases can significantly affect the global mean.
- The analysis does not reveal where spatially the meridional wind biases originate (e.g., tropics vs mid-latitudes).