Evaluation Global Climatology Biases CMIP6
CMIP6 Multi-Model Mean Context
Comparison with CMIP6 ensemble mean from 11 members.
Contributing models: ACCESS-ESM1-5, AWI-CM-1-1-MR, CNRM-CM6-1, CNRM-ESM2-1, EC-Earth3, FGOALS-g3, GISS-E2-1-G, INM-CM5-0, IPSL-CM6A-LR, MPI-ESM1-2-LR, MRI-ESM2-0
Synthesis
Related diagnostics
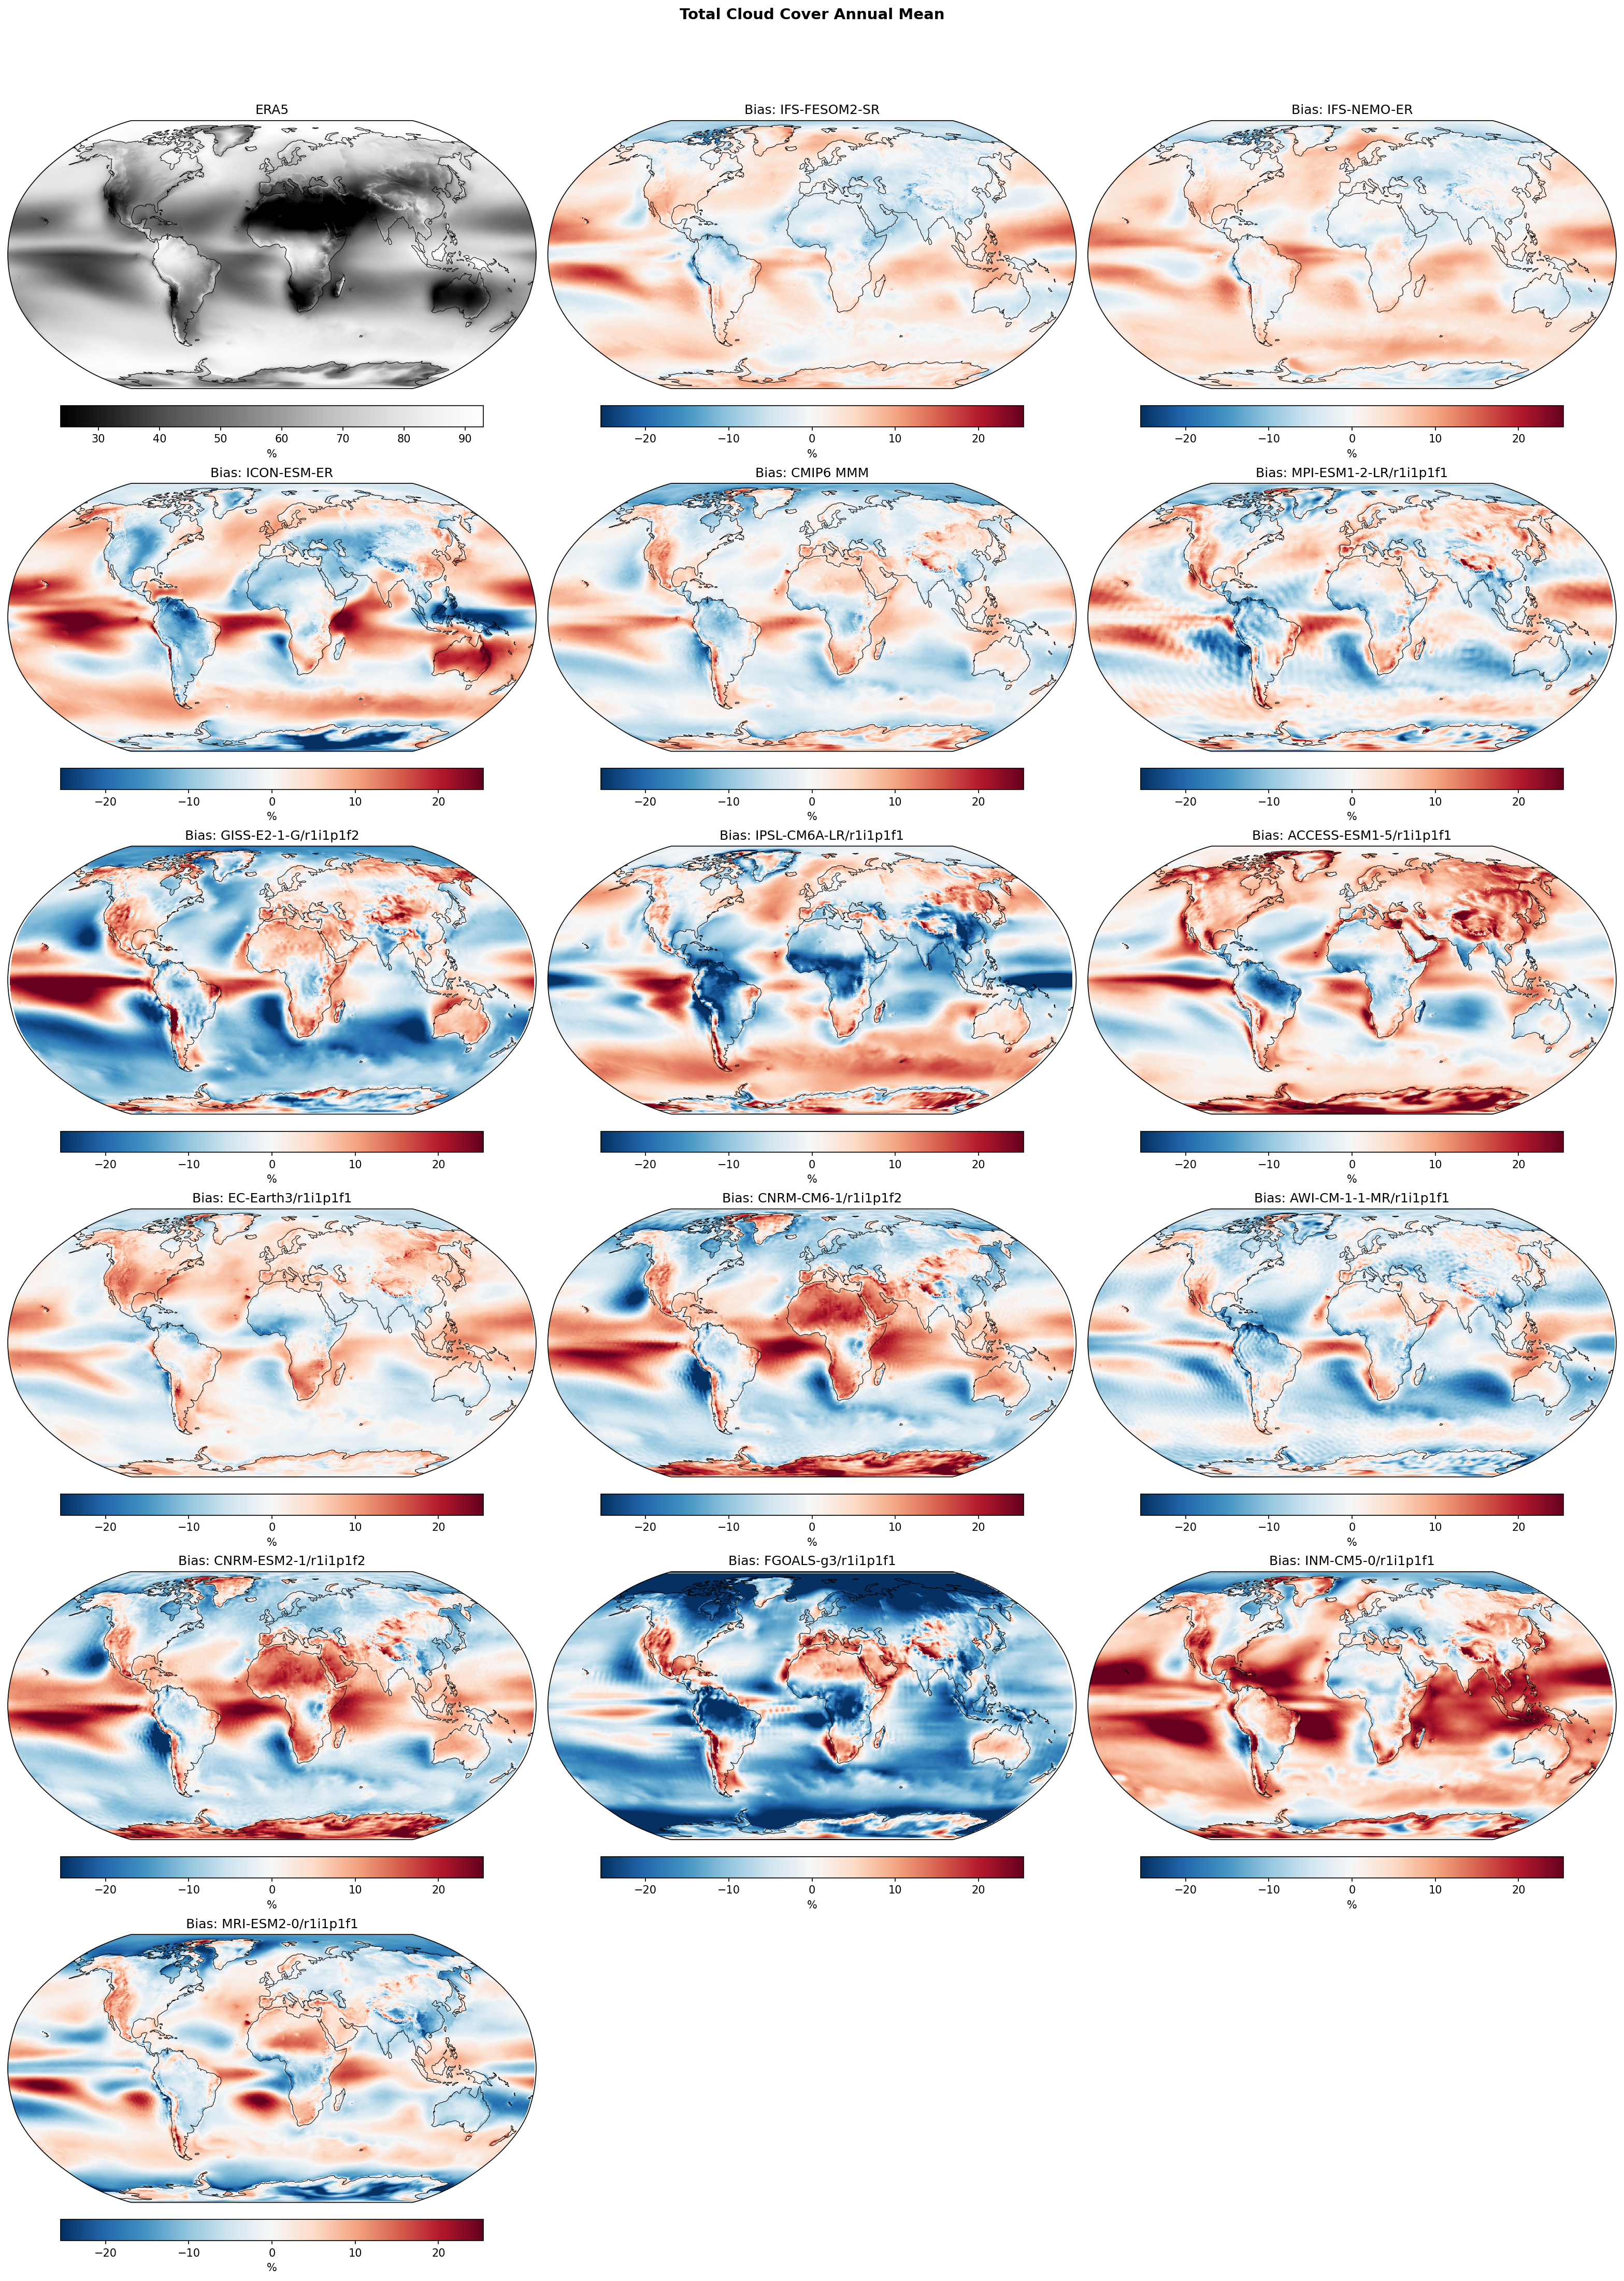
Total Cloud Cover Annual Mean Bias
| Variables | clt |
|---|---|
| Models | IFS-FESOM2-SR, IFS-NEMO-ER, ICON-ESM-ER, HadGEM3-GC5, CMIP6 MMM, MPI-ESM1-2-LR/r1i1p1f1, GISS-E2-1-G/r1i1p1f2, IPSL-CM6A-LR/r1i1p1f1, ACCESS-ESM1-5/r1i1p1f1, EC-Earth3/r1i1p1f1, CNRM-CM6-1/r1i1p1f2, AWI-CM-1-1-MR/r1i1p1f1, CNRM-ESM2-1/r1i1p1f2, FGOALS-g3/r1i1p1f1, INM-CM5-0/r1i1p1f1, MRI-ESM2-0/r1i1p1f1 |
| Reference Dataset | ERA5 |
| Units | % |
| Period | 1980–2014 |
| IFS-FESOM2-SR | Global Mean Bias: 1.40 · Rmse: 4.90 |
| IFS-NEMO-ER | Global Mean Bias: 2.36 · Rmse: 4.85 |
| ICON-ESM-ER | Global Mean Bias: 2.05 · Rmse: 9.41 |
| HadGEM3-GC5 | Global Mean Bias: 8.42 · Rmse: 10.42 |
| CMIP6 MMM | Global Mean Bias: -0.47 · Rmse: 5.43 |
| MPI-ESM1-2-LR/r1i1p1f1 | Global Mean Bias: -0.19 · Rmse: 6.78 |
| GISS-E2-1-G/r1i1p1f2 | Global Mean Bias: -2.98 · Rmse: 11.22 |
| IPSL-CM6A-LR/r1i1p1f1 | Global Mean Bias: -1.14 · Rmse: 10.13 |
| ACCESS-ESM1-5/r1i1p1f1 | Global Mean Bias: 2.36 · Rmse: 8.39 |
| EC-Earth3/r1i1p1f1 | Global Mean Bias: 1.28 · Rmse: 5.44 |
| CNRM-CM6-1/r1i1p1f2 | Global Mean Bias: 0.89 · Rmse: 9.49 |
| AWI-CM-1-1-MR/r1i1p1f1 | Global Mean Bias: -3.02 · Rmse: 6.99 |
| CNRM-ESM2-1/r1i1p1f2 | Global Mean Bias: 0.87 · Rmse: 9.66 |
| FGOALS-g3/r1i1p1f1 | Global Mean Bias: -9.37 · Rmse: 14.80 |
| INM-CM5-0/r1i1p1f1 | Global Mean Bias: 7.06 · Rmse: 11.80 |
| MRI-ESM2-0/r1i1p1f1 | Global Mean Bias: -0.93 · Rmse: 7.54 |
Summary high
This figure evaluates annual mean total cloud cover biases in high-resolution EERIE models (IFS, ICON, HadGEM3) and CMIP6 models against ERA5 reanalysis. The IFS-based simulations demonstrate superior performance with the lowest RMSEs (< 5%), while other models exhibit significant systematic biases in the tropics and stratocumulus decks.
Key Findings
- IFS-FESOM2-SR and IFS-NEMO-ER exhibit the best agreement with observations (RMSE ~4.8-4.9%), significantly outperforming the CMIP6 Multi-Model Mean (RMSE ~5.4%) and other EERIE models.
- A pervasive negative bias (underestimation) of marine stratocumulus clouds persists off the west coasts of South America, Africa, and North America across almost all models, including the high-resolution runs.
- HadGEM3-GC5 shows a strong, systematic global positive bias (+8.4%), indicating it is too cloudy everywhere compared to ERA5.
- ICON-ESM-ER displays distinct tropical biases, with underestimation in the ITCZ core and overestimation in the flanking subtropical regions, suggesting issues with convective organization or ITCZ width.
Spatial Patterns
The most prominent spatial features are the negative biases in eastern boundary upwelling regions (stratocumulus decks) common to most models. ICON-ESM-ER shows a dipole pattern in the tropics (negative equator, positive off-equator) and strong positive biases in the Southern Ocean. HadGEM3-GC5 is dominated by a spatially uniform positive bias. The IFS models show weak positive biases in the trade wind cumulus regions and weak negative biases over land.
Model Agreement
The IFS-based models agree closely with each other and generally agree well with ERA5. There is significant divergence among the other models: HadGEM3 and INM-CM5 are systematically too cloudy, while FGOALS-g3 is systematically too clear. The CMIP6 MMM effectively averages out the extreme global offsets but retains the structural deficit in stratocumulus regions.
Physical Interpretation
The widespread negative bias in stratocumulus regions highlights the persistent difficulty of parameterising boundary layer clouds and sharp inversion layers, even at eddy-rich resolutions (~10km). The positive biases in the Southern Ocean (seen strongly in ICON and HadGEM3) likely relate to cloud phase parameterisation (excessive supercooled liquid water). The tropical dipoles in ICON suggest structural errors in the ITCZ position or the convective parameterisation's response to SST gradients.
Caveats
- Total Cloud Cover (TCC) calculation methods (e.g., overlap assumptions) can vary between models and the ERA5 reanalysis, potentially contributing to mean biases.
- ERA5 is a reanalysis product; while robust, comparisons against direct satellite products (e.g., CERES, ISCCP) might yield slightly different magnitudes, particularly in polar regions.
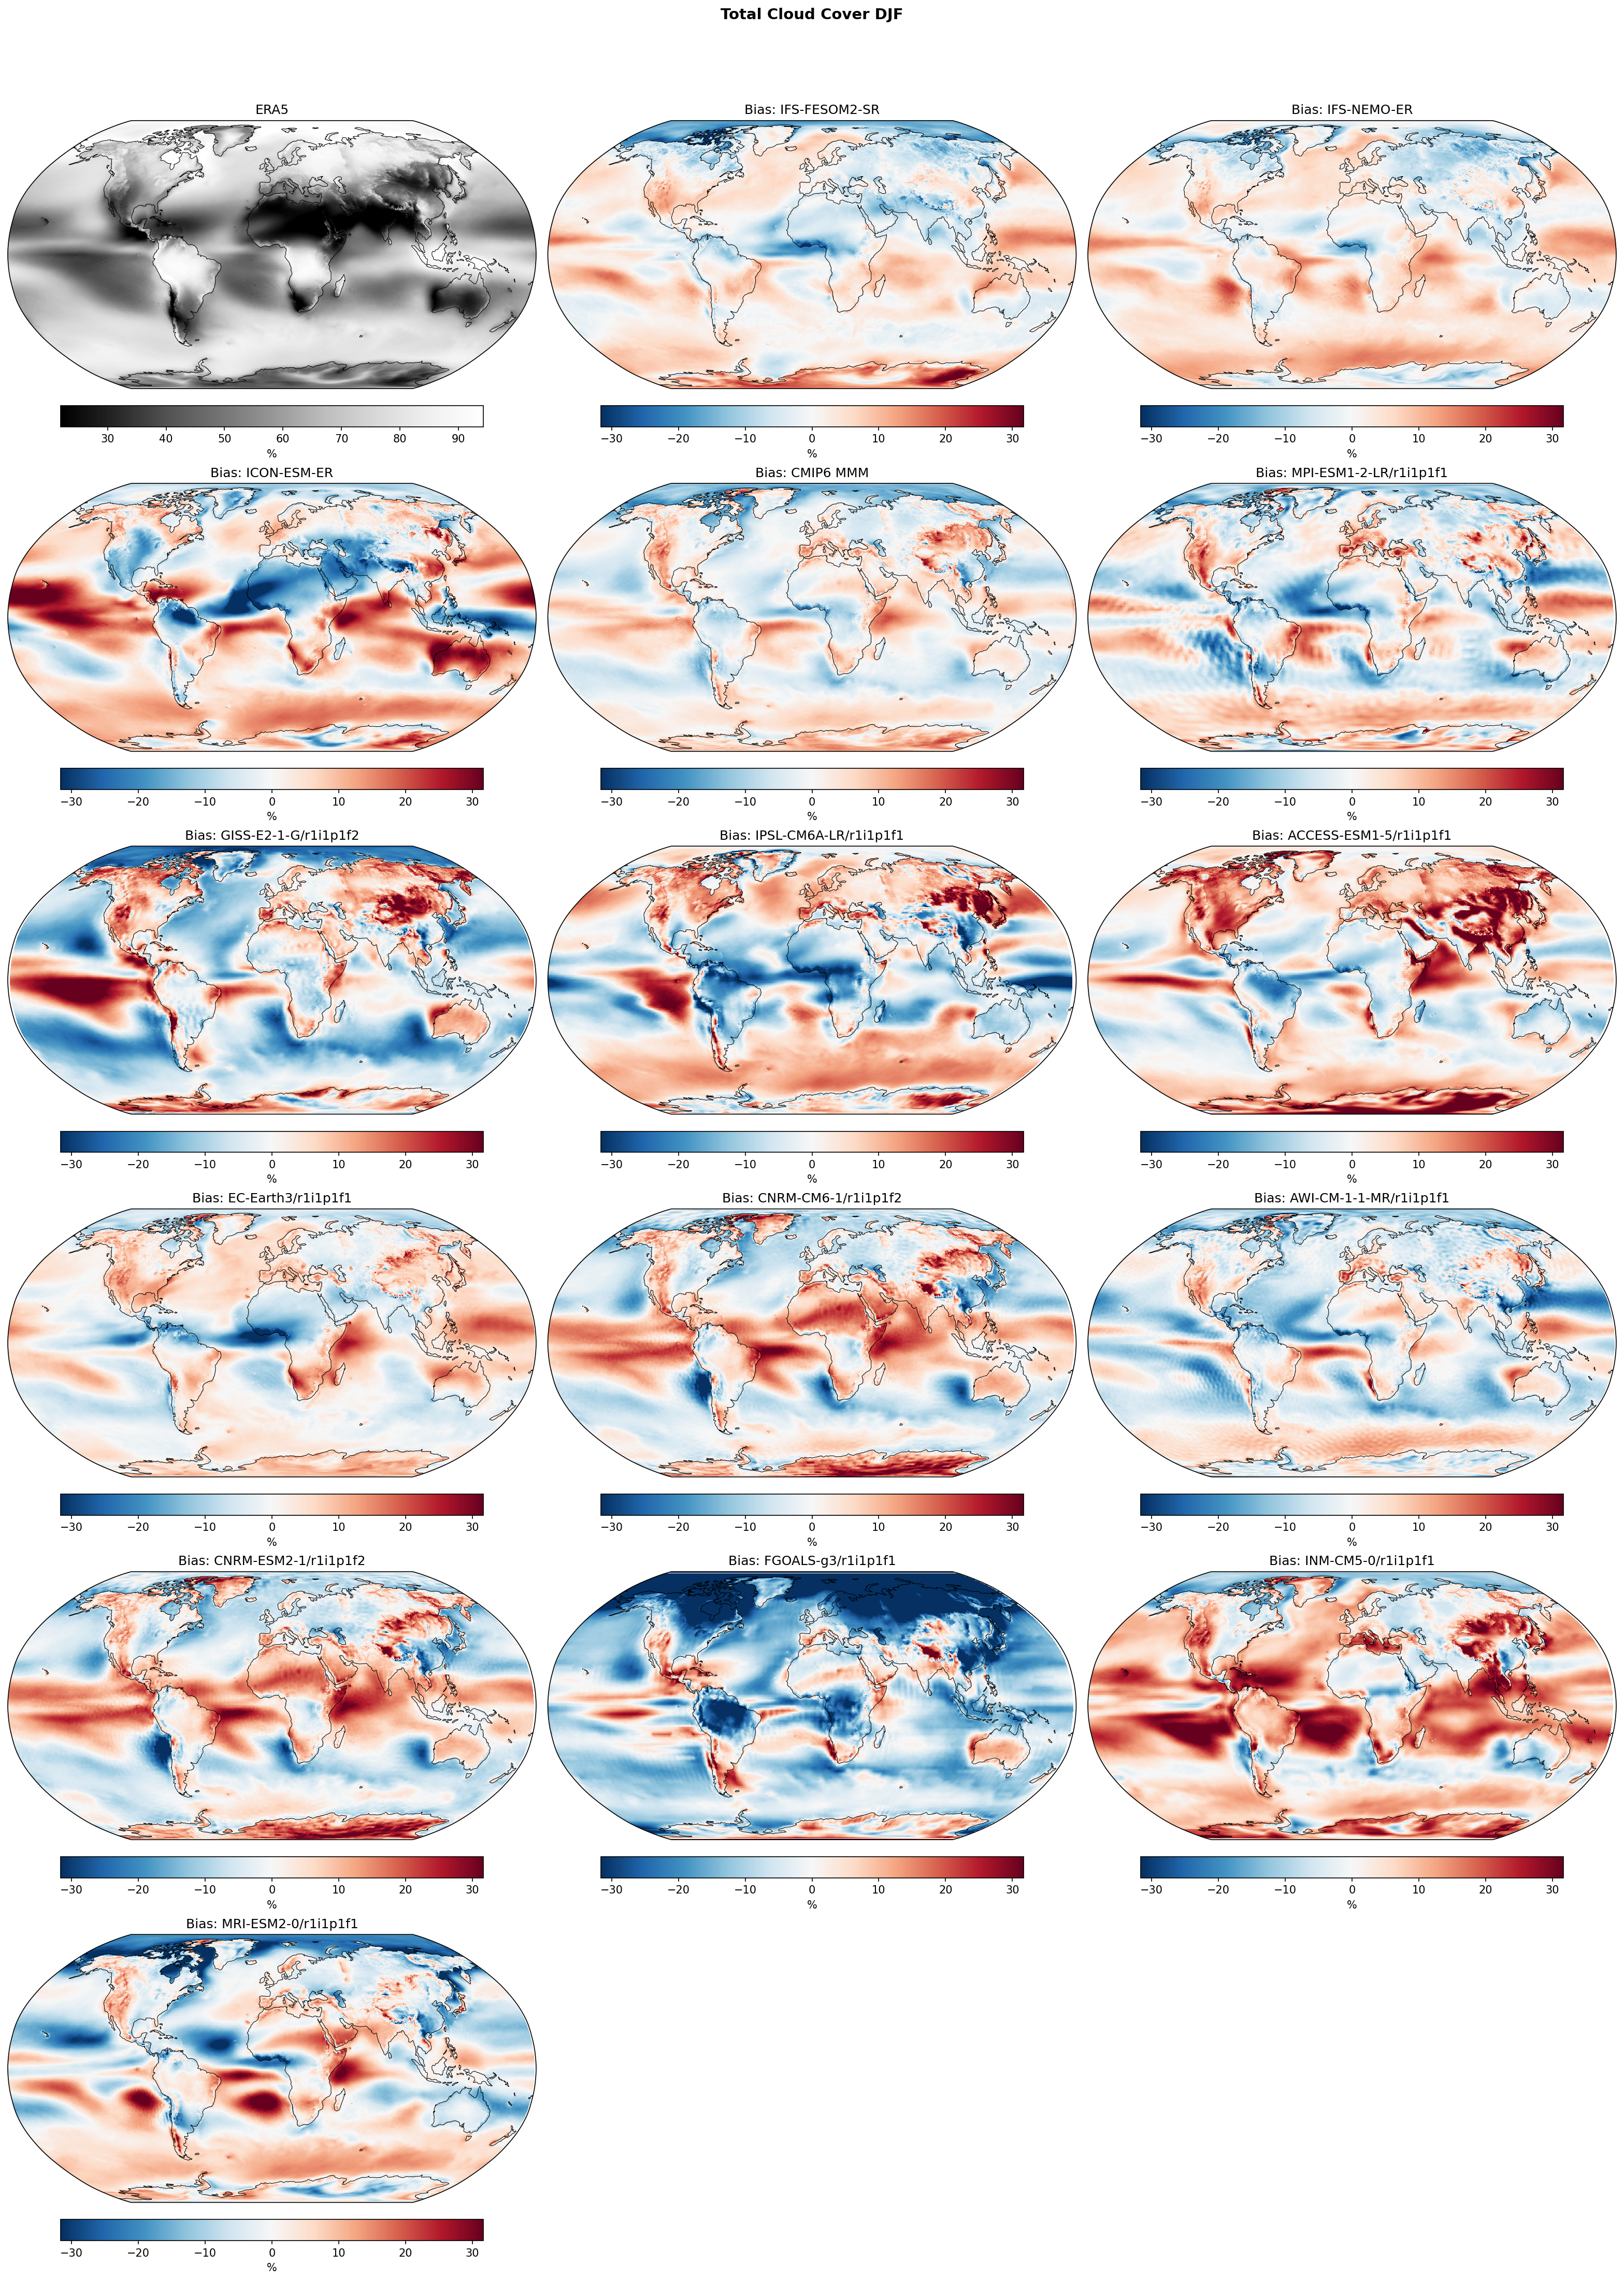
Total Cloud Cover DJF Bias
| Variables | clt |
|---|---|
| Models | IFS-FESOM2-SR, IFS-NEMO-ER, ICON-ESM-ER, HadGEM3-GC5, CMIP6 MMM, MPI-ESM1-2-LR/r1i1p1f1, GISS-E2-1-G/r1i1p1f2, IPSL-CM6A-LR/r1i1p1f1, ACCESS-ESM1-5/r1i1p1f1, EC-Earth3/r1i1p1f1, CNRM-CM6-1/r1i1p1f2, AWI-CM-1-1-MR/r1i1p1f1, CNRM-ESM2-1/r1i1p1f2, FGOALS-g3/r1i1p1f1, INM-CM5-0/r1i1p1f1, MRI-ESM2-0/r1i1p1f1 |
| Reference Dataset | ERA5 |
| Units | % |
| Period | 1980–2014 |
| CMIP6 MMM | Global Mean Bias: 0.06 · Rmse: None |
| MPI-ESM1-2-LR/r1i1p1f1 | Global Mean Bias: -0.47 · Rmse: None |
| GISS-E2-1-G/r1i1p1f2 | Global Mean Bias: -2.07 · Rmse: None |
| IPSL-CM6A-LR/r1i1p1f1 | Global Mean Bias: 0.14 · Rmse: None |
| ACCESS-ESM1-5/r1i1p1f1 | Global Mean Bias: 3.35 · Rmse: None |
| EC-Earth3/r1i1p1f1 | Global Mean Bias: 1.06 · Rmse: None |
| CNRM-CM6-1/r1i1p1f2 | Global Mean Bias: 1.88 · Rmse: None |
| AWI-CM-1-1-MR/r1i1p1f1 | Global Mean Bias: -2.63 · Rmse: None |
| CNRM-ESM2-1/r1i1p1f2 | Global Mean Bias: 1.79 · Rmse: None |
| FGOALS-g3/r1i1p1f1 | Global Mean Bias: -9.89 · Rmse: None |
| INM-CM5-0/r1i1p1f1 | Global Mean Bias: 7.82 · Rmse: None |
| MRI-ESM2-0/r1i1p1f1 | Global Mean Bias: -0.36 · Rmse: None |
Summary high
This figure presents bias maps of DJF Total Cloud Cover (TCC) for EERIE high-resolution coupled models (IFS, ICON, HadGEM3) and CMIP6 models relative to ERA5 reanalysis.
Key Findings
- IFS models (FESOM2-SR and NEMO-ER) systematically underestimate cloud cover in extratropical storm tracks and polar regions (-10% to -30%) but overestimate it in subtropical eastern ocean basins.
- HadGEM3-GC5 exhibits a distinct positive bias (+10% to +30%) over Northern Hemisphere land masses and the Arctic, while retaining the classic negative bias in eastern boundary stratocumulus regions.
- ICON-ESM-ER displays a sharp contrast between excessive cloudiness in the tropical convergence zones (ITCZ/SPCZ) and strong negative biases over NH continents and the Southern Ocean.
Spatial Patterns
The Southern Ocean and North Atlantic storm tracks generally show negative biases (too clear) across most models, particularly ICON and the CMIP6 MMM. In contrast, biases in subtropical stratocumulus decks (off Peru/Chile, Namibia) bifurcate: HadGEM3 and CMIP6 MMM show the typical deficit (blue), whereas IFS models show a surplus (red). HadGEM3 stands out with widespread wintertime cloud overestimation over Eurasia and North America.
Model Agreement
There is extremely high agreement between IFS-FESOM2-SR and IFS-NEMO-ER, confirming that TCC biases are dominated by the atmospheric component. However, inter-model agreement is low, with major centers (ECMWF, MPI, Met Office) showing opposing signs in key regions like the Arctic and NH land.
Physical Interpretation
Negative storm track biases often result from deficits in supercooled liquid water or post-frontal cloud lifetimes. The positive bias in IFS stratocumulus regions suggests a different boundary layer mixing or cloud scheme tuning compared to the standard deficiency seen in HadGEM3/CMIP6. The strong positive land bias in HadGEM3 likely points to issues with stable boundary layer cloud or fog parameterizations in winter conditions.
Caveats
- ERA5 cloud cover is a model-derived reanalysis product, not direct observation; biases may partly reflect ERA5's own structural errors.
- Differences in cloud overlap assumptions (maximum-random vs. generalized) between models can contribute to total cloud cover differences.
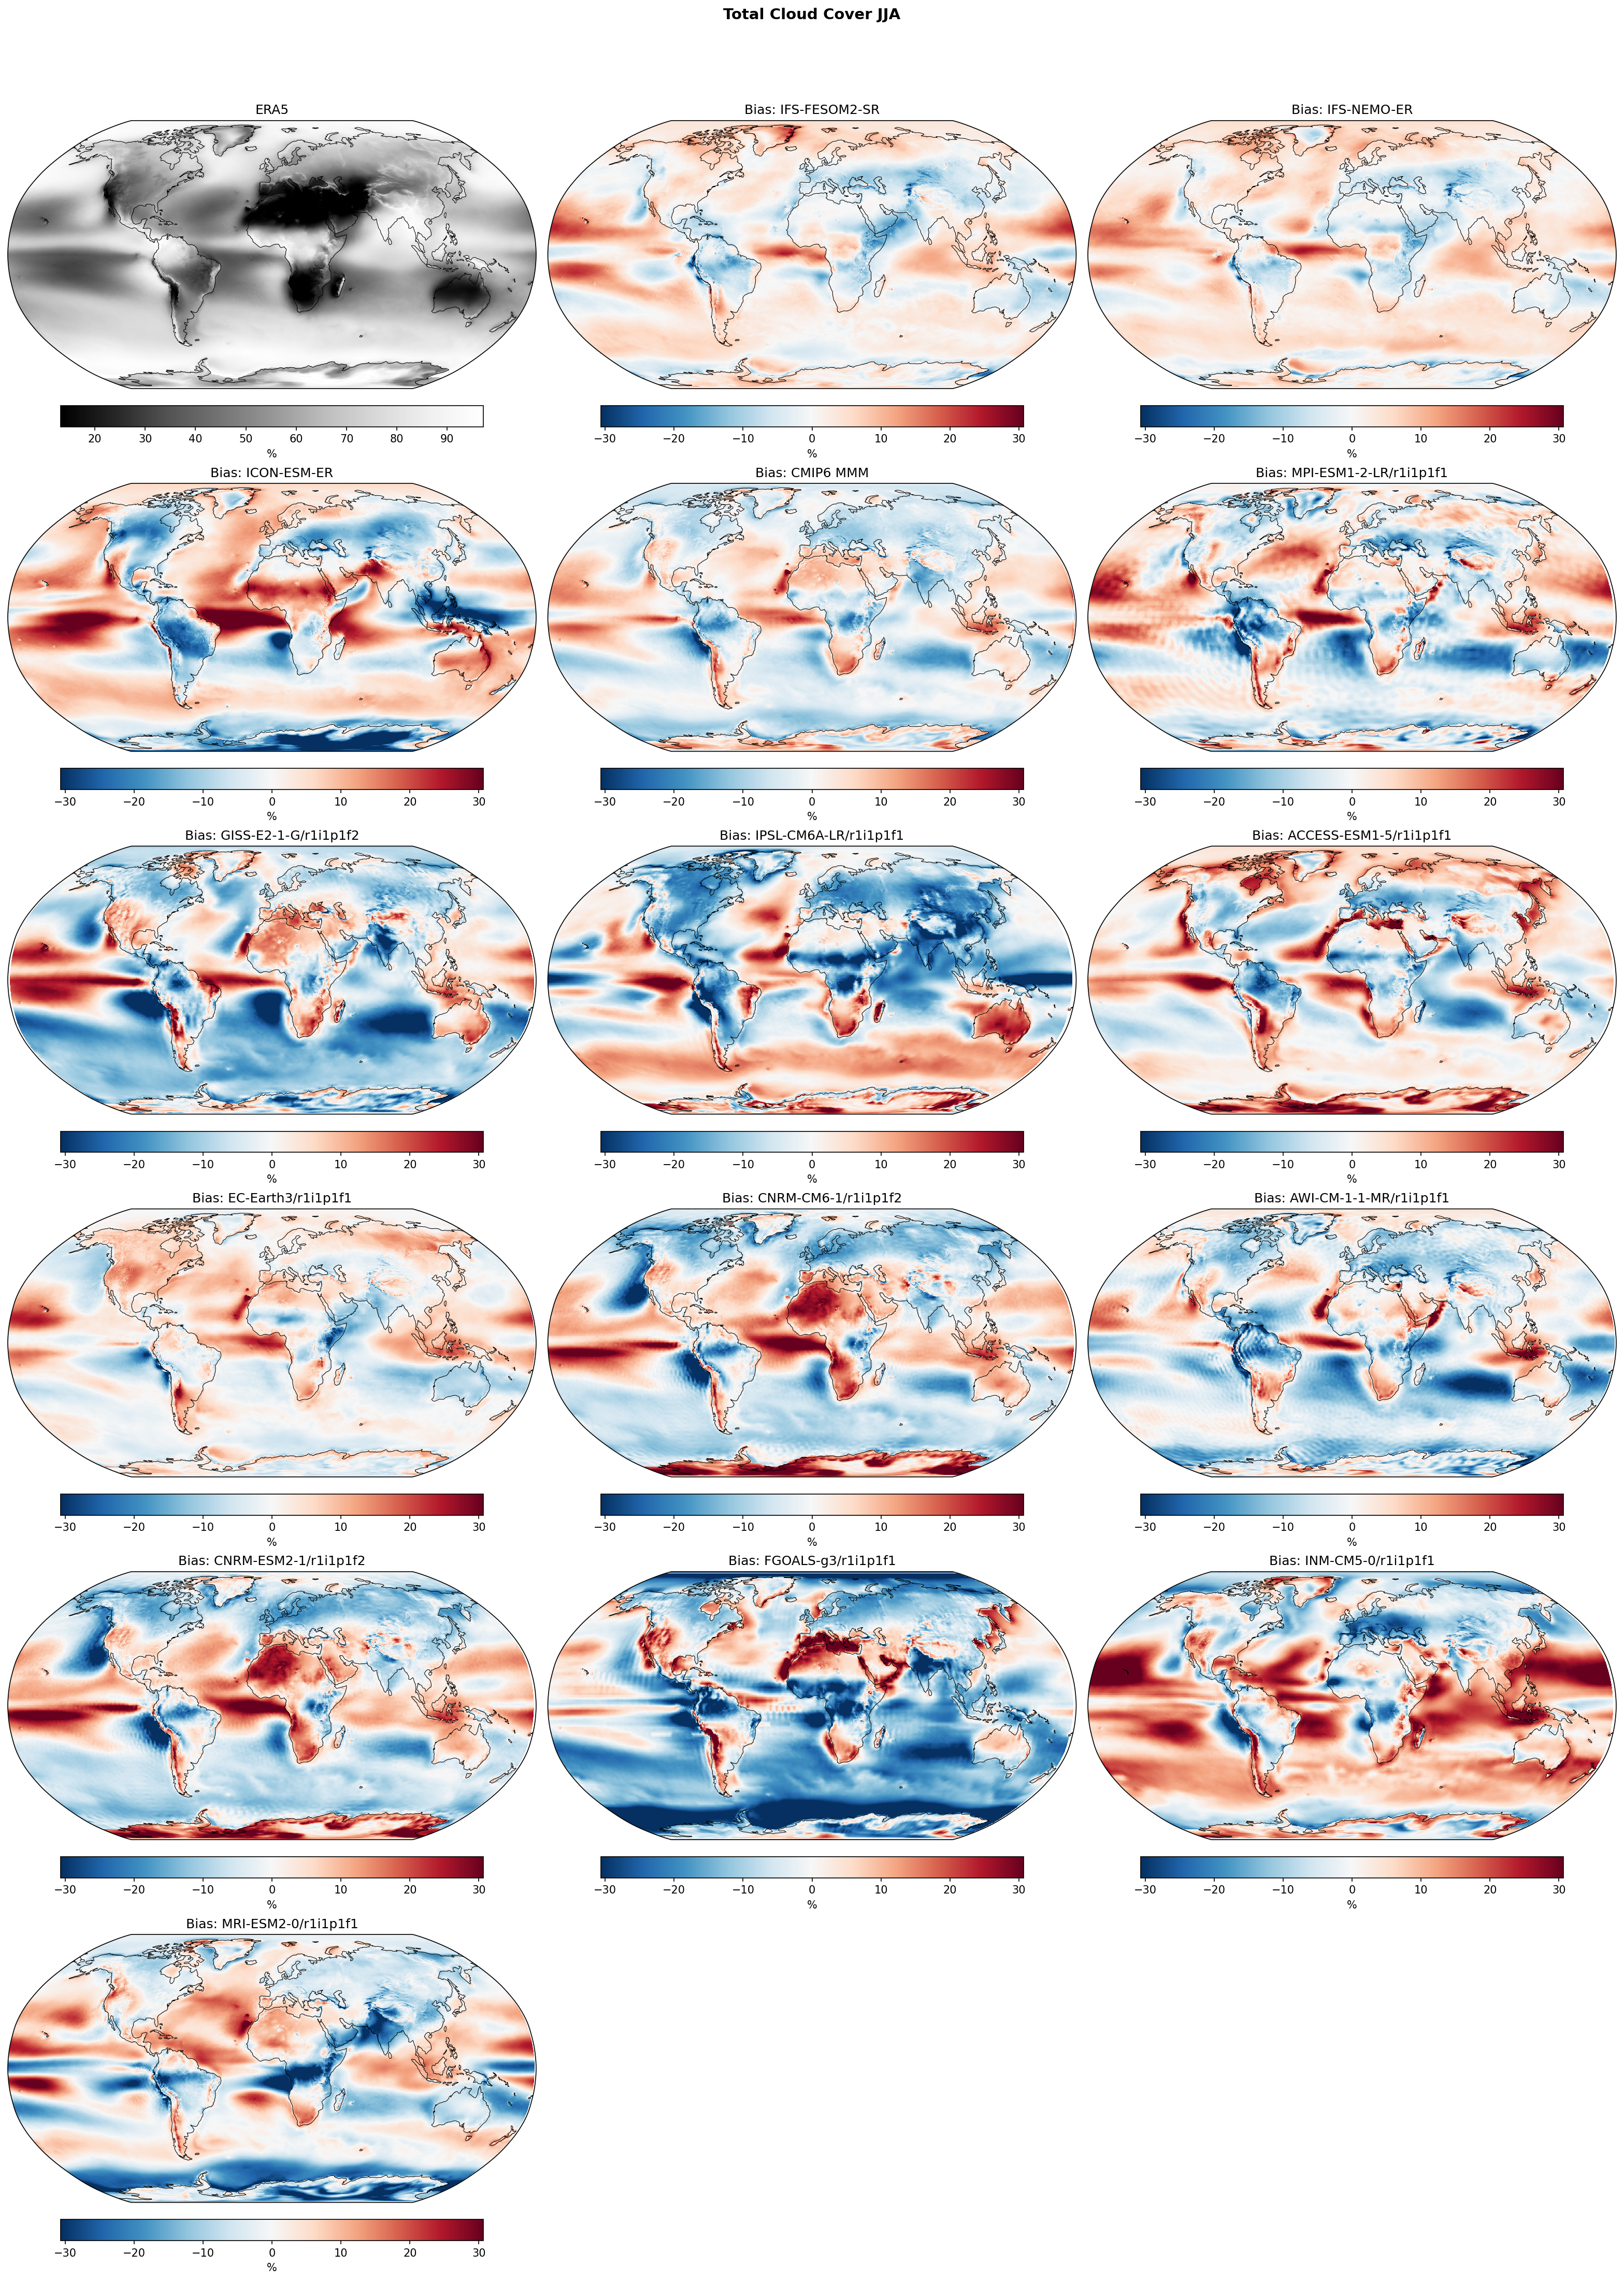
Total Cloud Cover JJA Bias
| Variables | clt |
|---|---|
| Models | IFS-FESOM2-SR, IFS-NEMO-ER, ICON-ESM-ER, HadGEM3-GC5, CMIP6 MMM, MPI-ESM1-2-LR/r1i1p1f1, GISS-E2-1-G/r1i1p1f2, IPSL-CM6A-LR/r1i1p1f1, ACCESS-ESM1-5/r1i1p1f1, EC-Earth3/r1i1p1f1, CNRM-CM6-1/r1i1p1f2, AWI-CM-1-1-MR/r1i1p1f1, CNRM-ESM2-1/r1i1p1f2, FGOALS-g3/r1i1p1f1, INM-CM5-0/r1i1p1f1, MRI-ESM2-0/r1i1p1f1 |
| Reference Dataset | ERA5 |
| Units | % |
| Period | 1980–2014 |
| CMIP6 MMM | Global Mean Bias: -1.08 · Rmse: None |
| MPI-ESM1-2-LR/r1i1p1f1 | Global Mean Bias: -0.17 · Rmse: None |
| GISS-E2-1-G/r1i1p1f2 | Global Mean Bias: -4.22 · Rmse: None |
| IPSL-CM6A-LR/r1i1p1f1 | Global Mean Bias: -2.76 · Rmse: None |
| ACCESS-ESM1-5/r1i1p1f1 | Global Mean Bias: 1.32 · Rmse: None |
| EC-Earth3/r1i1p1f1 | Global Mean Bias: 1.37 · Rmse: None |
| CNRM-CM6-1/r1i1p1f2 | Global Mean Bias: -0.03 · Rmse: None |
| AWI-CM-1-1-MR/r1i1p1f1 | Global Mean Bias: -3.26 · Rmse: None |
| CNRM-ESM2-1/r1i1p1f2 | Global Mean Bias: -0.07 · Rmse: None |
| FGOALS-g3/r1i1p1f1 | Global Mean Bias: -8.37 · Rmse: None |
| INM-CM5-0/r1i1p1f1 | Global Mean Bias: 5.68 · Rmse: None |
| MRI-ESM2-0/r1i1p1f1 | Global Mean Bias: -1.50 · Rmse: None |
Summary high
This figure evaluates JJA Total Cloud Cover biases relative to ERA5 for high-resolution EERIE models (IFS, ICON, HadGEM3) and CMIP6 models. While biases vary significantly in magnitude, a systematic pattern of underestimated cloud cover in subtropical subsidence regions and overestimated cover in high latitudes (particularly the Southern Ocean) is evident across the high-resolution ensemble.
Key Findings
- Persistent Stratocumulus Bias: Most models, including the high-resolution IFS and ICON variants, show distinct negative biases (10-30%) off the west coasts of South America and Africa, indicating that higher horizontal resolution alone does not solve the deficiency in representing eastern boundary stratocumulus decks.
- Southern Ocean Overestimation: In contrast to the historical 'too little cloud' bias in this region, EERIE models (ICON-ESM-ER, HadGEM3-GC5, and IFS variants) exhibit strong positive biases (>20%) over the Southern Ocean, suggesting a possible over-correction in cloud microphysics or lifetime tuning.
- HadGEM3-GC5 Oceanic Bias: HadGEM3-GC5 displays a widespread positive bias over nearly all ocean basins, contrasting with negative biases over Northern Hemisphere land masses.
- ICON-ESM-ER Zonal Contrast: ICON-ESM-ER shows the sharpest zonal contrasts, with intense positive biases in the ITCZ and Southern Ocean juxtaposed against strong negative biases in the subtropical gyres.
Spatial Patterns
The dominant spatial mode is a latitudinal variation: positive biases in the Arctic and Southern Ocean storm tracks, and negative biases in the subtropical trade wind and subsidence zones (30°S–30°N). The IFS models specifically show positive biases over tropical land (e.g., Amazon, Central Africa) but negative biases over adjacent tropical oceans. ICON-ESM-ER exhibits a bias pattern in the tropical Pacific suggestive of a 'double ITCZ' problem (bands of positive bias straddling the equator).
Model Agreement
IFS-FESOM2-SR and IFS-NEMO-ER show high agreement, confirming that the atmospheric model physics (IFS) dominates the cloud cover signal over the ocean model choice. EC-Earth3 (CMIP6) shares spatial features with the IFS runs, reflecting their shared atmospheric heritage. There is broad inter-model disagreement on the sign of the global mean bias (e.g., INM-CM5 is strongly positive, FGOALS-g3 is strongly negative), but the spatial placement of the stratocumulus deficit is highly robust across the ensemble.
Physical Interpretation
The negative subtropical biases likely result from inadequate parameterization of boundary layer turbulence and inversion strength, leading to insufficient maintenance of stratocumulus clouds even at ~10 km resolution. The positive Southern Ocean biases may stem from tuning choices intended to increase cloud liquid water or lifetime to combat historical warm SST biases in coupled simulations. The excess cloudiness over tropical land in IFS suggests overactive deep convection or slow cloud dissipation in the model's physics package.
Caveats
- Total cloud cover collapses vertical structure; models could have correct total cover but wrong vertical distribution (e.g., compensating errors between low and high clouds).
- ERA5 is a reanalysis product and relies on its own cloud parameterization, meaning differences in data-sparse regions (like the Southern Ocean) may partly reflect ERA5 biases.
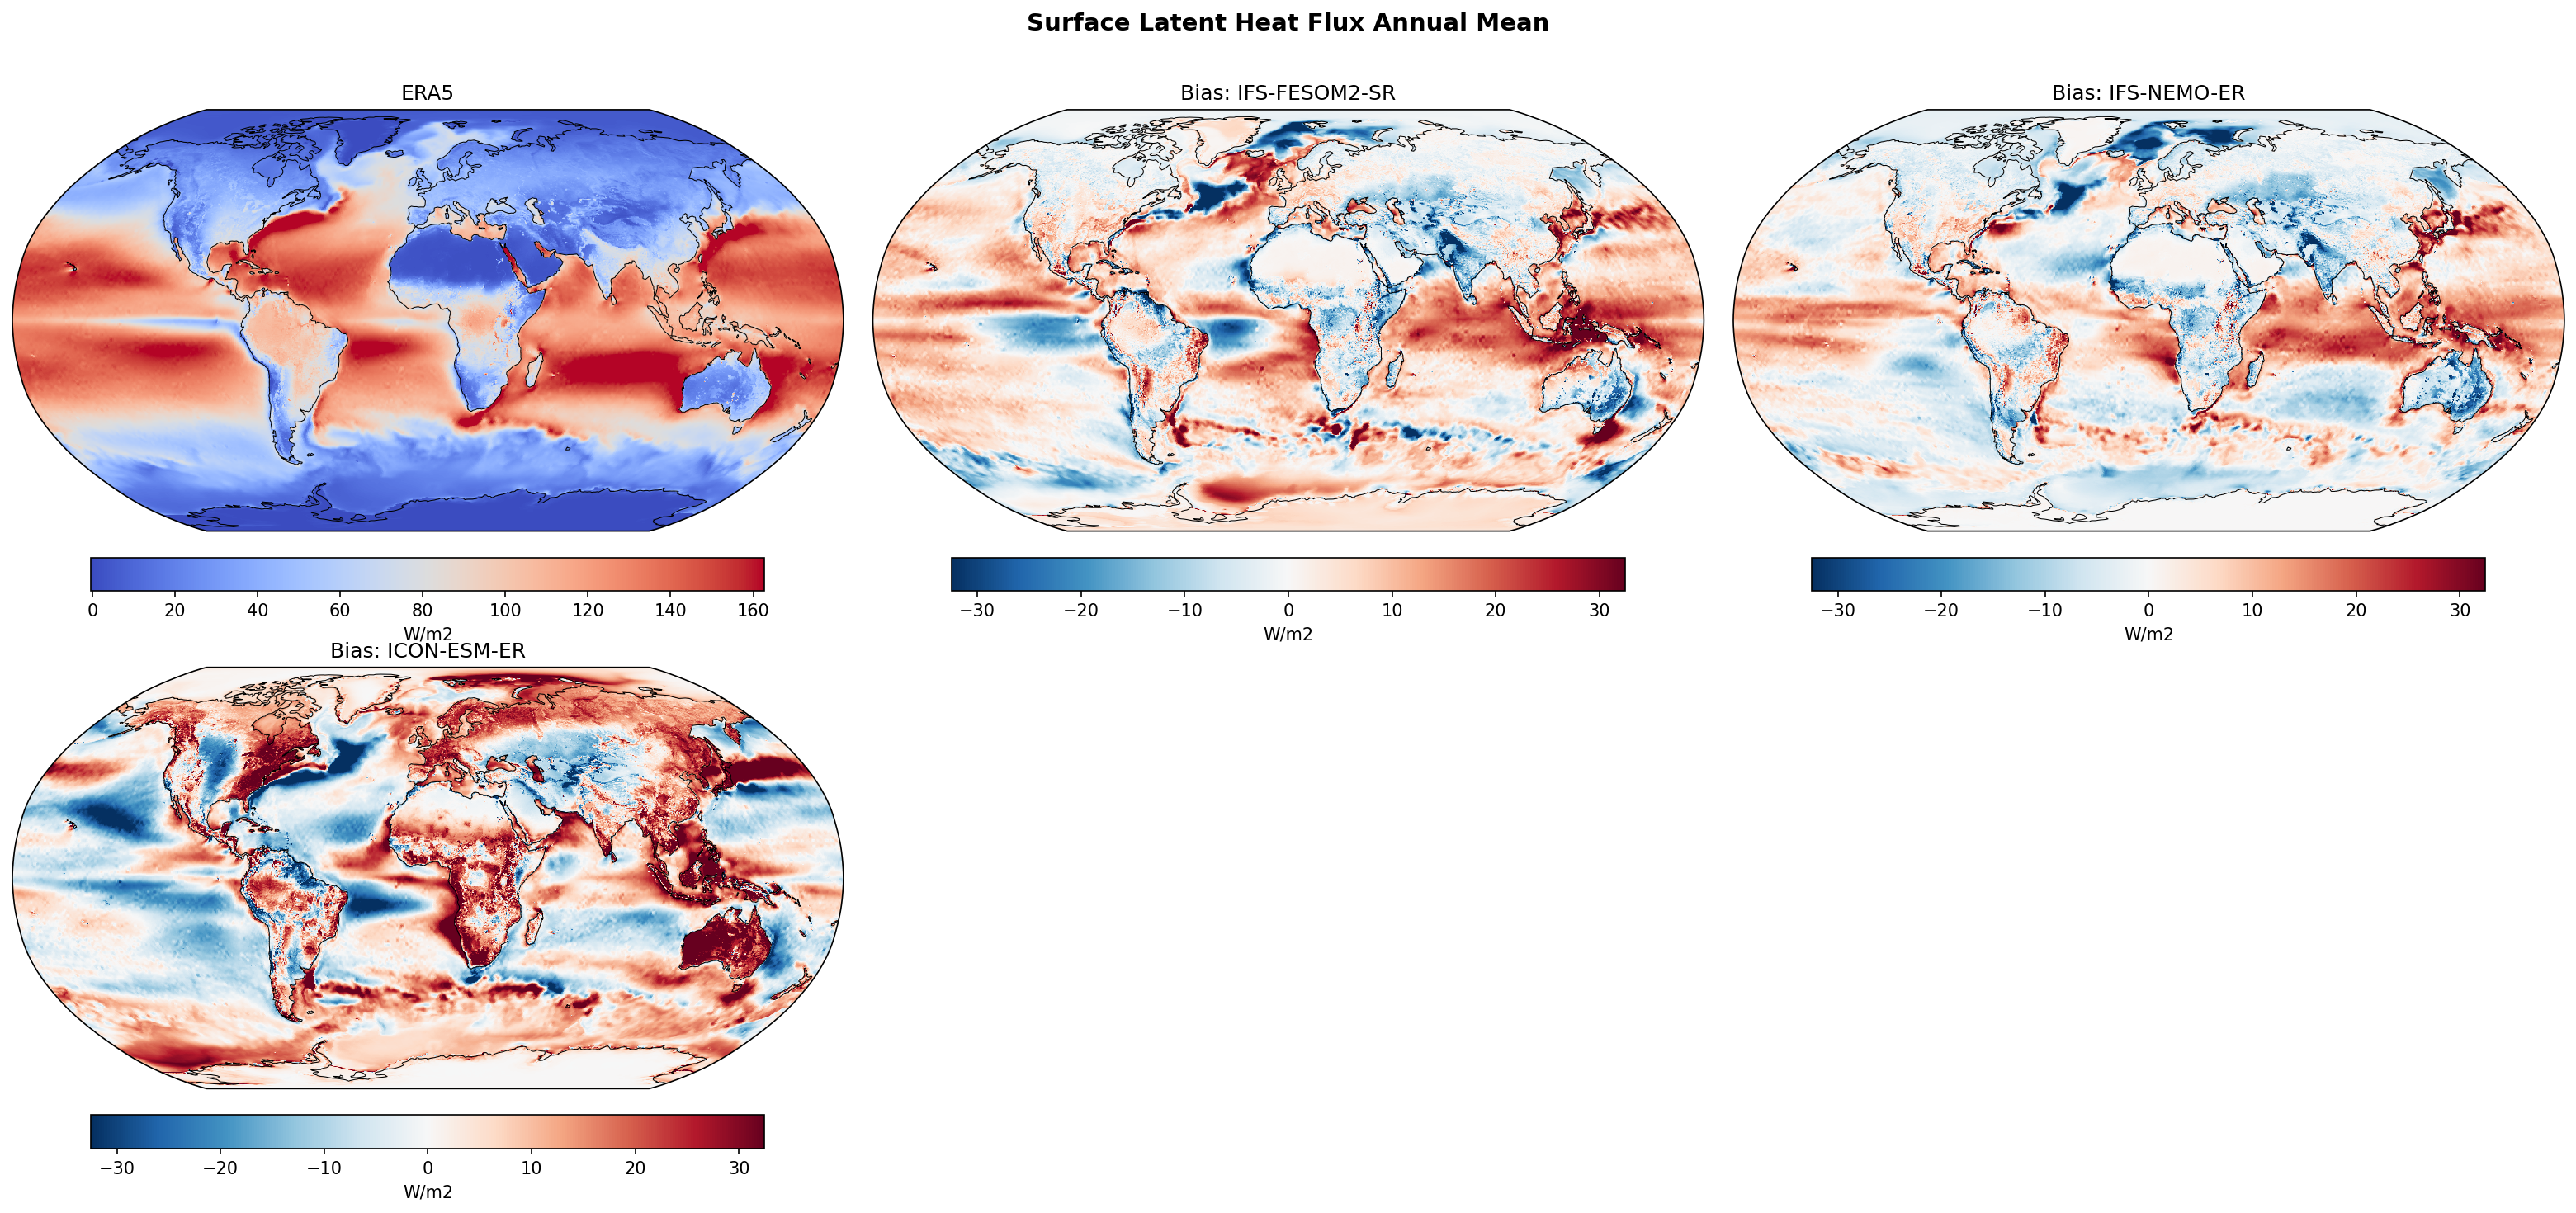
Surface Latent Heat Flux Annual Mean Bias
| Variables | hfls |
|---|---|
| Models | IFS-FESOM2-SR, IFS-NEMO-ER, ICON-ESM-ER |
| Reference Dataset | ERA5 |
| Units | W/m2 |
| Period | 1980–2014 |
| IFS-FESOM2-SR | Global Mean Bias: 3.13 · Rmse: 11.77 |
| IFS-NEMO-ER | Global Mean Bias: 1.20 · Rmse: 10.00 |
| ICON-ESM-ER | Global Mean Bias: 3.90 · Rmse: 16.09 |
Summary high
This figure evaluates annual mean surface latent heat flux biases in three high-resolution coupled models against ERA5 reanalysis for the period 1980–2014. While IFS-NEMO-ER shows the best agreement with observations, all models exhibit significant regional biases, particularly in the North Atlantic.
Key Findings
- IFS-NEMO-ER outperforms the other models with the lowest global mean bias (+1.20 W/m²) and RMSE (10.0 W/m²).
- ICON-ESM-ER exhibits a widespread positive bias (global mean +3.90 W/m²) and the highest RMSE (16.09 W/m²), indicating excessive evaporation over most ocean basins and land surfaces.
- A prominent negative bias feature (blue) is present in the North Atlantic subpolar gyre across all models, likely associated with the common 'North Atlantic warming hole' or cold SST bias.
- Western Boundary Currents (Gulf Stream, Kuroshio) display strong dipole bias patterns in the eddy-rich models, indicative of spatial shifts in current paths rather than just magnitude errors.
Spatial Patterns
The North Atlantic is dominated by a negative bias south of Greenland/Iceland (weak evaporation) and positive biases along the Gulf Stream path (strong evaporation), creating a dipole. The subtropics in ICON-ESM-ER are systematically biased high (red). Over land, ICON shows much stronger positive latent heat flux biases (e.g., Amazon, Central Africa, Australia) compared to the IFS models, which are more neutral.
Model Agreement
The two IFS-based models (NEMO and FESOM2) show closer agreement with each other and observations than ICON-ESM-ER. IFS-NEMO-ER generally has smaller bias magnitudes than IFS-FESOM2-SR, suggesting benefits from the eddy-rich ocean resolution or tuning. ICON diverges significantly in bias magnitude.
Physical Interpretation
Latent heat flux is primarily driven by wind speed and the sea-air humidity difference (which depends on SST). The negative North Atlantic bias likely reflects cold SST biases common in coupled models (weak AMOC/NAC extension), reducing the saturation vapor pressure at the surface. The dipole biases in boundary currents suggest the models resolve sharp gradients that are slightly displaced spatially compared to ERA5. ICON's systematic positive bias suggests a fundamental difference in surface exchange parameterizations or a globally warmer surface state.
Caveats
- ERA5 is a reanalysis product and relies on its own bulk formulae for fluxes; it is not a direct instrument observation.
- High-resolution models (ER) resolve sharper gradients than the native resolution of ERA5 (~31km), which can artificially amplify error statistics near narrow currents like the Gulf Stream.
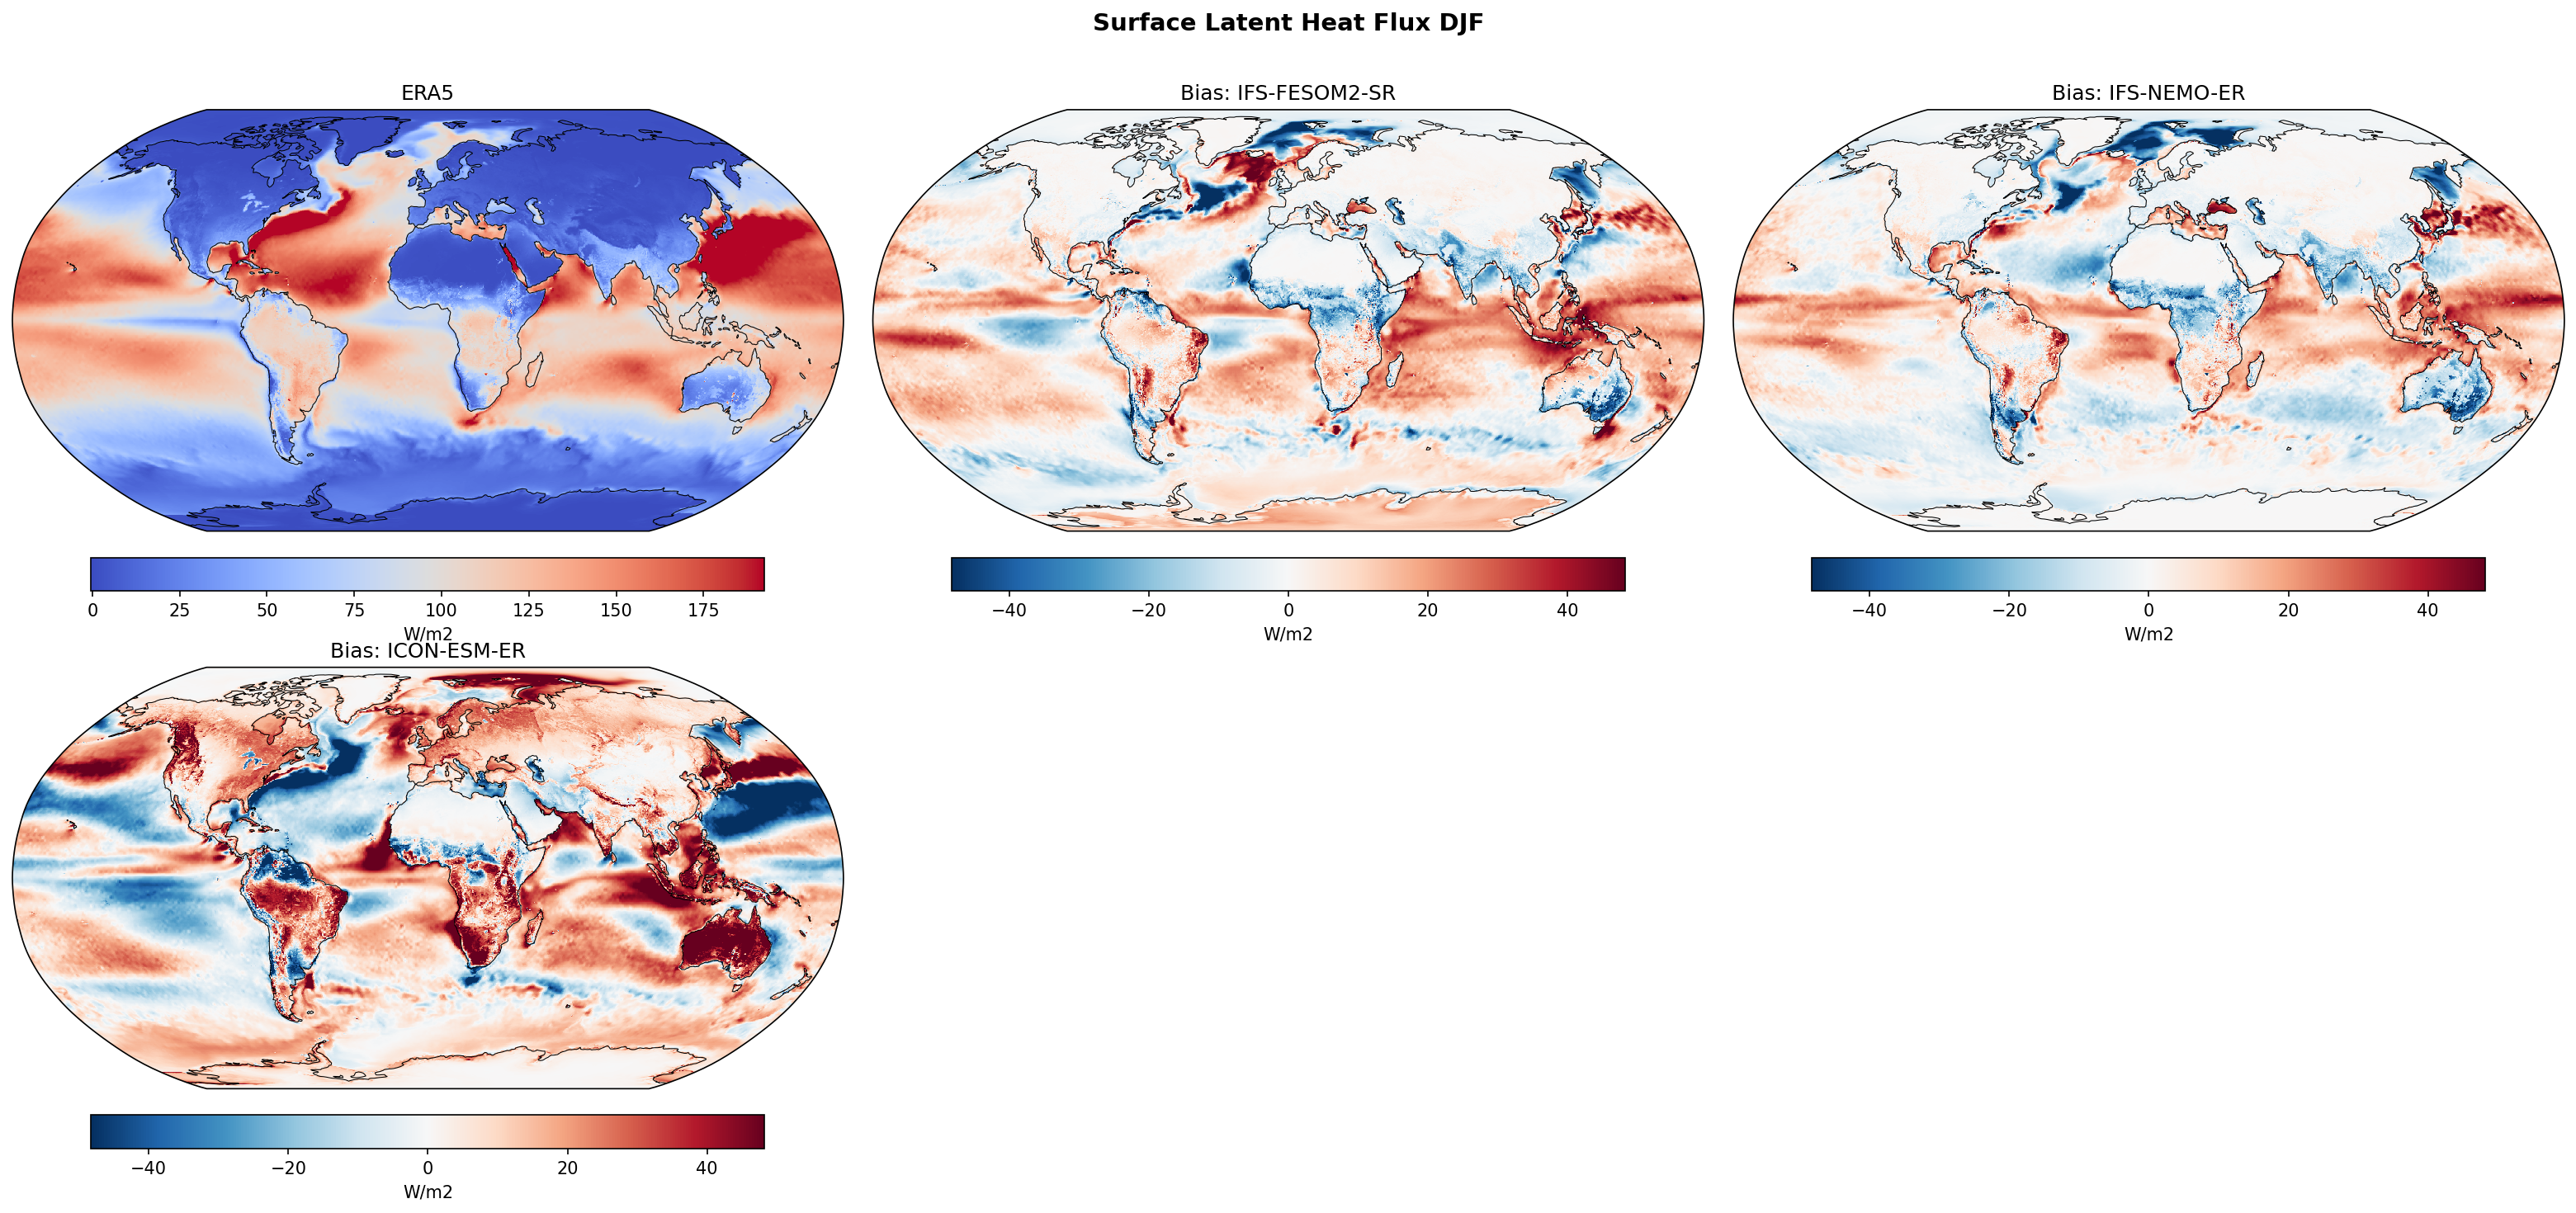
Surface Latent Heat Flux DJF Bias
| Variables | hfls |
|---|---|
| Models | IFS-FESOM2-SR, IFS-NEMO-ER, ICON-ESM-ER |
| Reference Dataset | ERA5 |
| Units | W/m2 |
| Period | 1980–2014 |
Summary high
This figure displays DJF Surface Latent Heat Flux biases for three coupled models against ERA5, revealing distinct behaviors where IFS-based models share moderate regional biases while ICON-ESM-ER exhibits strong, widespread positive biases in the tropics.
Key Findings
- ICON-ESM-ER shows significantly larger biases than the IFS models, characterised by widespread excessive latent heat flux (positive bias >40 W/m²) over the tropical oceans and strong negative biases in the North Atlantic and North Pacific mid-latitudes.
- Both IFS models (FESOM2-SR and NEMO-ER) display structurally similar patterns: positive biases in the Indo-Pacific Warm Pool and Western Boundary Currents (especially the Gulf Stream), and negative biases in the eastern tropical Pacific and Atlantic.
- All three models overestimate surface latent heat flux over Southern Hemisphere land masses during summer (DJF), particularly over Australia, Southern Africa, and parts of South America.
- The IFS-FESOM2-SR simulation shows a particularly broad region of positive bias extending northeastward from the Gulf Stream, indicative of Western Boundary Current separation or extension issues common in lower-resolution ocean components.
Spatial Patterns
The Western Boundary Currents (Gulf Stream, Kuroshio) appear as hotspots for positive bias (excess evaporation), likely linked to warm SST biases or current misplacement. A clear zonal asymmetry exists in the tropics for IFS models (positive West / negative East), whereas ICON is predominantly positive throughout the tropics. Southern Hemisphere continents show coherent positive biases consistent with the summer season.
Model Agreement
The two IFS variations (NEMO vs FESOM) show high agreement in bias spatial structure, suggesting atmospheric control or shared tuning dictates the broad patterns, though local details in the Gulf Stream differ. ICON-ESM-ER disagrees substantially with the IFS group, showing much higher global mean evaporation (implied by the dominance of red areas).
Physical Interpretation
Positive latent heat flux biases over oceans generally imply either warm SST biases, excessive surface wind speeds, or a too-dry boundary layer. The strong positive biases in the Gulf Stream (IFS-FESOM) suggest the warm current stays attached or extends too far north, maintaining high evaporation rates. The widespread positive bias in ICON's tropical oceans suggests a systematic issue with the bulk aerodynamic flux parameterization or energetic tuning. Over land, the positive summer biases suggest excessive evapotranspiration, possibly due to soil moisture initialization or vegetation parameterizations.
Caveats
- Sign convention assumed: Positive flux = Upward (Ocean to Atmosphere), consistent with evaporation.
- Biases in Western Boundary Currents are highly sensitive to the precise location of sharp SST fronts, which are difficult to map perfectly even in reanalysis.
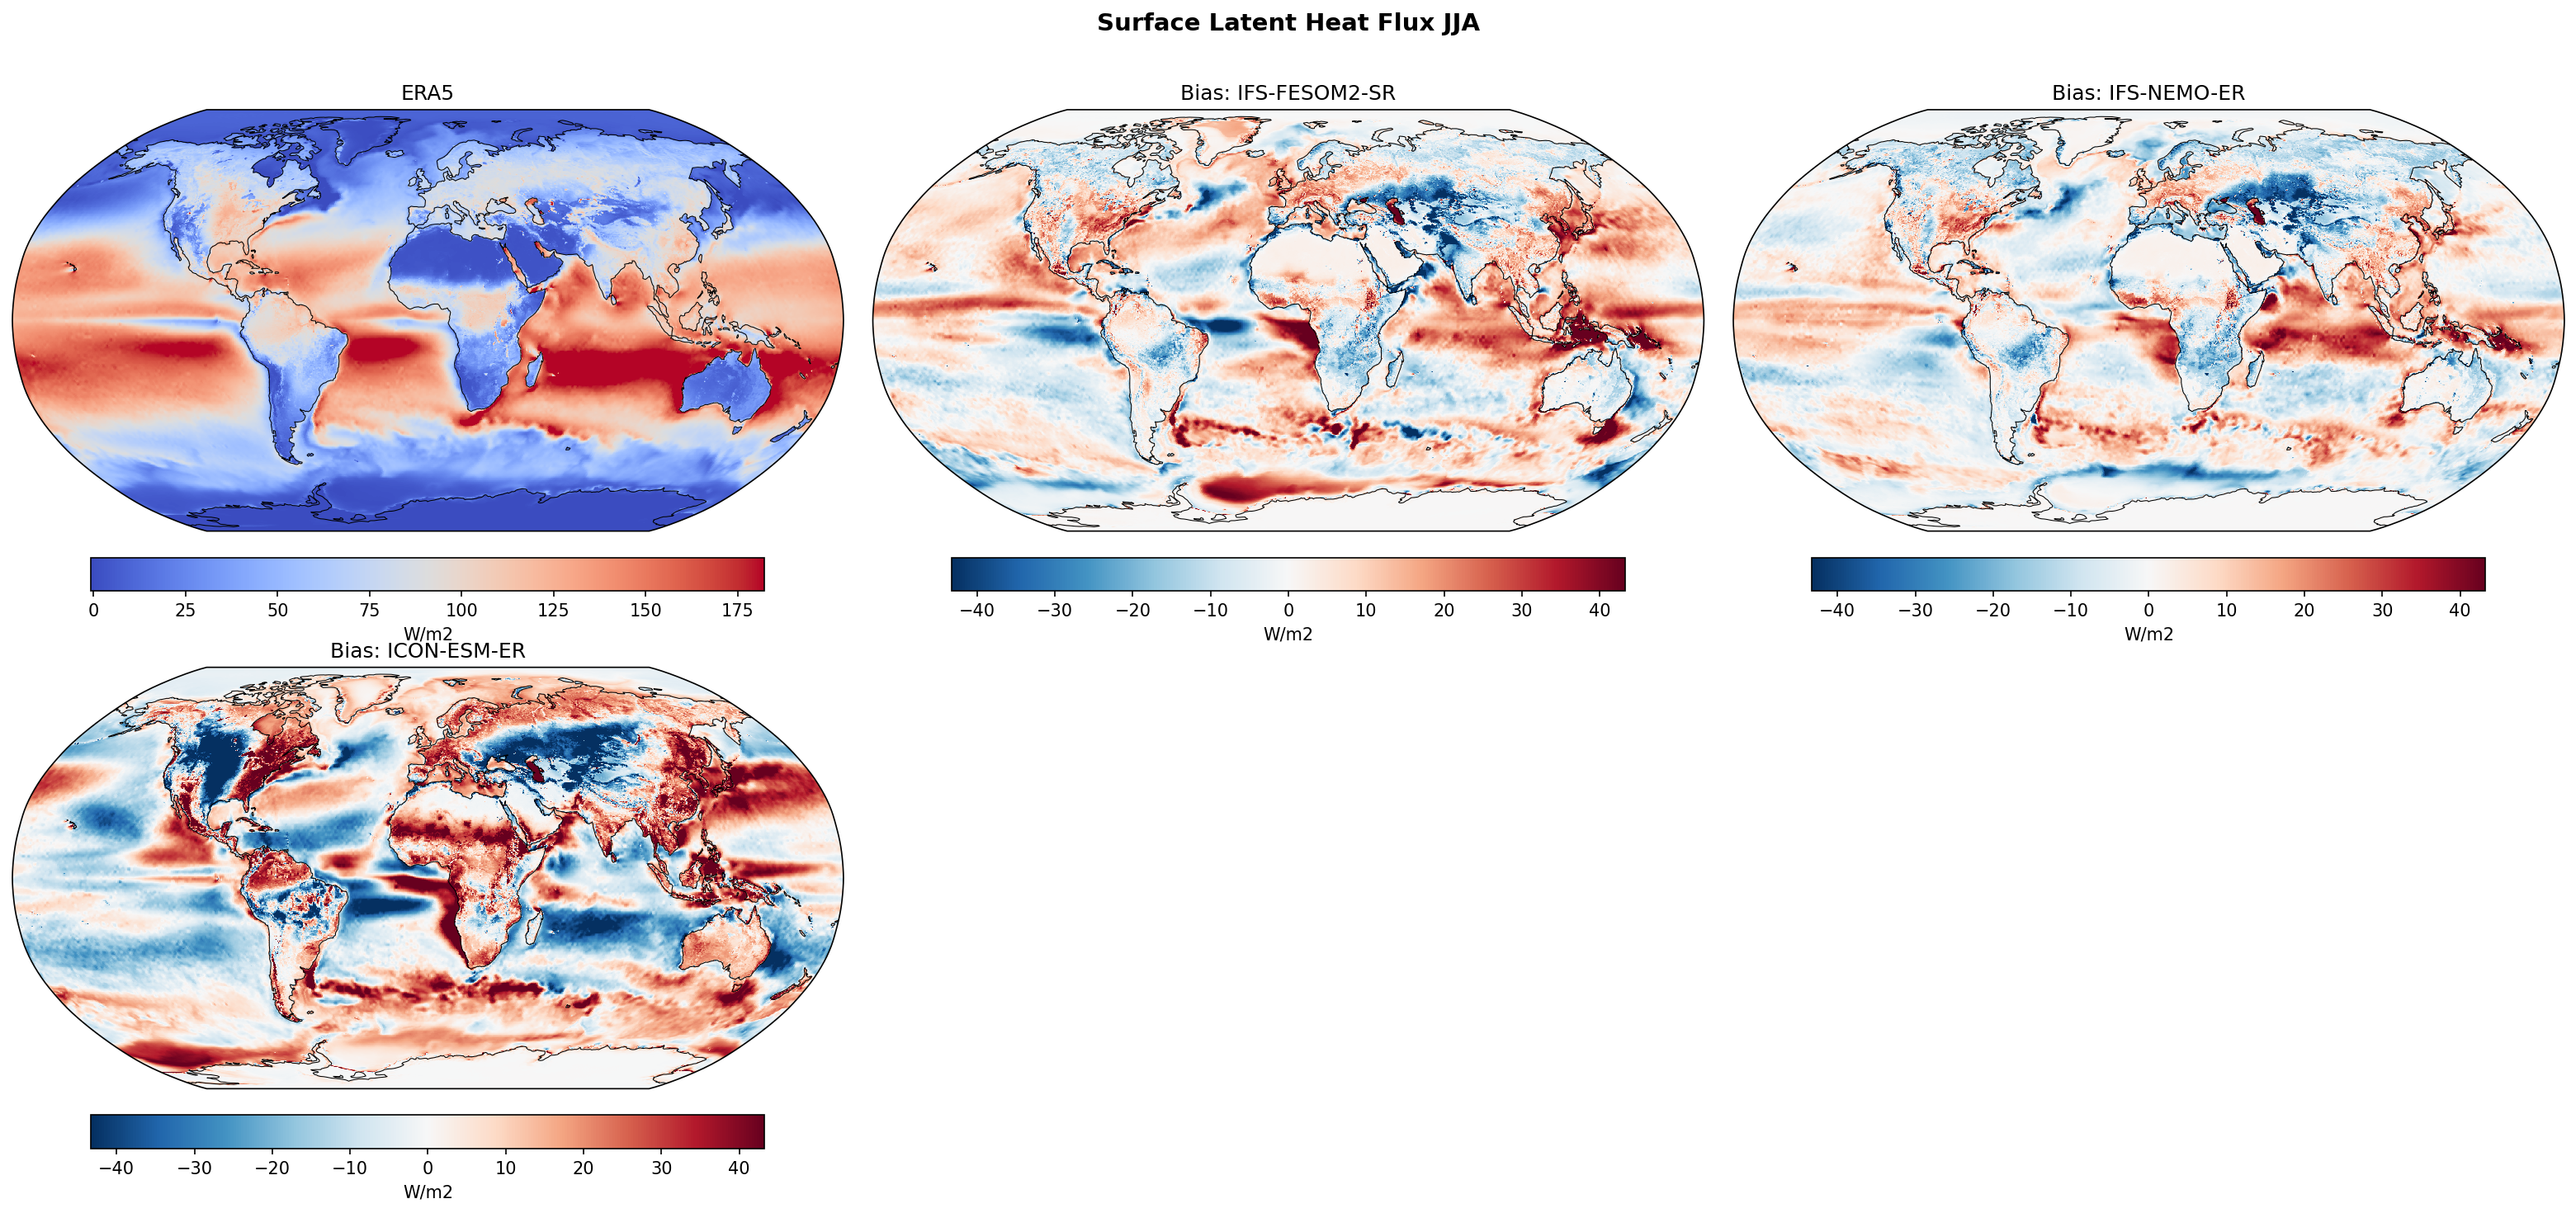
Surface Latent Heat Flux JJA Bias
| Variables | hfls |
|---|---|
| Models | IFS-FESOM2-SR, IFS-NEMO-ER, ICON-ESM-ER |
| Reference Dataset | ERA5 |
| Units | W/m2 |
| Period | 1980–2014 |
Summary high
This figure evaluates the JJA climatological Surface Latent Heat Flux (LHF) biases relative to ERA5 for IFS-FESOM2-SR, IFS-NEMO-ER, and ICON-ESM-ER. The IFS-based models show similar, moderate biases driven by regional circulation features, while ICON-ESM-ER exhibits widespread, large-amplitude biases over both land and ocean.
Key Findings
- IFS-FESOM2-SR and IFS-NEMO-ER display highly correlated spatial bias patterns, confirming that atmospheric physics (IFS) dominates the surface flux signal over the choice of ocean model (FESOM vs NEMO).
- Both IFS models exhibit a distinct positive LHF bias in the Arabian Sea and Bay of Bengal (>30 W/m²), likely linked to an overly intense Southwest Monsoon flow.
- ICON-ESM-ER shows significantly larger biases than the IFS models, with widespread positive biases (excessive evaporation) over Northern Hemisphere land (Siberia, Canada) and subtropical oceans.
- ICON displays a strong negative LHF bias over tropical land masses (Amazon, Central Africa) and the tropical Atlantic, contrasting with its positive bias in the extratropics.
- Negative biases in the tropical Pacific (ITCZ/SPCZ region) are present in all models but are most pronounced and zonally extensive in ICON.
Spatial Patterns
The IFS models show localized positive anomalies in the Indian Ocean and negative anomalies in the Tropical Pacific and North Atlantic subpolar gyre. ICON shows a hemispheric dichotomy in land biases: strong positive evaporation over NH high-latitudes and strong negative evaporation over tropical rainforests. Over oceans, ICON has widespread positive biases in the subtropics and mid-latitudes, particularly strong in the North Atlantic and Southern Ocean.
Model Agreement
High agreement between IFS-FESOM2-SR and IFS-NEMO-ER highlights the dominant role of the atmospheric component. Low agreement between IFS and ICON, particularly regarding the magnitude of fluxes and the sign of biases over NH land and subtropical oceans.
Physical Interpretation
The positive Arabian Sea bias in IFS suggests overly strong surface winds in the Somali Jet. ICON's widespread positive bias over NH land in summer implies excessive evapotranspiration, possibly due to soil moisture parameterization or warm surface temperature biases. Conversely, ICON's negative bias over the Amazon (dry season in JJA) and Congo suggests soil moisture depletion or limited transpiration. The strong ocean evaporation in ICON suggests either warm SST biases or aggressive bulk aerodynamic transfer coefficients.
Caveats
- ERA5 surface fluxes are a model-derived reanalysis product, not direct observations, and carry their own uncertainties, especially in data-sparse regions.
- LHF biases can result from errors in wind speed, surface humidity gradients, or SST; distinguishing these requires additional diagnostics (e.g., SST bias maps).
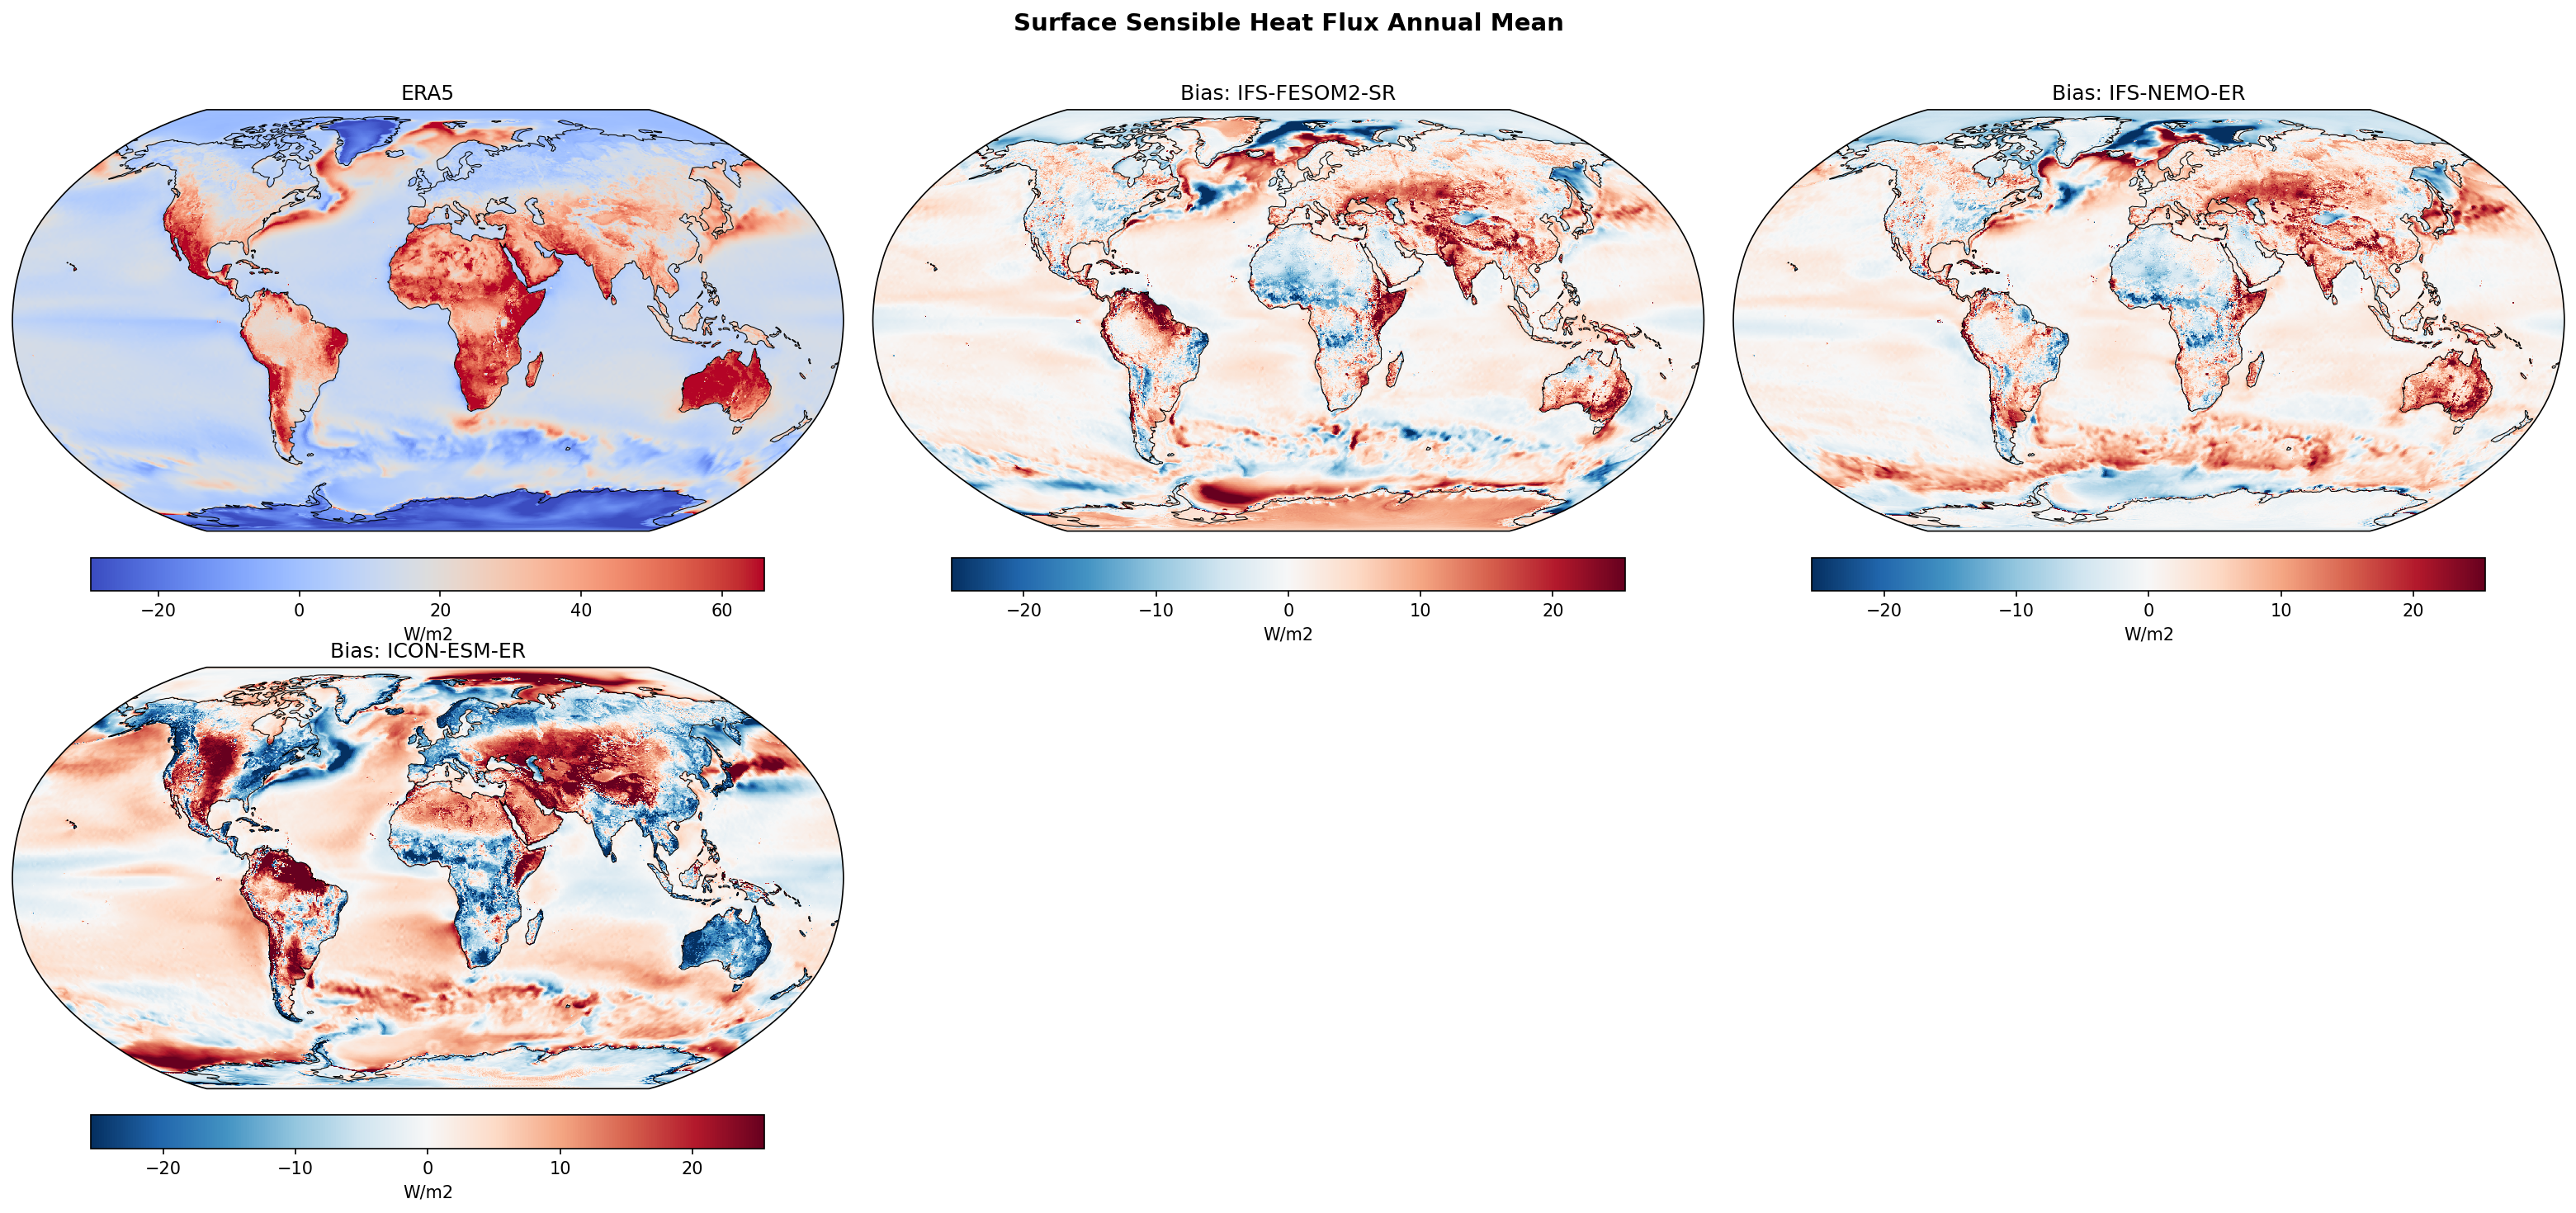
Surface Sensible Heat Flux Annual Mean Bias
| Variables | hfss |
|---|---|
| Models | IFS-FESOM2-SR, IFS-NEMO-ER, ICON-ESM-ER |
| Reference Dataset | ERA5 |
| Units | W/m2 |
| Period | 1980–2014 |
| IFS-FESOM2-SR | Global Mean Bias: 1.74 · Rmse: 6.96 |
| IFS-NEMO-ER | Global Mean Bias: 1.81 · Rmse: 6.60 |
| ICON-ESM-ER | Global Mean Bias: 1.85 · Rmse: 10.43 |
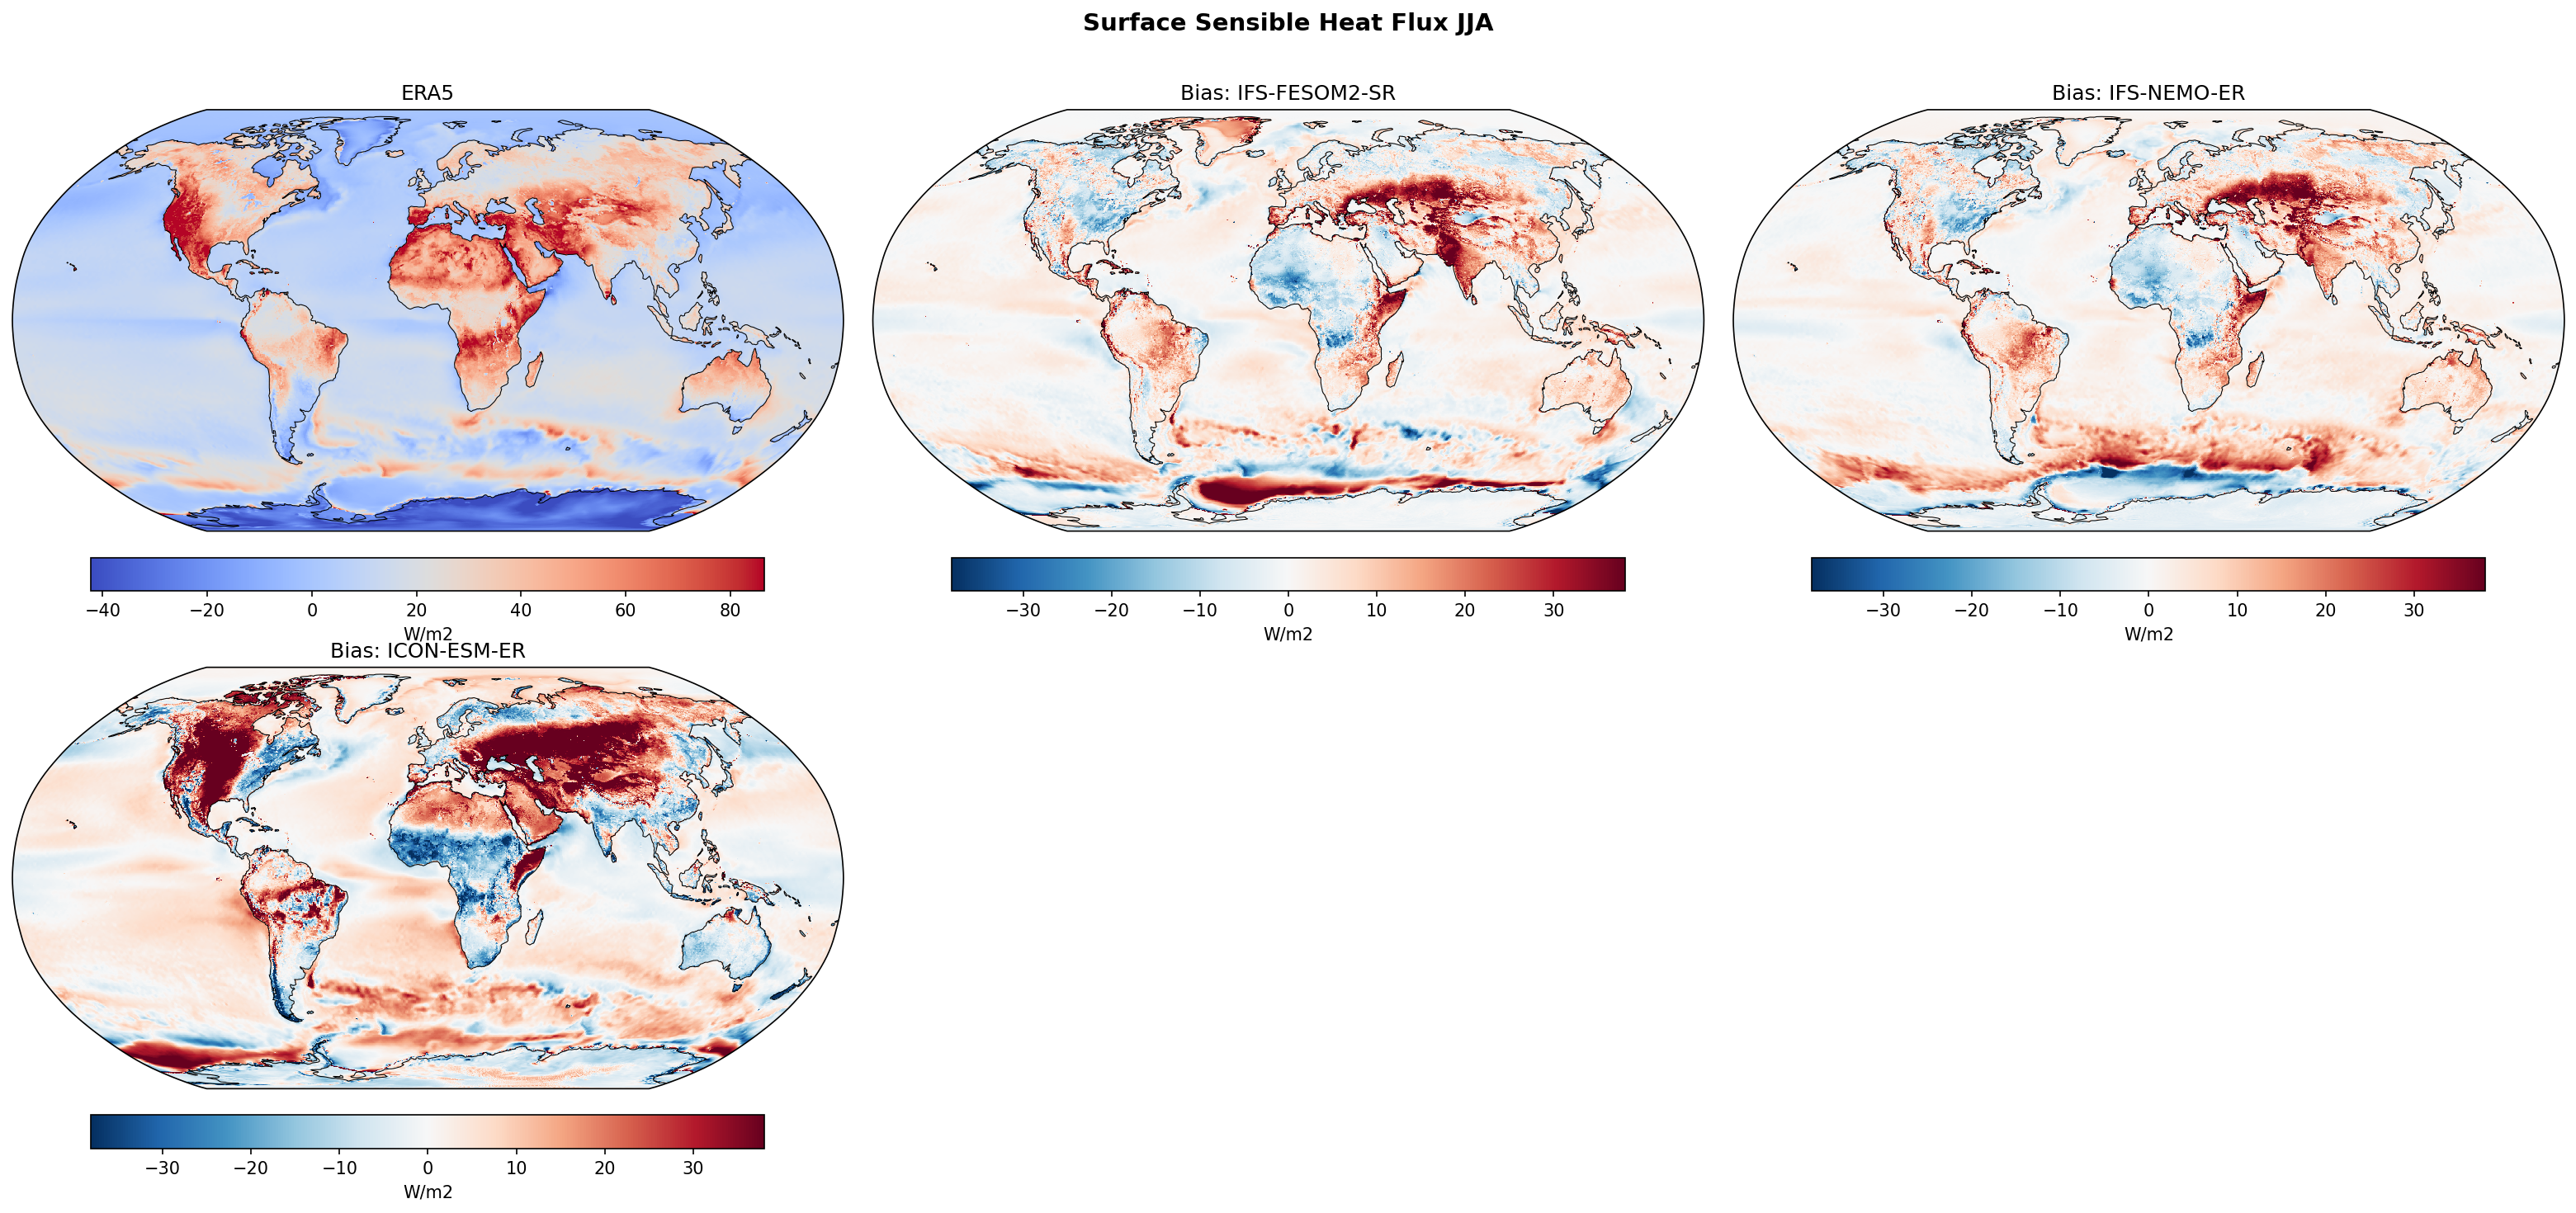
Summary high
The diagnostic figure evaluates annual mean surface sensible heat flux (SHF) biases relative to ERA5. While all models share a small global mean positive bias (~1.7–1.8 W/m²), ICON-ESM-ER exhibits significantly larger spatial errors (RMSE ~10.4 W/m²) with distinct land energy partitioning issues compared to the IFS-based models (RMSE ~6.6–7.0 W/m²).
Key Findings
- IFS-FESOM2-SR and IFS-NEMO-ER display very similar bias patterns, characterized by positive biases over tropical rainforests (Amazon, Congo) and major orography (Himalayas, Andes).
- ICON-ESM-ER shows opposing and more intense land biases: strong negative biases over boreal forests and tropical rainforests contrast with intense positive biases over arid regions (Sahara, Australia, Western US).
- Oceanic biases are prominent in the North Atlantic; ICON features a strong negative SHF bias in the subpolar gyre/Labrador Sea region, while IFS models show a dipole pattern indicative of Gulf Stream path displacements.
- All models exhibit positive biases along the Antarctic coast, suggesting potential underestimation of sea ice cover or warmer SSTs allowing excess heat release to the atmosphere.
Spatial Patterns
The IFS models generally overestimate SHF over vegetated tropical land and mountain ranges. In contrast, ICON displays a stark dichotomy: 'blue' (negative bias) over moisture-rich forests (Amazon, Boreal) and 'red' (positive bias) over deserts. In the oceans, the Gulf Stream extension is a major source of error, with IFS models showing a spatially shifted current (dipole bias) and ICON showing a broad reduction in heat release in the subpolar North Atlantic. Southern Ocean biases are predominantly positive near the ice edge.
Model Agreement
The two IFS-based models (FESOM2 and NEMO) agree closely in pattern and magnitude, confirming the atmospheric model's dominance in driving surface flux characteristics. ICON-ESM-ER diverges significantly, particularly over land, indicating fundamental differences in its land surface model's energy partitioning (Bowen ratio).
Physical Interpretation
Land biases likely stem from differences in Land Surface Model parameterisations governing the Bowen ratio (ratio of sensible to latent heat). ICON's negative SHF bias over forests suggests it may be partitioning too much energy into latent heat (evaporation) or maintaining a cold surface bias, while its positive bias over deserts implies excessive surface heating. Ocean biases are primarily driven by SST errors and air-sea temperature gradients; the North Atlantic biases reflect difficulties in resolving the Gulf Stream separation and North Atlantic Current path, common in coupled models.
Caveats
- ERA5 is a reanalysis product; while robust, it relies on its own bulk formulas and parameterisations which may differ from the models.
- Biases in sensible heat flux are often compensatory to latent heat flux errors to satisfy the surface energy budget.
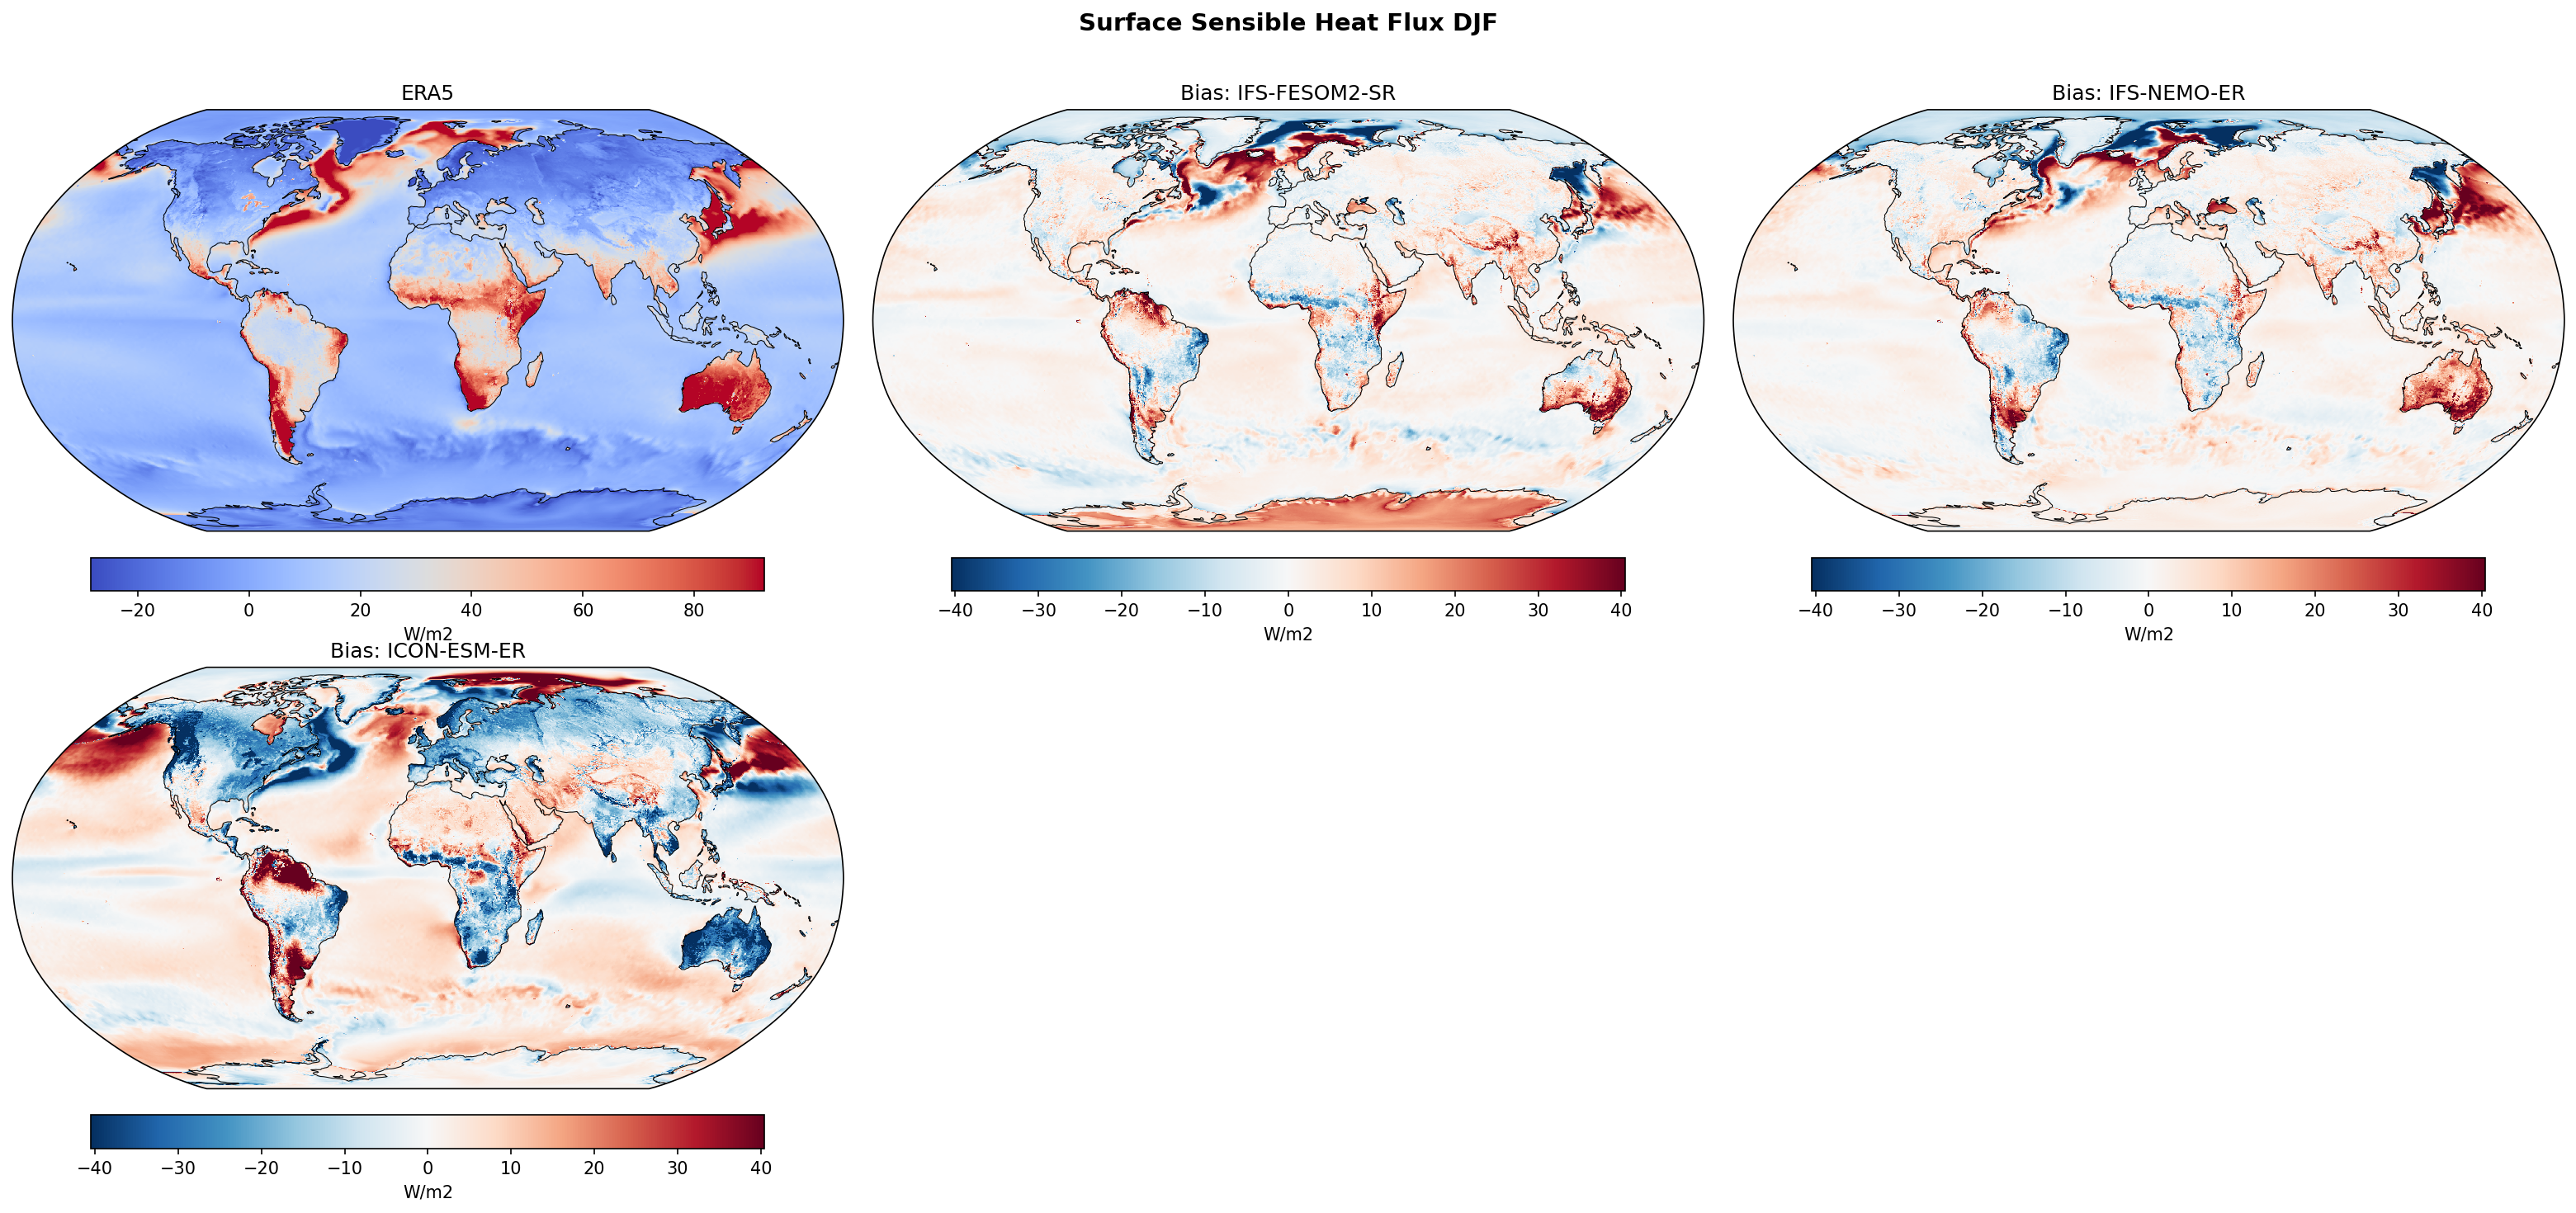
Surface Sensible Heat Flux DJF Bias
| Variables | hfss |
|---|---|
| Models | IFS-FESOM2-SR, IFS-NEMO-ER, ICON-ESM-ER |
| Reference Dataset | ERA5 |
| Units | W/m2 |
| Period | 1980–2014 |
Summary high
This diagnostic shows DJF Surface Sensible Heat Flux (SHF) biases relative to ERA5, revealing that the two IFS-based models share atmospheric-driven biases over land and western boundary currents but diverge in the Southern Ocean, while ICON-ESM-ER exhibits structurally distinct and often opposite biases.
Key Findings
- IFS-FESOM and IFS-NEMO share a distinct dipole bias pattern in North Hemisphere Western Boundary Currents (negative near-coast, positive offshore) and strong positive biases over Southern Hemisphere summer land (Amazon, Australia).
- IFS-FESOM displays a unique, strong positive bias (>30 W/m²) around the Antarctic continental margin, which is absent in IFS-NEMO, suggesting specific issues with sea-ice extent or open-water heat loss in the FESOM ocean component.
- ICON-ESM-ER generally underestimates sensible heat flux (negative bias) over NH mid-latitude oceans and SH summer land masses, showing the opposite sign to IFS models in regions like the Amazon and Australia.
Spatial Patterns
In the North Atlantic, IFS models show a dipole (blue coastal/red open ocean) indicative of Gulf Stream separation issues, whereas ICON shows a broad negative bias across the subpolar gyre and a positive bias in the Nordic Seas. Over SH land (Australia, S. America), IFS biases are positive (too much heat to atmosphere), while ICON biases are negative. In the Southern Ocean, IFS-FESOM has a 'red rim' of positive bias, contrasting with the neutral/slight negative bias in IFS-NEMO and ICON.
Model Agreement
High agreement between IFS-FESOM and IFS-NEMO over land and NH oceans due to shared atmospheric physics. Low agreement between IFS and ICON, which often show biases of opposite sign. Inter-model divergence is highest in the Southern Ocean and the subpolar North Atlantic.
Physical Interpretation
The positive bias in IFS-FESOM around Antarctica likely results from reduced sea-ice cover or warm SSTs allowing excessive ocean-to-atmosphere heat loss in the marginal ice zone. The shared IFS land biases suggest a land-surface scheme that favors high sensible heat flux (possibly limited evapotranspiration) compared to ICON. The negative bias in ICON over the N. Atlantic and N. Pacific implies reduced surface forcing of the atmosphere, which could impact storm track intensity. The WBC dipoles in IFS reflect spatial shifts in the currents (e.g., overshoot) relative to ERA5.
Caveats
- ERA5 sensible heat flux is a reanalysis product derived from bulk formulae, not a direct observation.
- The 'SR' (Standard Resolution) suffix for IFS-FESOM suggests coarser ocean resolution compared to the 'ER' (Eddy Rich) models, which may contribute to the Southern Ocean biases.
Surface Sensible Heat Flux JJA Bias
| Variables | hfss |
|---|---|
| Models | IFS-FESOM2-SR, IFS-NEMO-ER, ICON-ESM-ER |
| Reference Dataset | ERA5 |
| Units | W/m2 |
| Period | 1980–2014 |
Summary high
This diagnostic compares JJA climatological Surface Sensible Heat Flux (SHF) biases of three high-resolution coupled models (IFS-FESOM2-SR, IFS-NEMO-ER, ICON-ESM-ER) against ERA5 reanalysis.
Key Findings
- ICON-ESM-ER exhibits severe widespread biases over land, with excessive sensible heat flux (>30 W/m²) over Northern Hemisphere boreal/temperate regions and strong negative biases over tropical rainforests (Amazon, Congo).
- Both IFS-based models (FESOM and NEMO) show very similar terrestrial bias patterns, characterized by moderate positive biases over the Tibetan Plateau and Central Asia, and negative biases over the Sahel and parts of the Amazon.
- All models display prominent zonal dipole bias patterns in the Southern Ocean (SH winter), indicating mismatches in the latitudinal position of the sea ice edge compared to ERA5.
Spatial Patterns
The most striking spatial feature is the hemispheric contrast in land biases for ICON-ESM-ER: a strong positive bias in the summer hemisphere (North America, Eurasia) versus a strong negative bias in the tropical wet zones. In the Southern Ocean, alternating bands of positive and negative bias track the marginal ice zone.
Model Agreement
The two IFS models agree closely on land biases, suggesting these originate from the shared atmospheric component (IFS physics) rather than the ocean coupling. ICON-ESM-ER diverges significantly with much larger bias magnitudes over land. All models agree on the existence of sea-ice related biases in the Southern Ocean, though the precise spatial phase differs.
Physical Interpretation
The land biases in ICON suggest a systematic error in surface energy partitioning (Bowen ratio): the model likely suffers from soil moisture deficits or excessive surface coupling in the NH mid-latitudes (forcing high SHF) and excessive evapotranspiration in the tropics (suppressing SHF). Southern Ocean biases are thermodynamically driven by sea ice extent errors; positive biases occur where models simulate open water (releasing heat) instead of observed ice (insulating), and vice versa for negative biases.
Caveats
- ERA5 is a model-derived reanalysis product, though heavily constrained by observations; surface fluxes are not directly observed.
- Sign convention is interpreted as positive upward (surface to atmosphere) based on high positive values over summer deserts.
Total Precipitation Rate Annual Mean Bias
| Variables | pr |
|---|---|
| Models | IFS-FESOM2-SR, IFS-NEMO-ER, ICON-ESM-ER, HadGEM3-GC5, CMIP6 MMM, MPI-ESM1-2-LR/r1i1p1f1, GISS-E2-1-G/r1i1p1f2, IPSL-CM6A-LR/r1i1p1f1, ACCESS-ESM1-5/r1i1p1f1, EC-Earth3/r1i1p1f1, CNRM-CM6-1/r1i1p1f2, AWI-CM-1-1-MR/r1i1p1f1, CNRM-ESM2-1/r1i1p1f2, FGOALS-g3/r1i1p1f1, INM-CM5-0/r1i1p1f1, MRI-ESM2-0/r1i1p1f1 |
| Reference Dataset | ERA5 |
| Units | kg/m2/s |
| Period | 1980–2014 |
| IFS-FESOM2-SR | Global Mean Bias: 0.00 · Rmse: 0.00 |
| IFS-NEMO-ER | Global Mean Bias: -0.00 · Rmse: 0.00 |
| ICON-ESM-ER | Global Mean Bias: 0.00 · Rmse: 0.00 |
| HadGEM3-GC5 | Global Mean Bias: 0.00 · Rmse: 0.00 |
| CMIP6 MMM | Global Mean Bias: 0.00 · Rmse: 0.00 |
| MPI-ESM1-2-LR/r1i1p1f1 | Global Mean Bias: -0.00 · Rmse: 0.00 |
| GISS-E2-1-G/r1i1p1f2 | Global Mean Bias: 0.00 · Rmse: 0.00 |
| IPSL-CM6A-LR/r1i1p1f1 | Global Mean Bias: 0.00 · Rmse: 0.00 |
| ACCESS-ESM1-5/r1i1p1f1 | Global Mean Bias: 0.00 · Rmse: 0.00 |
| EC-Earth3/r1i1p1f1 | Global Mean Bias: -0.00 · Rmse: 0.00 |
| CNRM-CM6-1/r1i1p1f2 | Global Mean Bias: 0.00 · Rmse: 0.00 |
| AWI-CM-1-1-MR/r1i1p1f1 | Global Mean Bias: -0.00 · Rmse: 0.00 |
| CNRM-ESM2-1/r1i1p1f2 | Global Mean Bias: 0.00 · Rmse: 0.00 |
| FGOALS-g3/r1i1p1f1 | Global Mean Bias: -0.00 · Rmse: 0.00 |
| INM-CM5-0/r1i1p1f1 | Global Mean Bias: 0.00 · Rmse: 0.00 |
| MRI-ESM2-0/r1i1p1f1 | Global Mean Bias: 0.00 · Rmse: 0.00 |
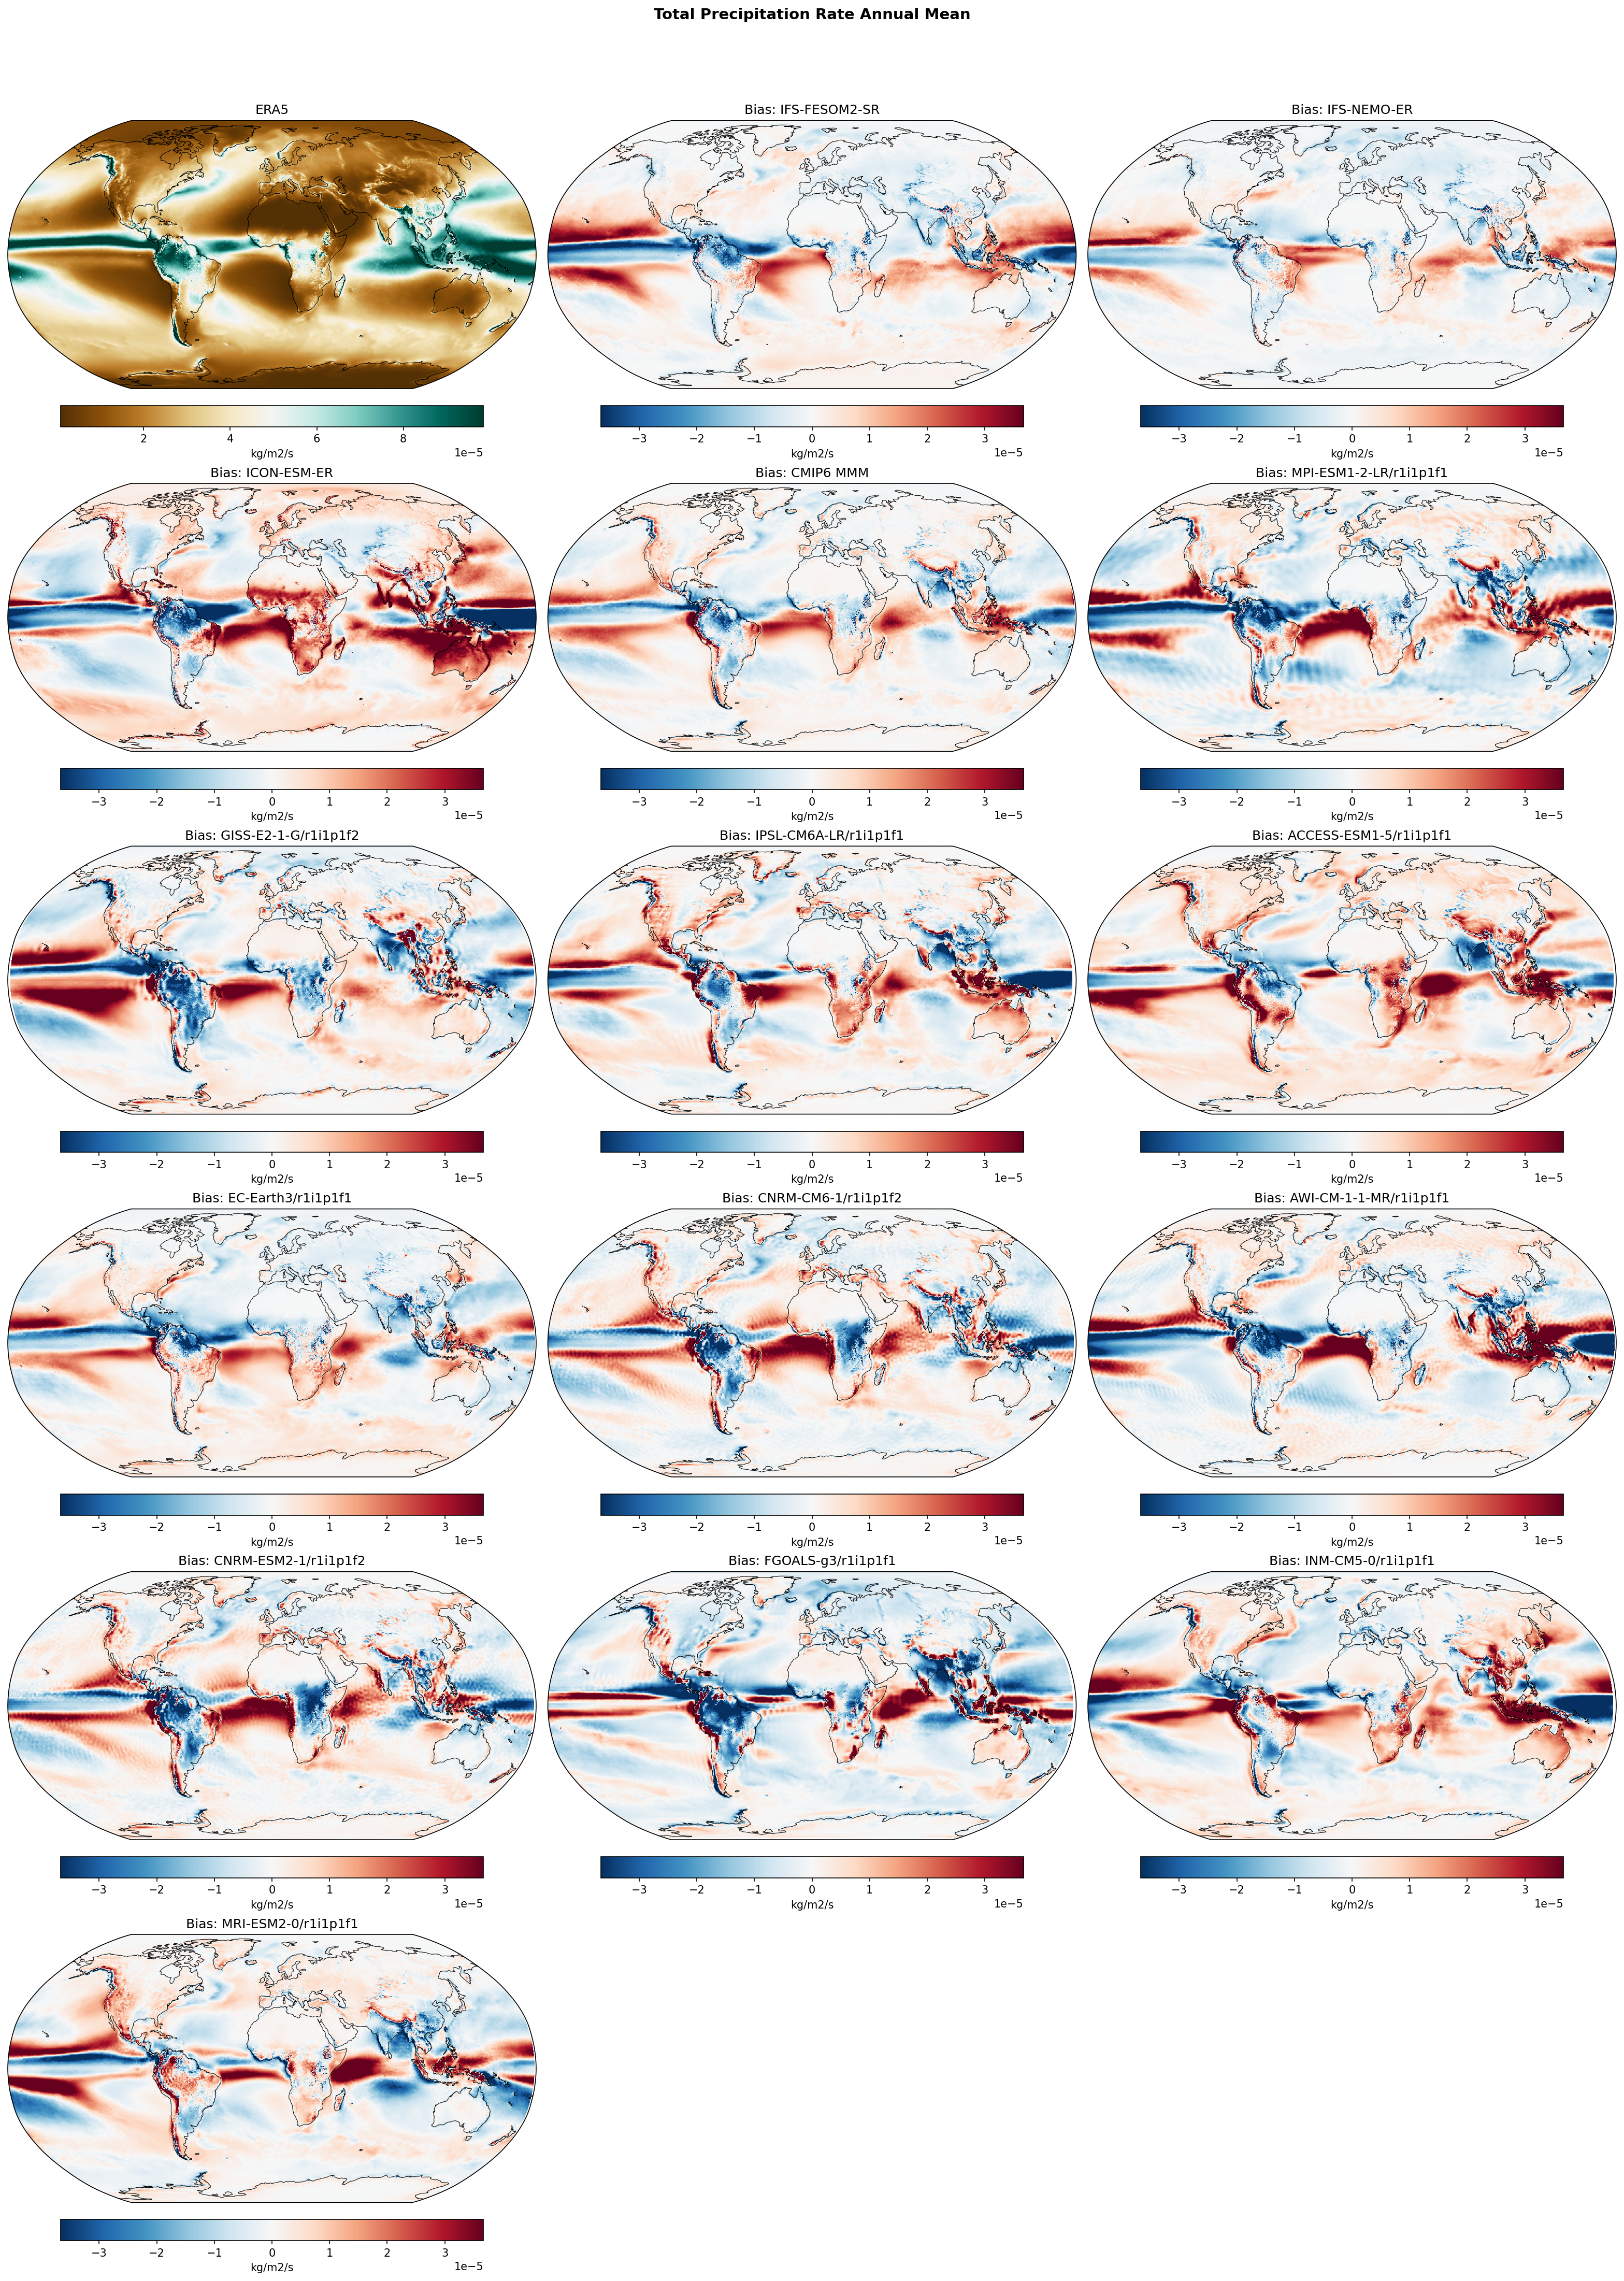
Summary high
This figure evaluates annual mean precipitation biases (kg/m²/s) in high-resolution EERIE models (IFS-NEMO, IFS-FESOM, ICON, HadGEM3) and CMIP6 models relative to ERA5 reanalysis.
Key Findings
- IFS-NEMO-ER achieves the lowest spatial RMSE (8.63e-6 kg/m²/s) of all models shown, significantly outperforming the CMIP6 Multi-Model Mean (1.06e-5 kg/m²/s) and reducing tropical biases seen in other high-res runs.
- A systematic dry bias over the Amazon basin is pervasive across nearly all simulations, including both EERIE high-resolution models and the CMIP6 ensemble.
- ICON-ESM-ER exhibits severe wet biases across the tropical Pacific and Indian Oceans, resulting in the highest RMSE (1.84e-5 kg/m²/s) among the EERIE group.
Spatial Patterns
The 'Double ITCZ' bias (excessive precipitation in the southern tropical Pacific) is prominent in the CMIP6 MMM and several individual models (e.g., FGOALS-g3, IPSL-CM6A-LR), and is visible to a lesser extent in HadGEM3-GC5. The Amazon shows a strong dry bias (blue) in almost all panels. The Indian Ocean frequently displays a dipole-like bias pattern (wet western/dry eastern anomalies), particularly strong in ICON-ESM-ER and IFS-FESOM2-SR.
Model Agreement
Models universally struggle with Amazonian precipitation (dry bias). There is significant divergence in the tropical Pacific: IFS-NEMO-ER is relatively skillful, whereas ICON-ESM-ER and GISS-E2-1-G show massive wet biases. The CMIP6 MMM effectively smooths out individual noise but retains structural errors like the double ITCZ, which IFS-NEMO-ER largely avoids.
Physical Interpretation
The pervasive Amazon dry bias suggests common deficiencies in land-surface coupling or deep convection parameterizations over tropical rainforests. The excessive tropical wet biases in ICON-ESM-ER likely stem from overly aggressive convective parameterization or feedback with warm SST biases. The superior performance of IFS-NEMO-ER compared to IFS-FESOM2-SR (which shares the atmospheric component) highlights the critical role of ocean coupling (NEMO vs. FESOM) and specific tuning in regulating the hydrological cycle.
Caveats
- ERA5 precipitation over the ocean is generated by the forecast model and is not purely observational, though it is a standard reference.
- Annual means obscure seasonal biases, particularly important for monsoon systems like the South Asian or West African monsoons.
Total Precipitation Rate DJF Bias
| Variables | pr |
|---|---|
| Models | IFS-FESOM2-SR, IFS-NEMO-ER, ICON-ESM-ER, HadGEM3-GC5, CMIP6 MMM, MPI-ESM1-2-LR/r1i1p1f1, GISS-E2-1-G/r1i1p1f2, IPSL-CM6A-LR/r1i1p1f1, ACCESS-ESM1-5/r1i1p1f1, EC-Earth3/r1i1p1f1, CNRM-CM6-1/r1i1p1f2, AWI-CM-1-1-MR/r1i1p1f1, CNRM-ESM2-1/r1i1p1f2, FGOALS-g3/r1i1p1f1, INM-CM5-0/r1i1p1f1, MRI-ESM2-0/r1i1p1f1 |
| Reference Dataset | ERA5 |
| Units | kg/m2/s |
| Period | 1980–2014 |
| CMIP6 MMM | Global Mean Bias: 0.00 · Rmse: None |
| MPI-ESM1-2-LR/r1i1p1f1 | Global Mean Bias: -0.00 · Rmse: None |
| GISS-E2-1-G/r1i1p1f2 | Global Mean Bias: 0.00 · Rmse: None |
| IPSL-CM6A-LR/r1i1p1f1 | Global Mean Bias: 0.00 · Rmse: None |
| ACCESS-ESM1-5/r1i1p1f1 | Global Mean Bias: 0.00 · Rmse: None |
| EC-Earth3/r1i1p1f1 | Global Mean Bias: 0.00 · Rmse: None |
| CNRM-CM6-1/r1i1p1f2 | Global Mean Bias: 0.00 · Rmse: None |
| AWI-CM-1-1-MR/r1i1p1f1 | Global Mean Bias: 0.00 · Rmse: None |
| CNRM-ESM2-1/r1i1p1f2 | Global Mean Bias: 0.00 · Rmse: None |
| FGOALS-g3/r1i1p1f1 | Global Mean Bias: -0.00 · Rmse: None |
| INM-CM5-0/r1i1p1f1 | Global Mean Bias: 0.00 · Rmse: None |
| MRI-ESM2-0/r1i1p1f1 | Global Mean Bias: 0.00 · Rmse: None |
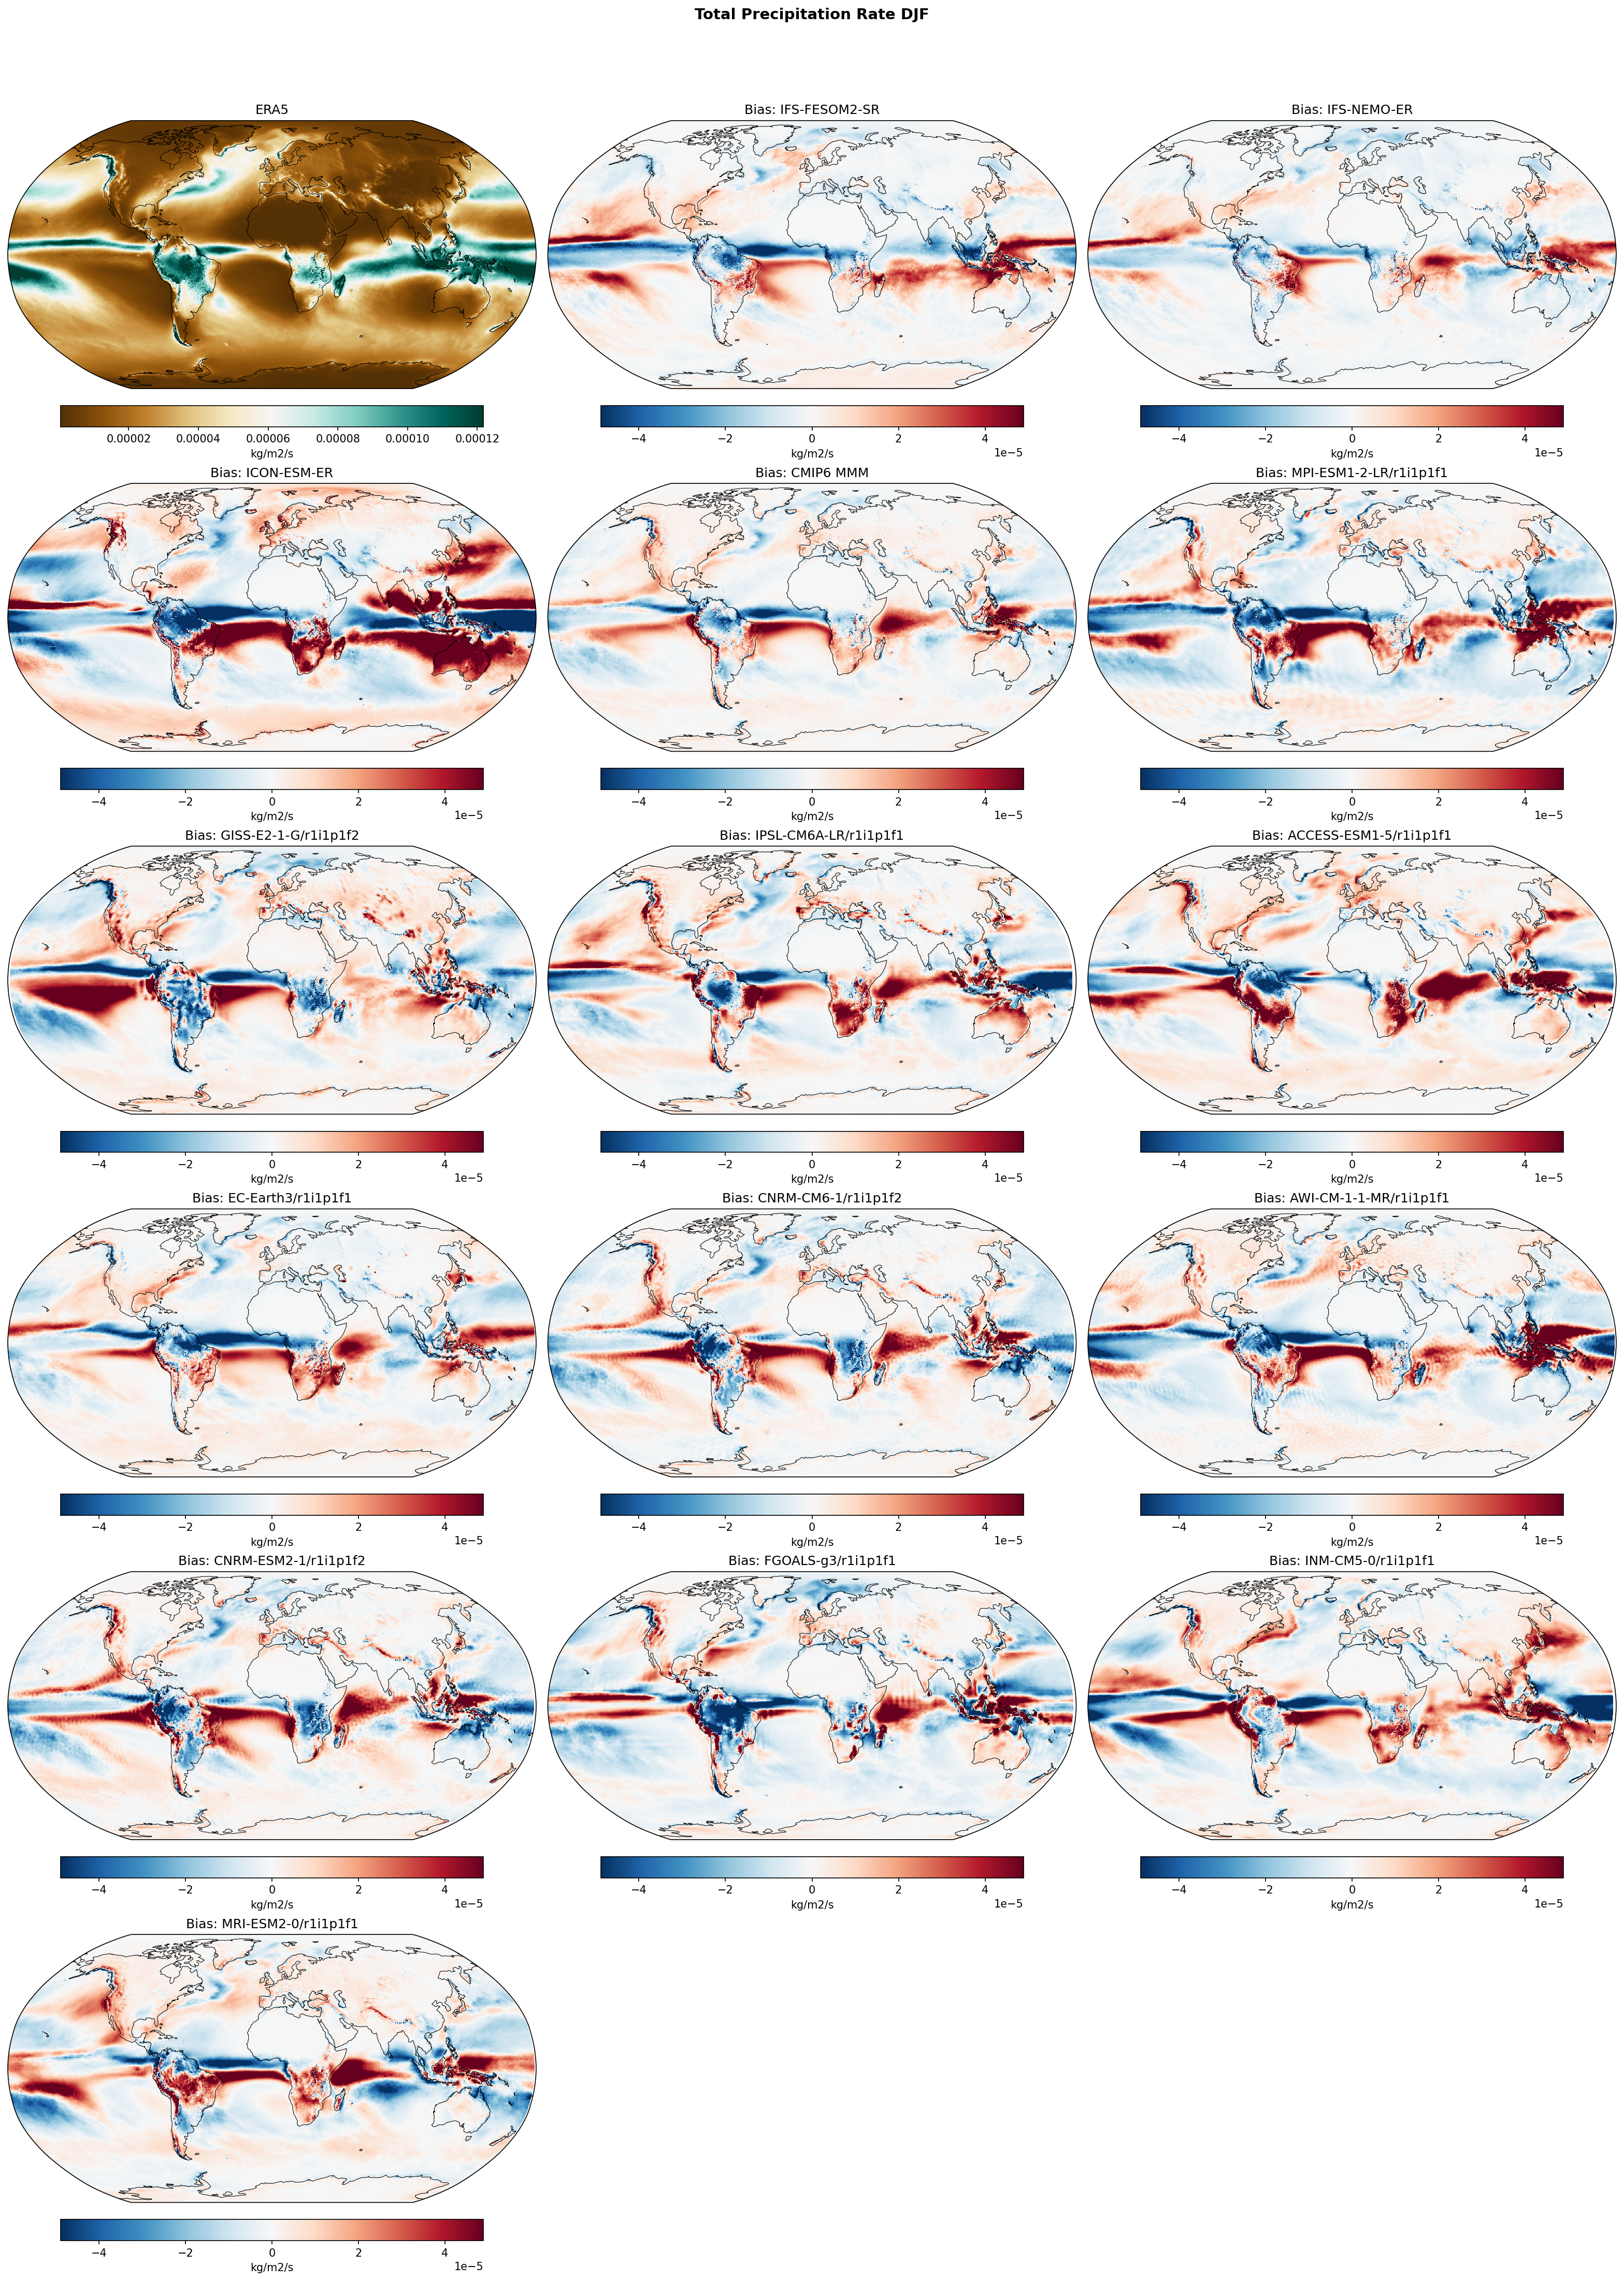
Summary high
This figure evaluates DJF precipitation rate biases (kg/m²/s) for high-resolution EERIE models and the CMIP6 ensemble against ERA5 reanalysis, highlighting persistent tropical systematic errors.
Key Findings
- A systematic 'double ITCZ' bias pattern is evident across both EERIE and CMIP6 models, characterized by a pronounced zonal band of excessive precipitation in the southern tropical Pacific (extending the SPCZ too far east).
- Widespread dry biases exist over the Amazon basin and the Maritime Continent during their wet season (DJF), suggesting a common deficiency in sustaining deep convection over tropical landmasses.
- Among the high-resolution models, ICON-ESM-ER exhibits the highest amplitude biases, with intense wet/dry dipoles in the tropics, whereas the IFS-FESOM2-SR and IFS-NEMO-ER simulations show nearly identical, slightly more moderate spatial error patterns.
Spatial Patterns
The most dominant spatial feature is the tropical dipole: excessive rainfall in the Southern Pacific (roughly 5°S–15°S) and Western Indian Ocean, contrasted with strong dry biases over the Amazon, Indonesia, and Northern Australia. In the extratropics, biases are more regional and variable, though wet biases appear in the North Atlantic storm track for several models (e.g., ICON, GISS).
Model Agreement
There is high inter-model agreement on the sign and location of tropical biases, indicating that increased resolution (in EERIE models) does not automatically resolve the double ITCZ or Amazon dry bias issues found in standard CMIP6 models. The IFS-FESOM2 and IFS-NEMO comparison shows that changing the ocean model grid (unstructured vs. structured) has minimal impact on the atmospheric precipitation bias structure.
Physical Interpretation
The persistent tropical biases point to structural deficiencies in convective parameterizations and atmosphere-ocean coupling. The 'double ITCZ' syndrome involves positive feedbacks between SST, wind stress, and convection that cause the SPCZ to become too zonal. The Amazon dry bias suggests insufficient moisture convergence or land-surface coupling issues preventing the model from capturing the full intensity of the South American Monsoon.
Caveats
- The color bar saturates at ±4e-5 kg/m²/s (~3.5 mm/day), so peak biases in the ITCZ/SPCZ cores likely exceed the visualized range.
- ERA5 is a reanalysis product; while robust, it relies on model physics in data-sparse tropical oceans, so 'biases' are technically model-reanalysis differences.
Total Precipitation Rate JJA Bias
| Variables | pr |
|---|---|
| Models | IFS-FESOM2-SR, IFS-NEMO-ER, ICON-ESM-ER, HadGEM3-GC5, CMIP6 MMM, MPI-ESM1-2-LR/r1i1p1f1, GISS-E2-1-G/r1i1p1f2, IPSL-CM6A-LR/r1i1p1f1, ACCESS-ESM1-5/r1i1p1f1, EC-Earth3/r1i1p1f1, CNRM-CM6-1/r1i1p1f2, AWI-CM-1-1-MR/r1i1p1f1, CNRM-ESM2-1/r1i1p1f2, FGOALS-g3/r1i1p1f1, INM-CM5-0/r1i1p1f1, MRI-ESM2-0/r1i1p1f1 |
| Reference Dataset | ERA5 |
| Units | kg/m2/s |
| Period | 1980–2014 |
| CMIP6 MMM | Global Mean Bias: 0.00 · Rmse: None |
| MPI-ESM1-2-LR/r1i1p1f1 | Global Mean Bias: -0.00 · Rmse: None |
| GISS-E2-1-G/r1i1p1f2 | Global Mean Bias: -0.00 · Rmse: None |
| IPSL-CM6A-LR/r1i1p1f1 | Global Mean Bias: 0.00 · Rmse: None |
| ACCESS-ESM1-5/r1i1p1f1 | Global Mean Bias: 0.00 · Rmse: None |
| EC-Earth3/r1i1p1f1 | Global Mean Bias: -0.00 · Rmse: None |
| CNRM-CM6-1/r1i1p1f2 | Global Mean Bias: -0.00 · Rmse: None |
| AWI-CM-1-1-MR/r1i1p1f1 | Global Mean Bias: -0.00 · Rmse: None |
| CNRM-ESM2-1/r1i1p1f2 | Global Mean Bias: 0.00 · Rmse: None |
| FGOALS-g3/r1i1p1f1 | Global Mean Bias: -0.00 · Rmse: None |
| INM-CM5-0/r1i1p1f1 | Global Mean Bias: 0.00 · Rmse: None |
| MRI-ESM2-0/r1i1p1f1 | Global Mean Bias: 0.00 · Rmse: None |
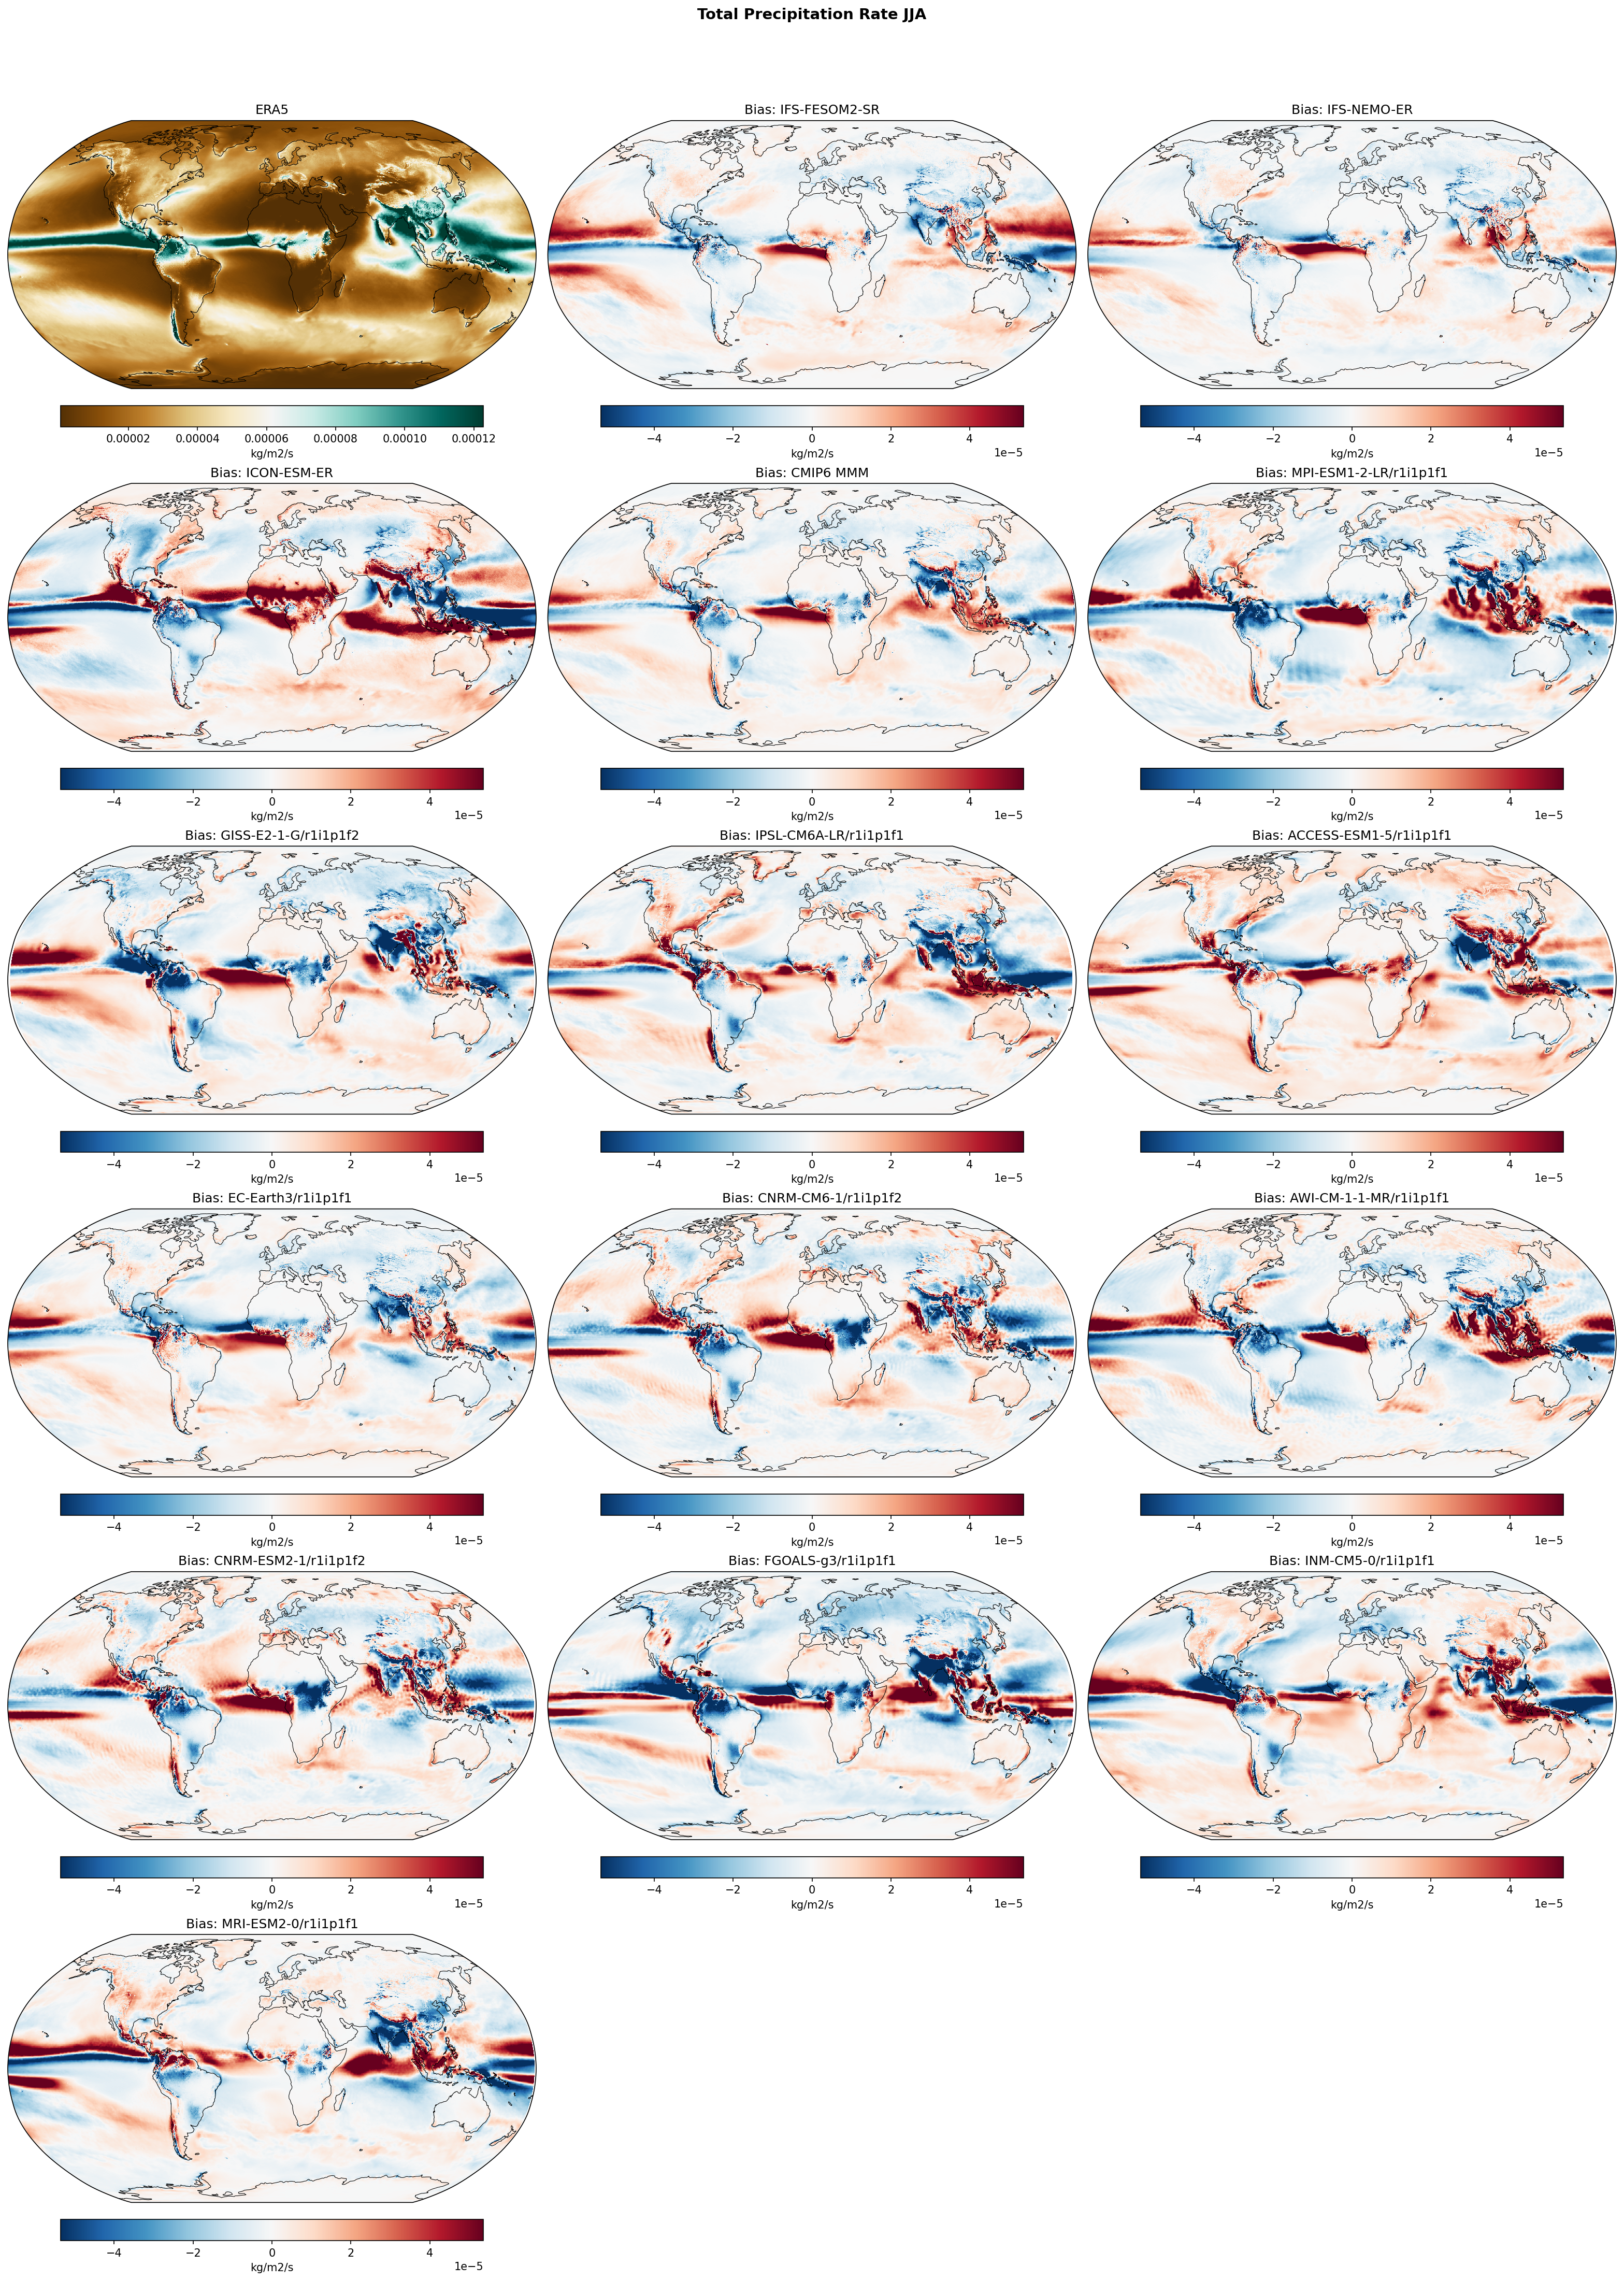
Summary high
This figure evaluates June-August (JJA) precipitation rate biases in high-resolution EERIE models (IFS, ICON, HadGEM3) and a suite of CMIP6 models against ERA5 reanalysis.
Key Findings
- A pervasive dry bias exists over the Amazon basin and northern South America in almost all models (both high-resolution and CMIP6), indicating a systematic deficiency in simulating continental convection or moisture recycling during the local dry/transition season.
- The South Asian Monsoon is poorly represented in spatial distribution; IFS and ICON models exhibit a 'dry land/wet ocean' dipole, with substantial precipitation deficits over the Indian subcontinent and excesses over the Arabian Sea, Bay of Bengal, and Himalayan foothills.
- Tropical Pacific biases indicate persistent ITCZ issues: ICON-ESM-ER and HadGEM3-GC5 show excessive precipitation intensity in the Northern Hemisphere ITCZ, while IFS variants and the CMIP6 Multi-Model Mean display zonal banding indicative of a 'Double ITCZ' bias (spurious precipitation south of the equator).
Spatial Patterns
Biases are zonally organized in the tropics. Most models show excessive rainfall over the tropical oceans (Atlantic and Pacific ITCZ regions) and deficits over tropical land masses (South America, India, parts of Africa). High-resolution models (IFS, HadGEM3) reveal sharp, localized bias gradients associated with orography (Andes, Himalayas) that are smoothed out in coarser CMIP6 models.
Model Agreement
There is strong inter-model agreement on the sign of biases over South America (dry) and the Western Indian Ocean (wet). The IFS-FESOM2-SR and IFS-NEMO-ER simulations are virtually identical, demonstrating that the switch between unstructured and structured ocean grids has negligible impact on the atmospheric precipitation bias structure compared to atmospheric physics. ICON-ESM-ER stands out with particularly intense wet biases in the Atlantic ITCZ and dry biases over Central Africa compared to the IFS models.
Physical Interpretation
The 'dry land/wet ocean' dipole, particularly in the monsoon region, suggests difficulties in dynamical moisture transport onto continents or suppression of convection over land surfaces (possibly due to land-surface coupling errors). The excessive ITCZ rainfall suggests overly aggressive deep convection parameterisations in response to warm SSTs. The persistence of these biases in high-resolution (eddy-rich) simulations suggests they are driven by sub-grid physical parameterisations (convection, microphysics) rather than horizontal resolution limits.
Caveats
- JJA is the dry season for the southern Amazon, so biases there may represent small absolute errors, though the deficit extends to the meteorologically active northern Amazon.
- ERA5 is a reanalysis and relies on its own model physics in data-sparse regions (e.g., open oceans), which may influence the apparent bias in the ITCZ.
Mean Sea Level Pressure Annual Mean Bias
| Variables | psl |
|---|---|
| Models | IFS-FESOM2-SR, IFS-NEMO-ER, ICON-ESM-ER, CMIP6 MMM, MPI-ESM1-2-LR/r1i1p1f1, GISS-E2-1-G/r1i1p1f2, IPSL-CM6A-LR/r1i1p1f1, ACCESS-ESM1-5/r1i1p1f1, EC-Earth3/r1i1p1f1, CNRM-CM6-1/r1i1p1f2, AWI-CM-1-1-MR/r1i1p1f1, CNRM-ESM2-1/r1i1p1f2, FGOALS-g3/r1i1p1f1, INM-CM5-0/r1i1p1f1, MRI-ESM2-0/r1i1p1f1 |
| Reference Dataset | ERA5 |
| Units | Pa |
| Period | 1980–2014 |
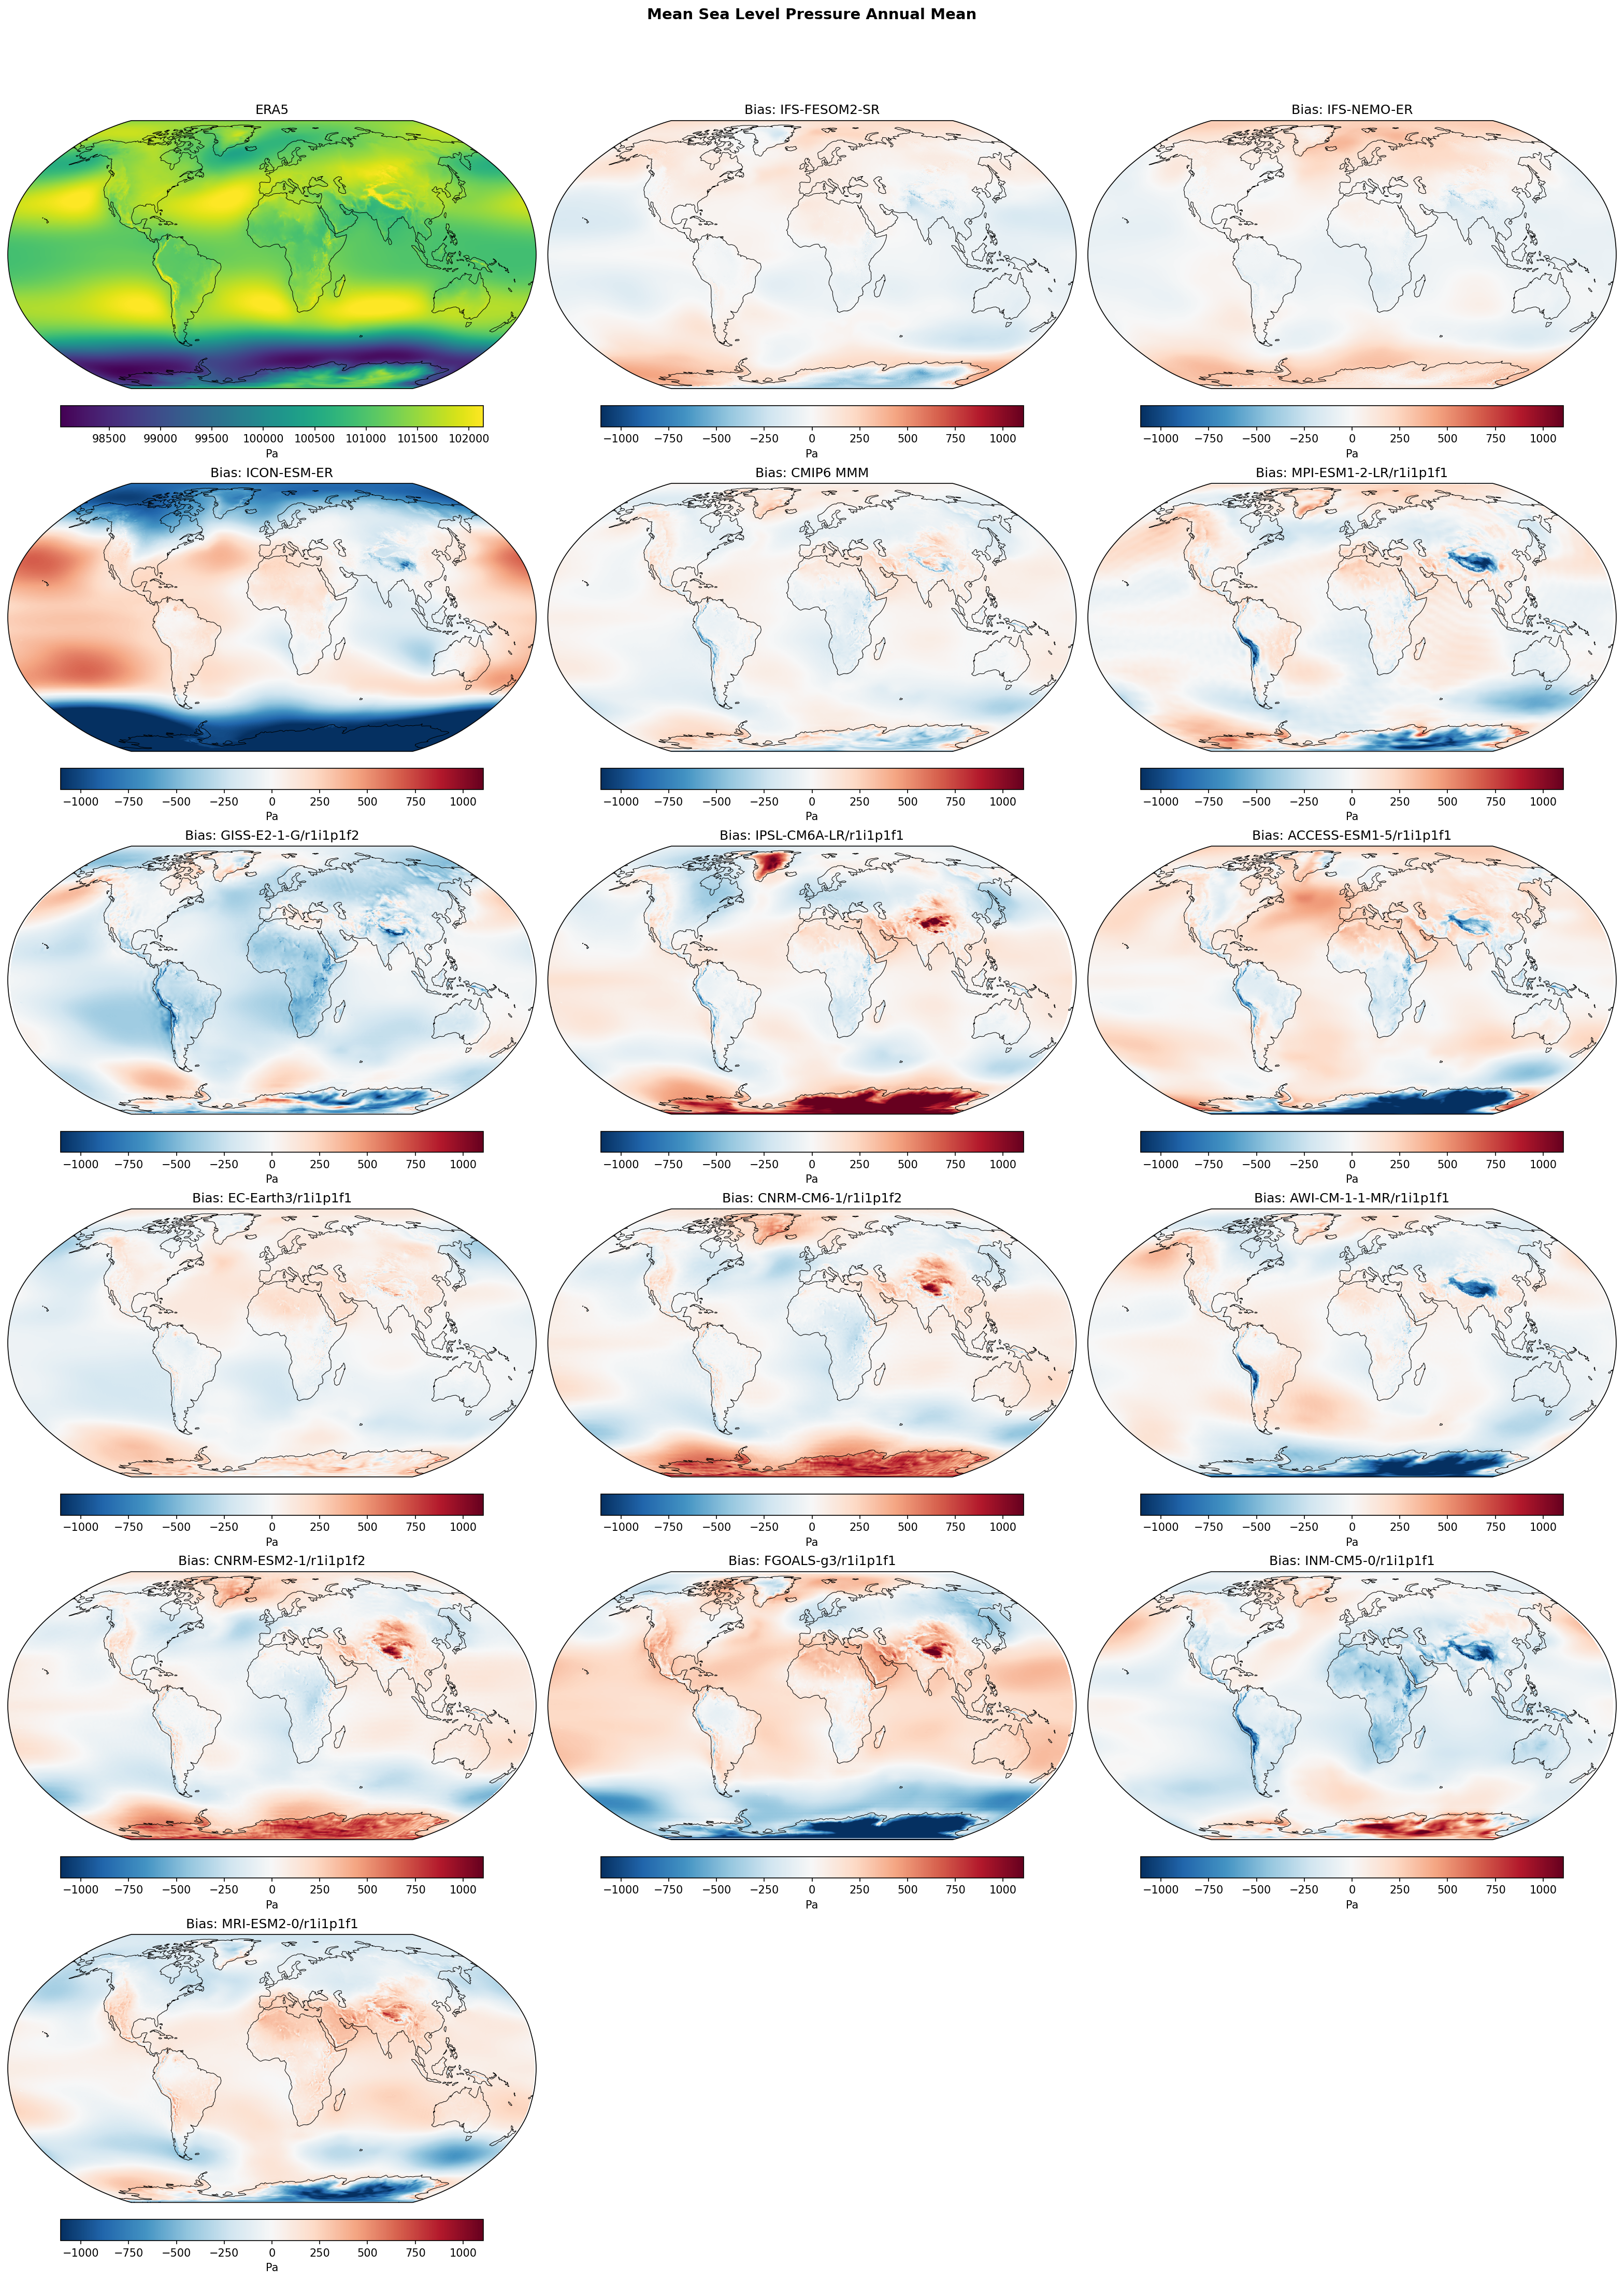
| IFS-FESOM2-SR | Global Mean Bias: -5.87 · Rmse: 101.64 |
| IFS-NEMO-ER | Global Mean Bias: 11.27 · Rmse: 100.14 |
| ICON-ESM-ER | Global Mean Bias: -70.87 · Rmse: 498.55 |
| CMIP6 MMM | Global Mean Bias: -6.21 · Rmse: 87.79 |
| MPI-ESM1-2-LR/r1i1p1f1 | Global Mean Bias: -6.32 · Rmse: 152.40 |
| GISS-E2-1-G/r1i1p1f2 | Global Mean Bias: -140.44 · Rmse: 218.33 |
| IPSL-CM6A-LR/r1i1p1f1 | Global Mean Bias: 38.88 · Rmse: 222.69 |
| ACCESS-ESM1-5/r1i1p1f1 | Global Mean Bias: 41.73 · Rmse: 214.15 |
| EC-Earth3/r1i1p1f1 | Global Mean Bias: -12.01 · Rmse: 106.06 |
| CNRM-CM6-1/r1i1p1f2 | Global Mean Bias: 19.75 · Rmse: 171.00 |
| AWI-CM-1-1-MR/r1i1p1f1 | Global Mean Bias: -20.50 · Rmse: 173.46 |
| CNRM-ESM2-1/r1i1p1f2 | Global Mean Bias: 14.90 · Rmse: 163.48 |
| FGOALS-g3/r1i1p1f1 | Global Mean Bias: 55.43 · Rmse: 296.48 |
| INM-CM5-0/r1i1p1f1 | Global Mean Bias: -72.56 · Rmse: 179.03 |
| MRI-ESM2-0/r1i1p1f1 | Global Mean Bias: 13.57 · Rmse: 182.31 |
Summary high
The figure evaluates annual mean sea level pressure (MSLP) biases relative to ERA5, revealing that the IFS-based high-resolution models (IFS-FESOM2-SR, IFS-NEMO-ER) achieve exceptional accuracy comparable to the CMIP6 Multi-Model Mean, whereas ICON-ESM-ER exhibits severe zonal circulation biases.
Key Findings
- IFS-FESOM2-SR and IFS-NEMO-ER demonstrate the lowest individual model errors (RMSE ~100–102 Pa), effectively matching the noise reduction benefits of the CMIP6 Multi-Model Mean (RMSE ~88 Pa).
- ICON-ESM-ER is a notable outlier with the highest RMSE (~499 Pa), driven by a strong annular bias structure in the Southern Hemisphere: excessive low pressure over Antarctica (<-1000 Pa) and high pressure in the mid-latitudes.
- Southern polar biases exhibit large inter-model spread, ranging from strong positive biases in IPSL-CM6A-LR (>+1000 Pa) to strong negative biases in ICON-ESM-ER and FGOALS-g3 (<-1000 Pa).
Spatial Patterns
The most prominent spatial features are zonal dipole structures in the Southern Hemisphere. ICON-ESM-ER shows a classic positive Southern Annular Mode (SAM)-like bias pattern (low polar pressure, high mid-latitude pressure). In contrast, IPSL-CM6A-LR shows the reverse. The IFS-based models (including EC-Earth3) show very flat, pale bias maps, indicating correct mass distribution. Some models (CNRM, FGOALS) show localized biases over high orography (Himalayas, Andes), likely artifacts of MSLP reduction to sea level.
Model Agreement
There is a distinct clustering of performance: IFS-based models (IFS-NEMO, IFS-FESOM, EC-Earth3) show high agreement with observations. The wider CMIP6 ensemble shows significant divergence, particularly in the high latitudes. ICON-ESM-ER diverges significantly from the other high-resolution EERIE models (IFS variants), suggesting specific tuning or dynamical core issues in its current configuration.
Physical Interpretation
The biases in the Southern Hemisphere reflect errors in the position and intensity of the eddy-driven jet and the storm tracks. ICON's pattern suggests a poleward shift and intensification of the westerly winds (roaring forties/fifties), creating a deep low-pressure anomaly over the pole. The superior performance of the IFS models likely benefits from their physics packages being closely related to the model used to generate the ERA5 reanalysis, ensuring consistent representation of atmospheric mass distribution.
Caveats
- Large biases over high topography (Tibetan Plateau, Antarctica, Andes) in some models may partly result from differences in the methodology used to extrapolate surface pressure to mean sea level rather than purely dynamical errors.
- Annual means may obscure opposing seasonal biases, particularly in monsoon regions.
Mean Sea Level Pressure DJF Bias
| Variables | psl |
|---|---|
| Models | IFS-FESOM2-SR, IFS-NEMO-ER, ICON-ESM-ER, CMIP6 MMM, MPI-ESM1-2-LR/r1i1p1f1, GISS-E2-1-G/r1i1p1f2, IPSL-CM6A-LR/r1i1p1f1, ACCESS-ESM1-5/r1i1p1f1, EC-Earth3/r1i1p1f1, CNRM-CM6-1/r1i1p1f2, AWI-CM-1-1-MR/r1i1p1f1, CNRM-ESM2-1/r1i1p1f2, FGOALS-g3/r1i1p1f1, INM-CM5-0/r1i1p1f1, MRI-ESM2-0/r1i1p1f1 |
| Reference Dataset | ERA5 |
| Units | Pa |
| Period | 1980–2014 |
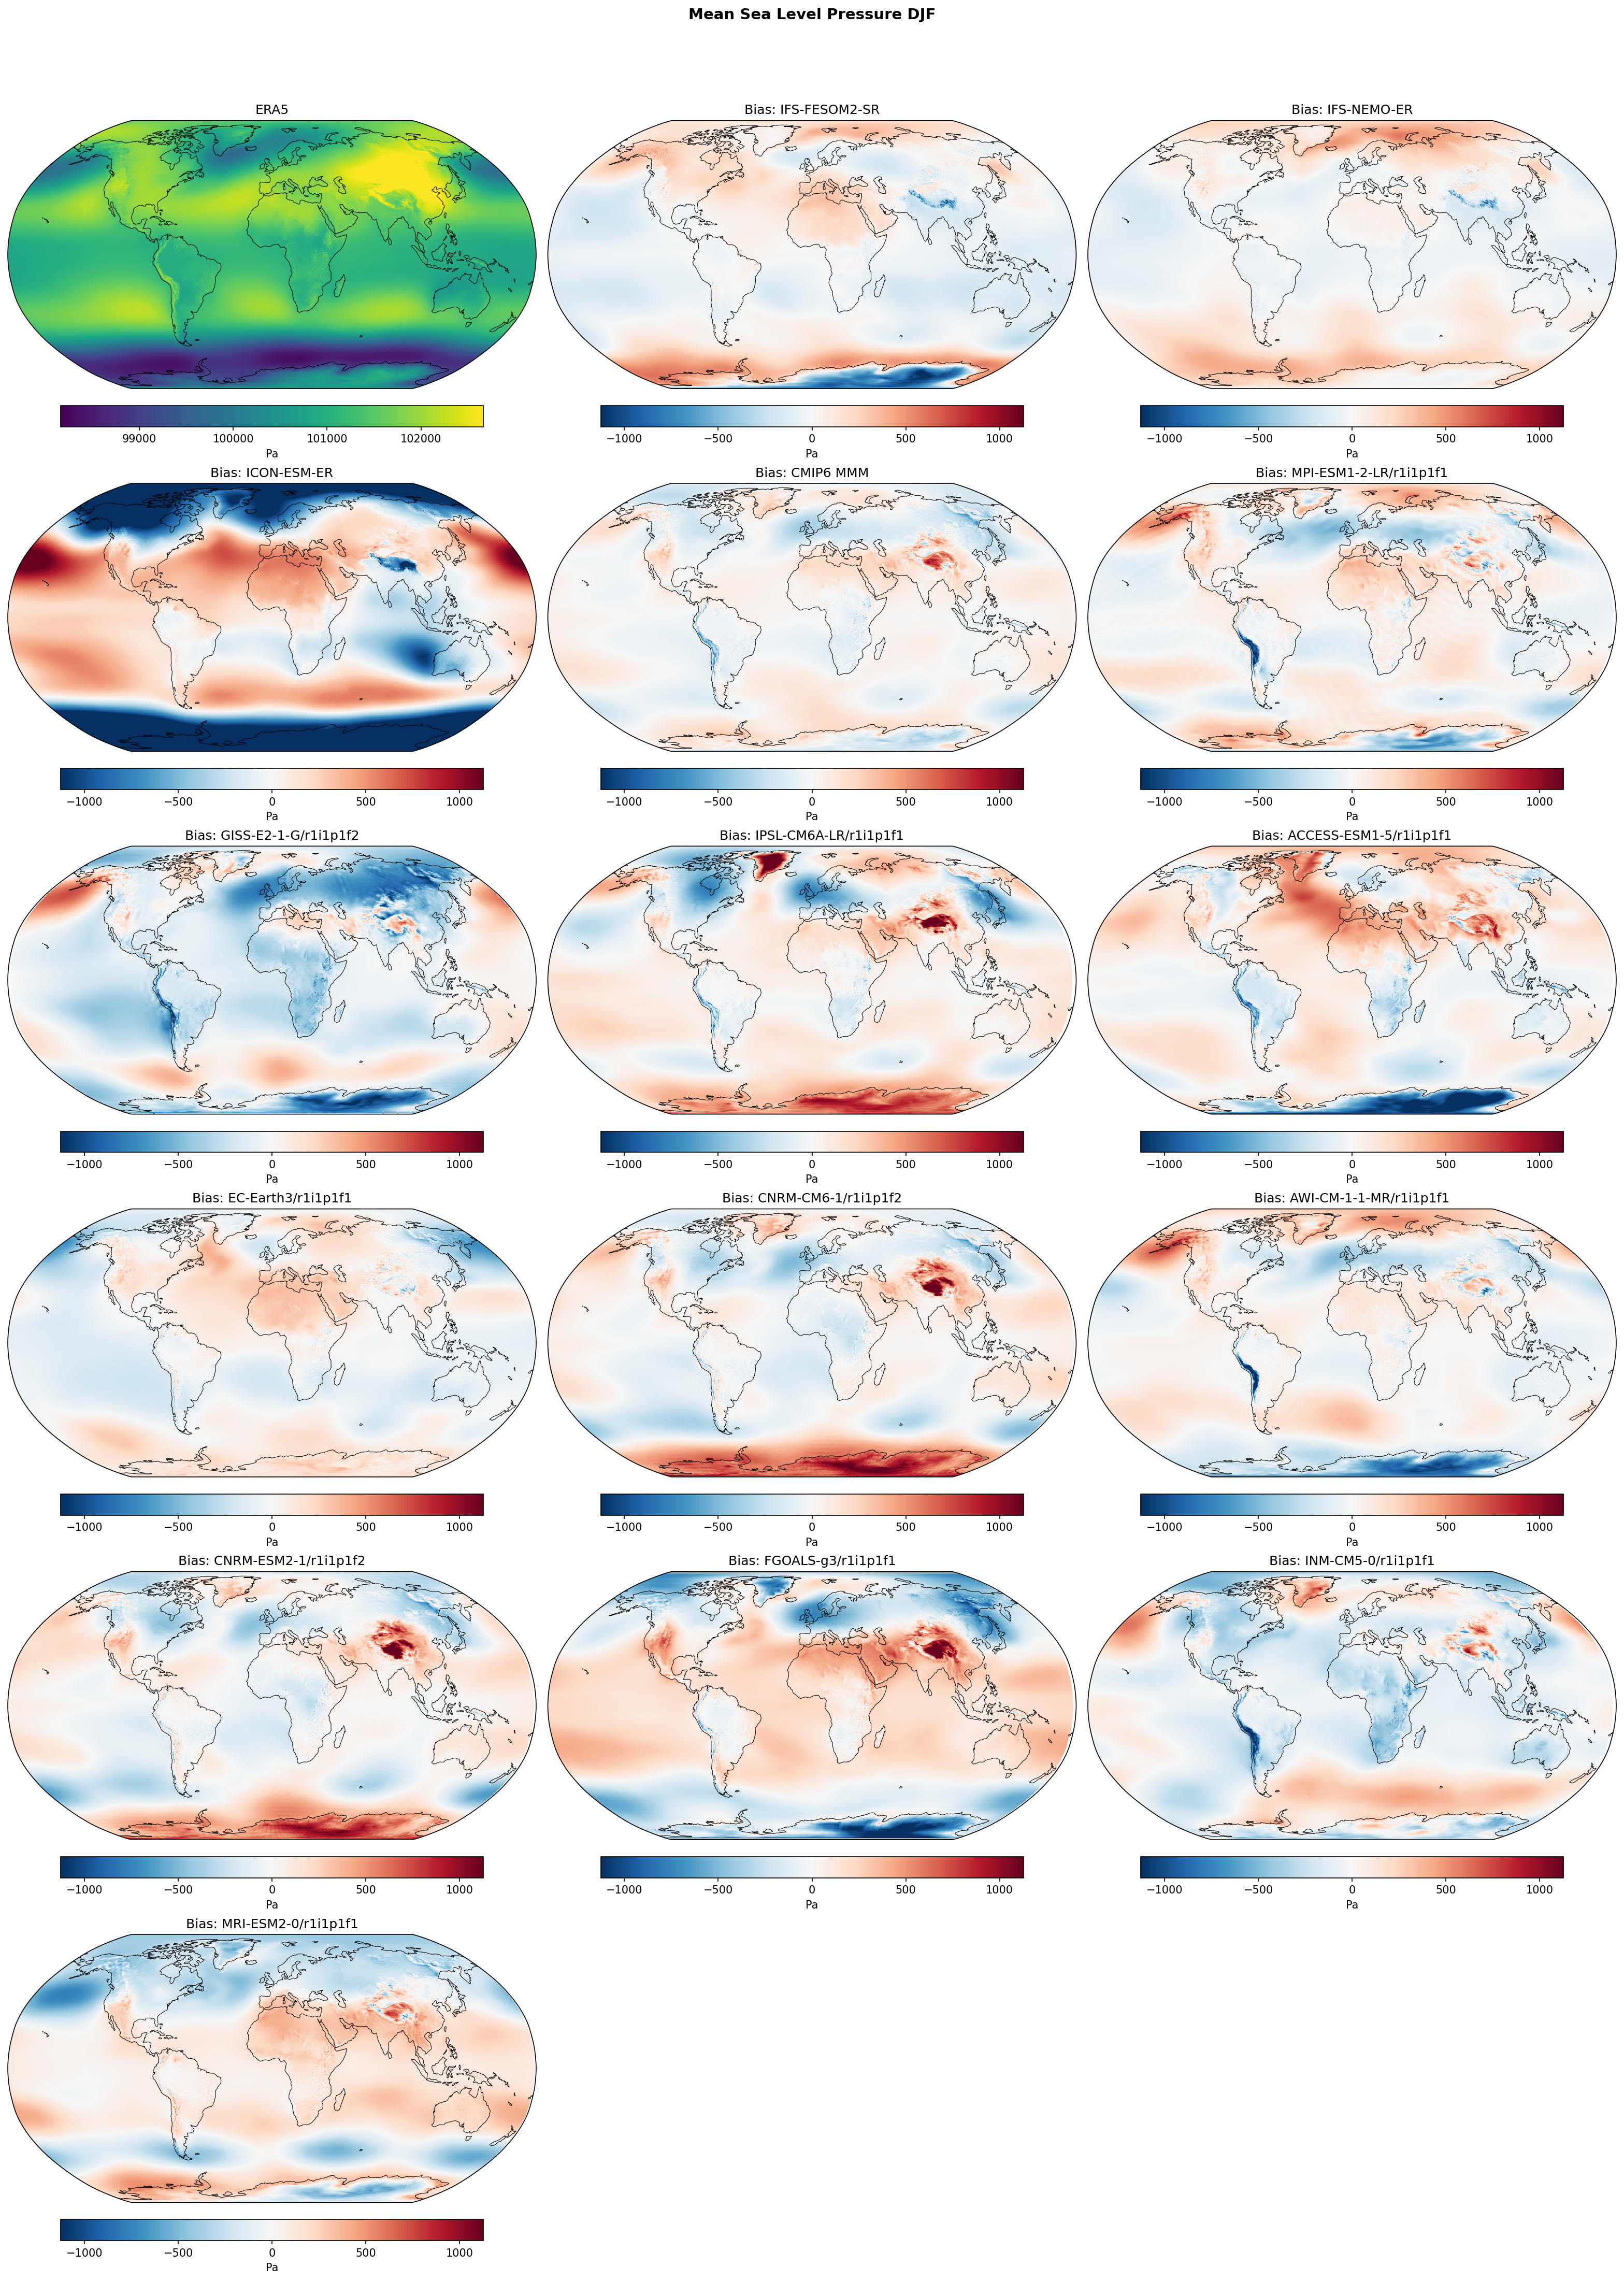
| CMIP6 MMM | Global Mean Bias: 5.51 · Rmse: None |
| MPI-ESM1-2-LR/r1i1p1f1 | Global Mean Bias: 16.28 · Rmse: None |
| GISS-E2-1-G/r1i1p1f2 | Global Mean Bias: -133.09 · Rmse: None |
| IPSL-CM6A-LR/r1i1p1f1 | Global Mean Bias: 47.54 · Rmse: None |
| ACCESS-ESM1-5/r1i1p1f1 | Global Mean Bias: 50.70 · Rmse: None |
| EC-Earth3/r1i1p1f1 | Global Mean Bias: -6.60 · Rmse: None |
| CNRM-CM6-1/r1i1p1f2 | Global Mean Bias: 23.11 · Rmse: None |
| AWI-CM-1-1-MR/r1i1p1f1 | Global Mean Bias: 1.57 · Rmse: None |
| CNRM-ESM2-1/r1i1p1f2 | Global Mean Bias: 17.29 · Rmse: None |
| FGOALS-g3/r1i1p1f1 | Global Mean Bias: 77.08 · Rmse: None |
| INM-CM5-0/r1i1p1f1 | Global Mean Bias: -58.32 · Rmse: None |
| MRI-ESM2-0/r1i1p1f1 | Global Mean Bias: 26.13 · Rmse: None |
Summary high
This figure evaluates DJF Mean Sea Level Pressure (MSLP) biases relative to ERA5. The high-resolution IFS models (FESOM2-SR and NEMO-ER) demonstrate superior skill with minimal global biases, whereas ICON-ESM-ER and the CMIP6 Multi-Model Mean exhibit significant zonal biases, particularly in the Southern Hemisphere.
Key Findings
- IFS-FESOM2-SR and IFS-NEMO-ER show the smallest biases among all models, characterized by mild negative biases (-2 to -5 hPa) along the Antarctic coast and mild positive biases in the North Pacific.
- ICON-ESM-ER exhibits severe systematic biases, including a strong positive bias band (>10 hPa) over the Southern Ocean (40-60°S) and a deep negative bias over Antarctica, indicating a substantial error in the Southern Annular Mode structure or jet position.
- A positive bias over the North Pacific (weakening of the Aleutian Low) is a common feature across most models, including CMIP6 MMM and ICON, though it is less pronounced in the IFS simulations.
- Topographic artifacts over the Himalayas and Andes are prominent in coarser CMIP6 models (e.g., FGOALS-g3, IPSL-CM6A-LR) but are largely mitigated in the high-resolution IFS and ICON models.
Spatial Patterns
The Southern Hemisphere is dominated by zonal bias structures: a dipole pattern in ICON and CMIP6 MMM (positive mid-latitude, negative polar) versus a monopole negative bias in IFS models. In the Northern Hemisphere, positive biases prevail over the North Pacific and often the North Atlantic (e.g., ACCESS-ESM1-5), while continental biases vary widely.
Model Agreement
The two IFS-based models (coupled to FESOM2 and NEMO) show high agreement with each other, suggesting the atmospheric component dominates the MSLP signal. They diverge significantly from ICON-ESM-ER. The CMIP6 ensemble shows large inter-model spread, particularly over high-latitude oceans and topography.
Physical Interpretation
The positive bias belt in the Southern Ocean (ICON/CMIP6) is consistent with the common 'equatorward bias' of the Southern Hemisphere eddy-driven jet, where the circumpolar trough is too weak or displaced north. The IFS models conversely tend to deepen the circumpolar trough (negative bias). Positive biases in the North Pacific suggest an underestimation of cyclone activity or intensity in the Aleutian Low region.
Caveats
- Large biases over high terrain (Himalayas, Greenland, Antarctica) may partly result from differences in MSLP reduction algorithms rather than dynamic errors.
- The analysis is limited to the DJF season; biases may differ in JJA.
Mean Sea Level Pressure JJA Bias
| Variables | psl |
|---|---|
| Models | IFS-FESOM2-SR, IFS-NEMO-ER, ICON-ESM-ER, CMIP6 MMM, MPI-ESM1-2-LR/r1i1p1f1, GISS-E2-1-G/r1i1p1f2, IPSL-CM6A-LR/r1i1p1f1, ACCESS-ESM1-5/r1i1p1f1, EC-Earth3/r1i1p1f1, CNRM-CM6-1/r1i1p1f2, AWI-CM-1-1-MR/r1i1p1f1, CNRM-ESM2-1/r1i1p1f2, FGOALS-g3/r1i1p1f1, INM-CM5-0/r1i1p1f1, MRI-ESM2-0/r1i1p1f1 |
| Reference Dataset | ERA5 |
| Units | Pa |
| Period | 1980–2014 |
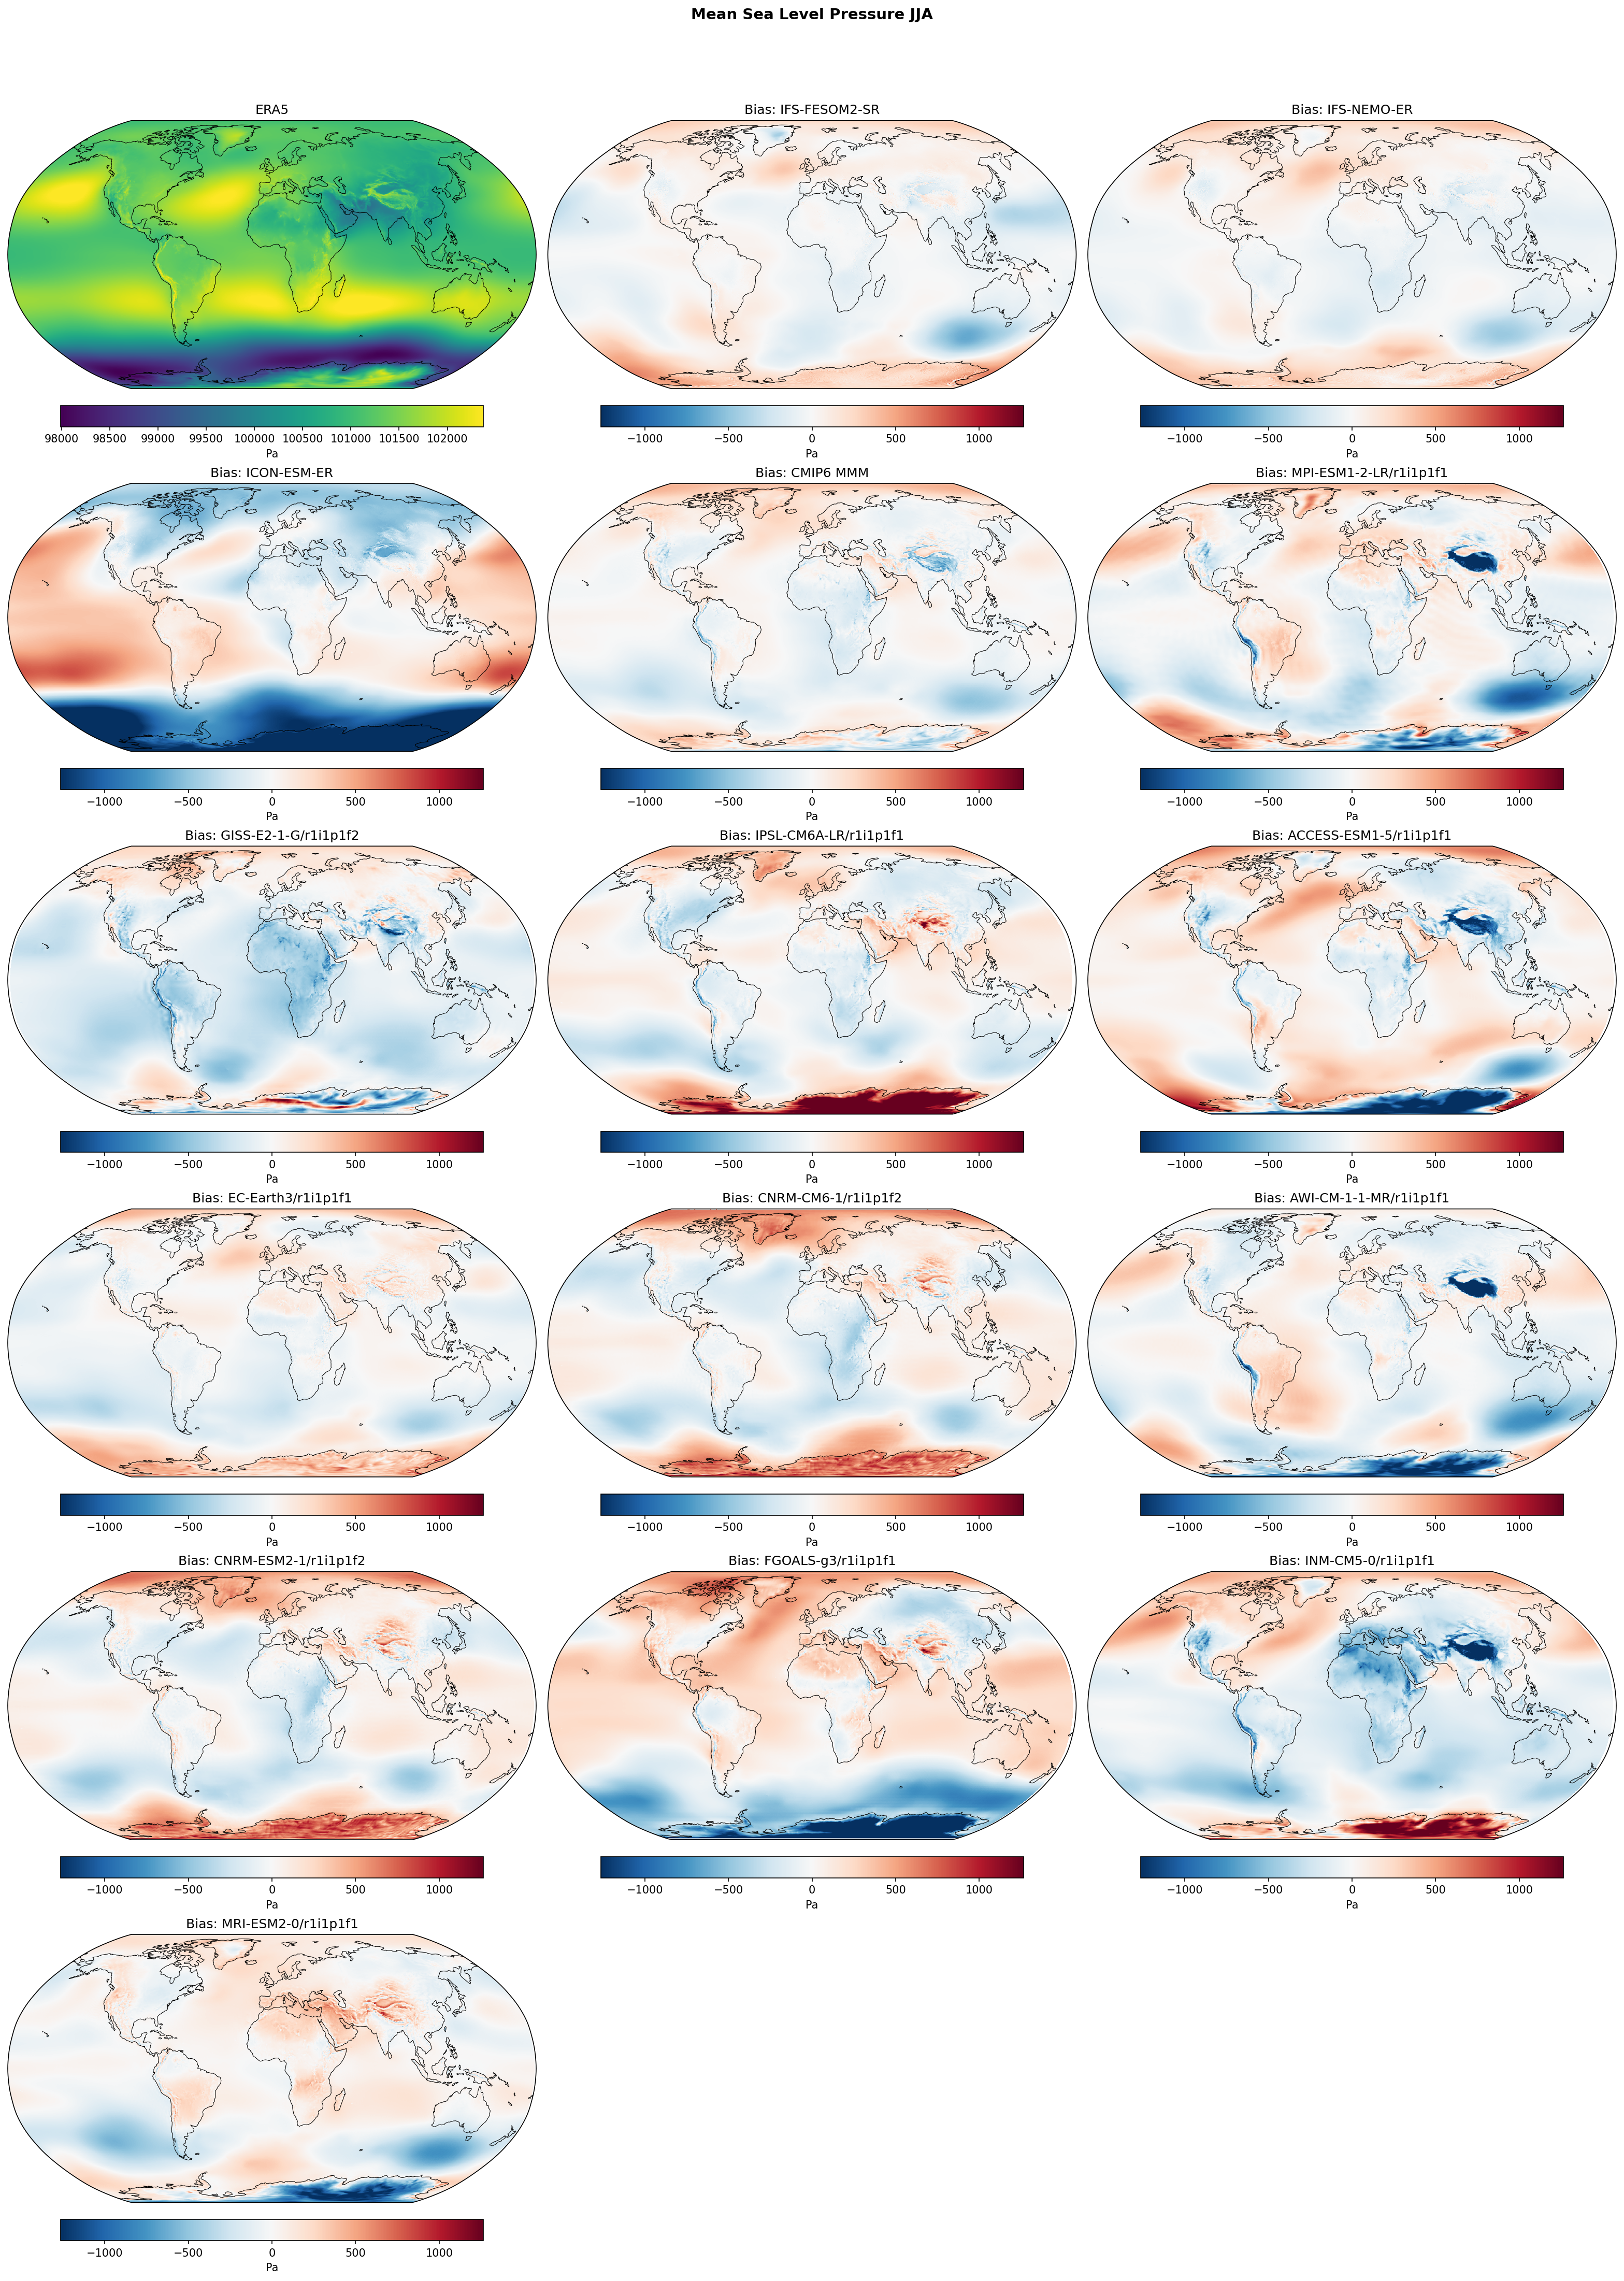
| CMIP6 MMM | Global Mean Bias: -19.52 · Rmse: None |
| MPI-ESM1-2-LR/r1i1p1f1 | Global Mean Bias: -28.57 · Rmse: None |
| GISS-E2-1-G/r1i1p1f2 | Global Mean Bias: -153.91 · Rmse: None |
| IPSL-CM6A-LR/r1i1p1f1 | Global Mean Bias: 25.92 · Rmse: None |
| ACCESS-ESM1-5/r1i1p1f1 | Global Mean Bias: 32.87 · Rmse: None |
| EC-Earth3/r1i1p1f1 | Global Mean Bias: -14.80 · Rmse: None |
| CNRM-CM6-1/r1i1p1f2 | Global Mean Bias: 17.60 · Rmse: None |
| AWI-CM-1-1-MR/r1i1p1f1 | Global Mean Bias: -42.66 · Rmse: None |
| CNRM-ESM2-1/r1i1p1f2 | Global Mean Bias: 14.80 · Rmse: None |
| FGOALS-g3/r1i1p1f1 | Global Mean Bias: 30.64 · Rmse: None |
| INM-CM5-0/r1i1p1f1 | Global Mean Bias: -93.68 · Rmse: None |
| MRI-ESM2-0/r1i1p1f1 | Global Mean Bias: -3.18 · Rmse: None |
Summary high
This figure evaluates Mean Sea Level Pressure (JJA) biases relative to ERA5 for high-resolution EERIE models and a selection of CMIP6 models. The IFS-based models (IFS-FESOM2-SR, IFS-NEMO-ER) demonstrate superior skill with reduced bias magnitudes compared to ICON-ESM-ER and many CMIP6 models, particularly in the Southern Hemisphere.
Key Findings
- ICON-ESM-ER exhibits a severe zonal bias pattern in the Southern Hemisphere, characterized by a deep negative pressure bias (< -1000 Pa) around 60°S (Antarctic Circumpolar Trough) and positive biases in the southern mid-latitudes, indicating an overly strong meridional pressure gradient and excessive westerly winds.
- IFS-FESOM2-SR and IFS-NEMO-ER show remarkably similar and low-amplitude bias patterns, with only slight overestimation of Northern Hemisphere subtropical highs (positive bias) and minor negative biases in the Southern Ocean, outperforming the CMIP6 Multi-Model Mean in many regions.
- Many standard-resolution CMIP6 models (e.g., MPI-ESM1-2-LR, ACCESS-ESM1-5, INM-CM5-0) display prominent localized biases over steep topography (Himalayas, Andes) and distinct zonal banding errors in the Southern Hemisphere, which are largely ameliorated in the high-resolution IFS simulations.
Spatial Patterns
The dominant spatial feature is the zonal banding in the Southern Hemisphere seen in ICON and several CMIP6 models (dipole structure between 40°S and 60°S). In the Northern Hemisphere, biases are more regional, often centered on the semi-permanent subtropical highs (North Pacific and Azores Highs), which tend to be overestimated (red bias) in IFS models and underestimated (blue bias) in INM-CM5-0.
Model Agreement
There is very high agreement between the two IFS configurations (FESOM vs. NEMO), suggesting that the ocean model grid/formulation has a negligible immediate impact on the climatological atmospheric pressure distribution. Conversely, there is significant divergence between the IFS and ICON atmospheric components, with ICON resembling the more erroneous subset of CMIP6 models in the Southern Ocean.
Physical Interpretation
The deep negative bias in the Southern Ocean for ICON-ESM-ER indicates an excessively deep Antarctic Circumpolar Trough, a common bias often linked to cloud-radiation feedback errors or insufficient surface drag, leading to a 'too zonal' and excessively strong Southern Annular Mode flow. The reduction of orographic noise (e.g., over Tibet) in the high-resolution models confirms that better resolved topography reduces spectral truncation errors in pressure reduction to sea level.
Caveats
- GISS-E2-1-G shows a notable global mean negative bias (-153 Pa), potentially indicating a global mass fix or reference level issue rather than just regional dynamical errors.
- Biases are shown for JJA only; winter hemisphere (SH) dynamical biases are typically most pronounced in this season.
Surface Downwelling Longwave Annual Mean Bias
| Variables | rlds |
|---|---|
| Models | IFS-FESOM2-SR, IFS-NEMO-ER, ICON-ESM-ER, CMIP6 MMM, MPI-ESM1-2-LR/r1i1p1f1, GISS-E2-1-G/r1i1p1f2, IPSL-CM6A-LR/r1i1p1f1, ACCESS-ESM1-5/r1i1p1f1, EC-Earth3/r1i1p1f1, CNRM-CM6-1/r1i1p1f2, AWI-CM-1-1-MR/r1i1p1f1, CNRM-ESM2-1/r1i1p1f2, FGOALS-g3/r1i1p1f1, INM-CM5-0/r1i1p1f1, MRI-ESM2-0/r1i1p1f1 |
| Reference Dataset | ERA5 |
| Units | W/m2 |
| Period | 1980–2014 |
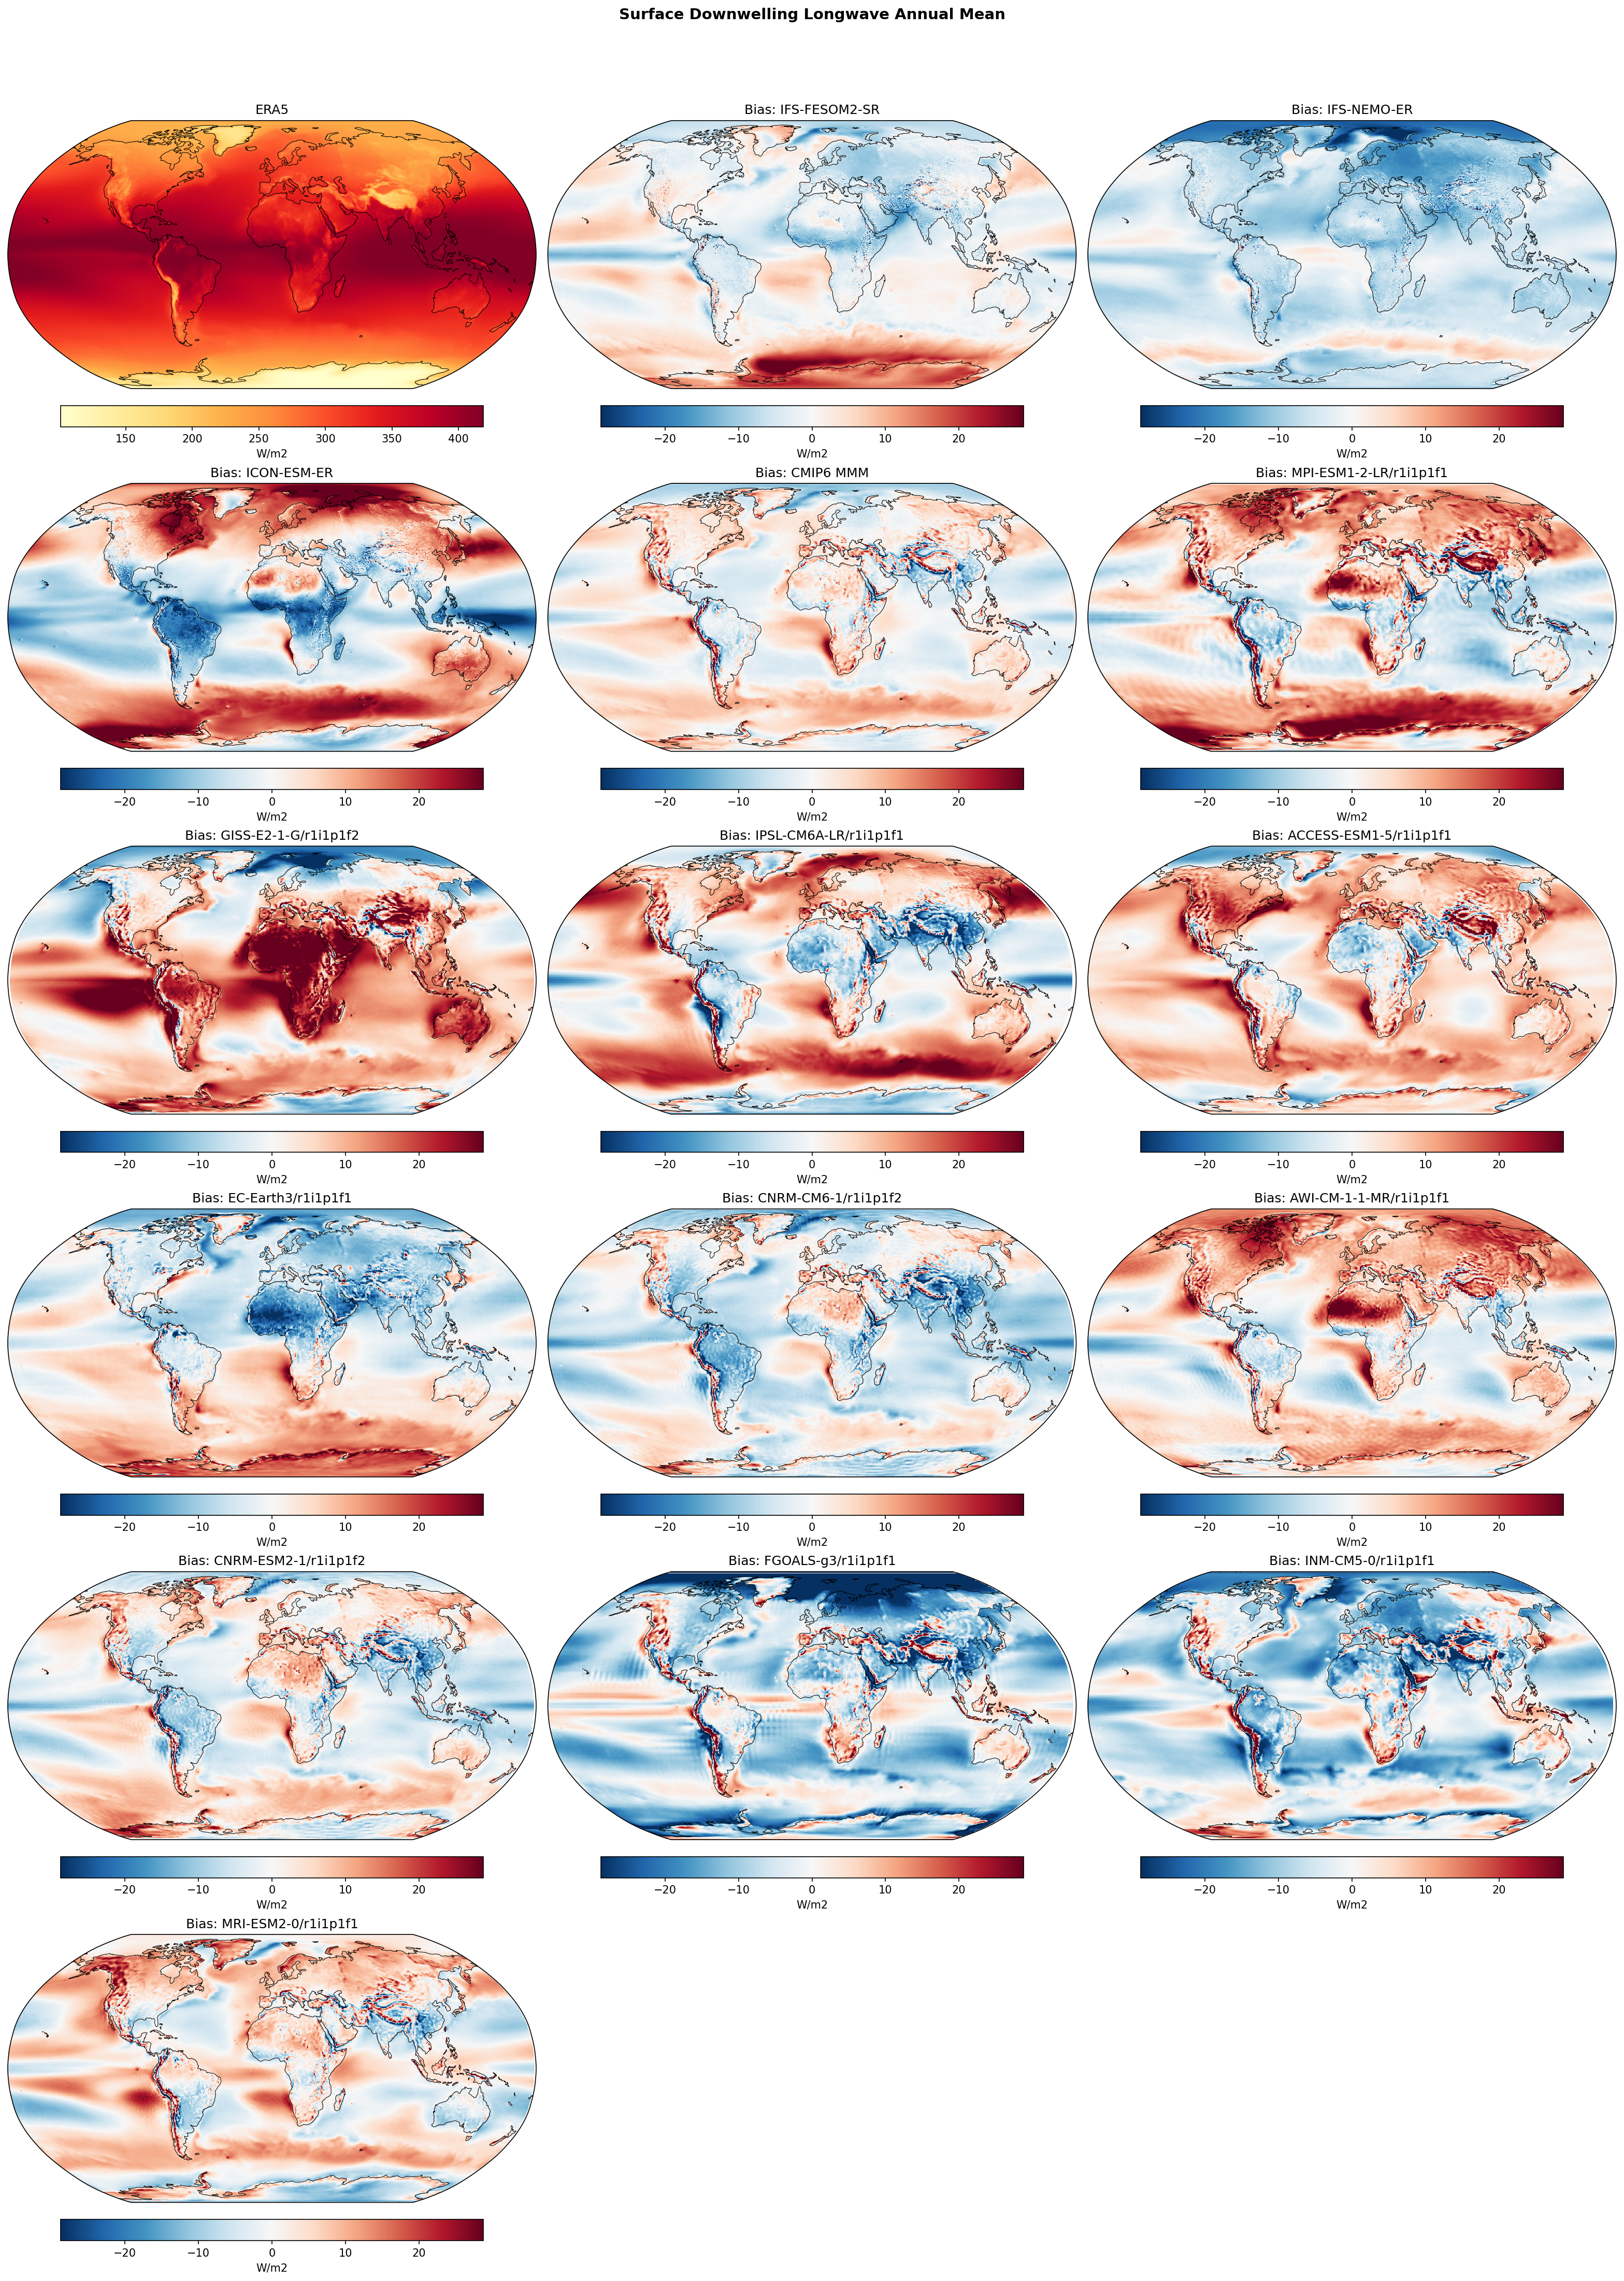
| IFS-FESOM2-SR | Global Mean Bias: 0.02 · Rmse: 6.70 |
| IFS-NEMO-ER | Global Mean Bias: -6.25 · Rmse: 8.20 |
| ICON-ESM-ER | Global Mean Bias: 1.38 · Rmse: 13.02 |
| CMIP6 MMM | Global Mean Bias: 1.23 · Rmse: 6.44 |
| MPI-ESM1-2-LR/r1i1p1f1 | Global Mean Bias: 3.94 · Rmse: 11.49 |
| GISS-E2-1-G/r1i1p1f2 | Global Mean Bias: 9.58 · Rmse: 15.66 |
| IPSL-CM6A-LR/r1i1p1f1 | Global Mean Bias: 4.04 · Rmse: 11.78 |
| ACCESS-ESM1-5/r1i1p1f1 | Global Mean Bias: 6.05 · Rmse: 10.28 |
| EC-Earth3/r1i1p1f1 | Global Mean Bias: -0.65 · Rmse: 9.22 |
| CNRM-CM6-1/r1i1p1f2 | Global Mean Bias: -3.47 · Rmse: 8.07 |
| AWI-CM-1-1-MR/r1i1p1f1 | Global Mean Bias: 3.82 · Rmse: 9.52 |
| CNRM-ESM2-1/r1i1p1f2 | Global Mean Bias: -0.10 · Rmse: 7.39 |
| FGOALS-g3/r1i1p1f1 | Global Mean Bias: -6.56 · Rmse: 12.81 |
| INM-CM5-0/r1i1p1f1 | Global Mean Bias: -5.62 · Rmse: 11.15 |
| MRI-ESM2-0/r1i1p1f1 | Global Mean Bias: 2.51 · Rmse: 8.12 |
Summary high
This figure evaluates annual mean Surface Downwelling Longwave Radiation (rlds) biases relative to ERA5 across three high-resolution EERIE models and the CMIP6 ensemble. IFS-FESOM2-SR demonstrates exceptional skill with negligible global mean bias, significantly outperforming IFS-NEMO-ER and ICON-ESM-ER, which show systematic negative biases and large regional compensating errors, respectively.
Key Findings
- IFS-FESOM2-SR achieves the best performance with a global mean bias of +0.02 W/m² and the lowest RMSE (6.7 W/m²), showing only minor positive biases over Antarctica.
- IFS-NEMO-ER exhibits a systematic global negative bias (-6.25 W/m²), indicating a general underestimation of atmospheric humidity or cloud radiative effects compared to its FESOM-coupled counterpart.
- ICON-ESM-ER displays large compensating regional biases (RMSE 13.0 W/m²), with strong negative biases in tropical convective regions (ITCZ/SPCZ) and strong positive biases in the Southern Ocean and polar regions.
- A widespread positive bias over Antarctica is present in most models (including CMIP6 MMM), suggesting common difficulties in simulating polar stable boundary layers.
Spatial Patterns
The CMIP6 MMM and ICON-ESM-ER show a distinct 'dipole' pattern with positive biases in high latitudes and negative biases in parts of the tropics/subtropics. GISS-E2-1-G is a notable outlier with severe positive bias globally (+9.6 W/m²). IFS-FESOM2-SR is spatially uniform with very low bias magnitude, while IFS-NEMO-ER is uniformly cool (blue).
Model Agreement
Inter-model agreement is low among the EERIE simulations; IFS-FESOM2-SR aligns closely with ERA5, whereas IFS-NEMO-ER and ICON-ESM-ER diverge significantly in opposite directions (systematic cool vs. regional dipoles).
Physical Interpretation
Downwelling longwave radiation is primarily driven by lower-tropospheric water vapor and cloud base temperatures. The negative bias in IFS-NEMO-ER suggests a drier planetary boundary layer or reduced low-cloud cover. The positive polar biases (seen in ICON and CMIP6) likely reflect excessive downward mixing in stable conditions or overactive cloud liquid phase (too emissive). The stark difference between IFS-FESOM and IFS-NEMO highlights the critical role of ocean-atmosphere coupling and SSTs in regulating boundary layer humidity.
Caveats
- ERA5 rlds is a model-generated reanalysis product, not direct observation, and may have its own biases particularly in data-sparse polar regions.
- Differences between IFS variants may stem from ocean resolution (SR vs ER) or tuning parameters rather than just the ocean model component (FESOM vs NEMO).
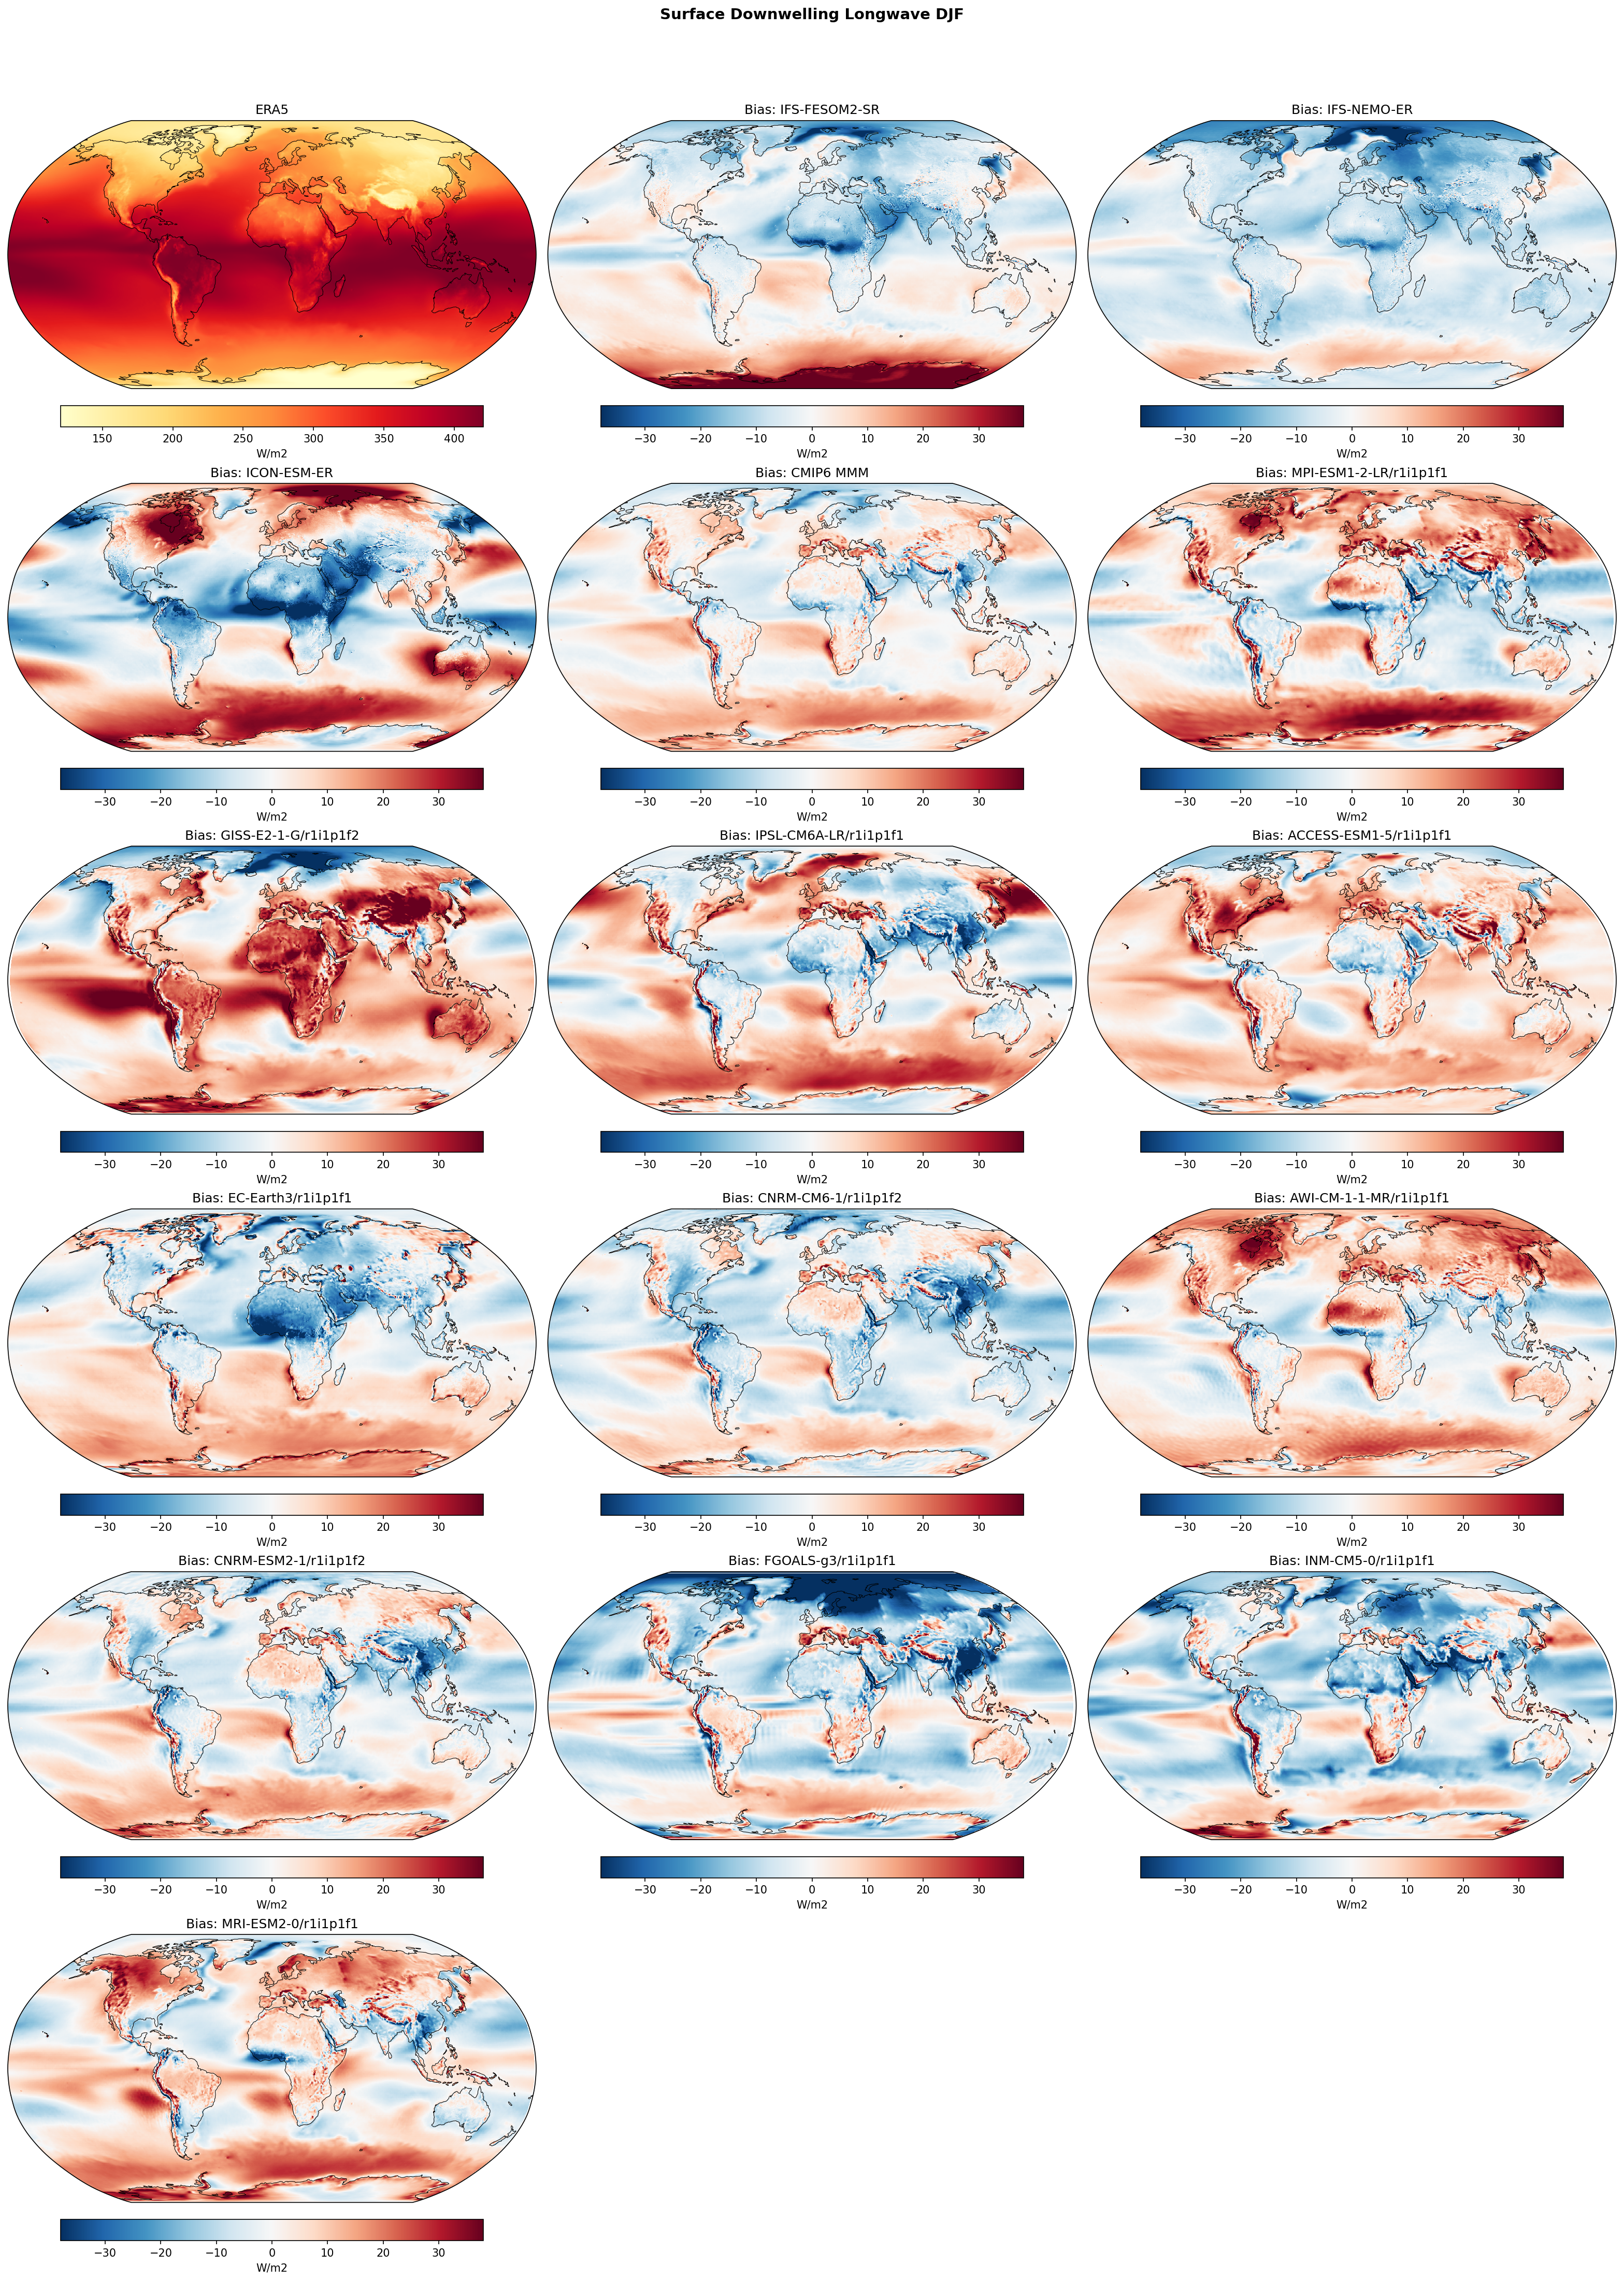
Surface Downwelling Longwave DJF Bias
| Variables | rlds |
|---|---|
| Models | IFS-FESOM2-SR, IFS-NEMO-ER, ICON-ESM-ER, CMIP6 MMM, MPI-ESM1-2-LR/r1i1p1f1, GISS-E2-1-G/r1i1p1f2, IPSL-CM6A-LR/r1i1p1f1, ACCESS-ESM1-5/r1i1p1f1, EC-Earth3/r1i1p1f1, CNRM-CM6-1/r1i1p1f2, AWI-CM-1-1-MR/r1i1p1f1, CNRM-ESM2-1/r1i1p1f2, FGOALS-g3/r1i1p1f1, INM-CM5-0/r1i1p1f1, MRI-ESM2-0/r1i1p1f1 |
| Reference Dataset | ERA5 |
| Units | W/m2 |
| Period | 1980–2014 |
| CMIP6 MMM | Global Mean Bias: 1.77 · Rmse: None |
| MPI-ESM1-2-LR/r1i1p1f1 | Global Mean Bias: 4.06 · Rmse: None |
| GISS-E2-1-G/r1i1p1f2 | Global Mean Bias: 11.30 · Rmse: None |
| IPSL-CM6A-LR/r1i1p1f1 | Global Mean Bias: 3.73 · Rmse: None |
| ACCESS-ESM1-5/r1i1p1f1 | Global Mean Bias: 6.34 · Rmse: None |
| EC-Earth3/r1i1p1f1 | Global Mean Bias: 0.14 · Rmse: None |
| CNRM-CM6-1/r1i1p1f2 | Global Mean Bias: -3.20 · Rmse: None |
| AWI-CM-1-1-MR/r1i1p1f1 | Global Mean Bias: 3.99 · Rmse: None |
| CNRM-ESM2-1/r1i1p1f2 | Global Mean Bias: 0.06 · Rmse: None |
| FGOALS-g3/r1i1p1f1 | Global Mean Bias: -5.69 · Rmse: None |
| INM-CM5-0/r1i1p1f1 | Global Mean Bias: -5.52 · Rmse: None |
| MRI-ESM2-0/r1i1p1f1 | Global Mean Bias: 4.33 · Rmse: None |
Summary high
This diagnostic evaluates DJF surface downwelling longwave radiation (rlds) biases in high-resolution EERIE models against ERA5, revealing significant regional systematic errors that differ between the IFS and ICON atmospheric cores.
Key Findings
- IFS-FESOM2-SR and IFS-NEMO-ER exhibit a strong hemispheric contrast: pervasive negative biases (insufficient downwelling LW) over Northern Hemisphere continents and oceans, and positive biases over the Southern Ocean and Antarctica.
- ICON-ESM-ER displays a distinct bias structure compared to IFS, with strong positive biases (>30 W/m²) in the high latitudes (Arctic, Antarctic, and storm tracks) and negative biases in the tropics.
- The Southern Ocean positive bias is a robust feature across almost all models shown, including the CMIP6 Multi-Model Mean, indicating a common difficulty in simulating the radiative properties of the marine boundary layer in this region.
- GISS-E2-1-G stands out with a massive global positive bias (~11.3 W/m² global mean), significantly warmer than the ensemble.
Spatial Patterns
The IFS models show a zonal 'blue North / red South' asymmetry in DJF. The negative bias is most pronounced over Eurasian and North American landmasses (winter hemisphere). ICON-ESM-ER shows a 'warm poles / cool tropics' radiative bias pattern. The CMIP6 MMM shows a smoother pattern with positive biases in the Arctic and Southern Ocean but weak negative biases in the tropical Pacific.
Model Agreement
There is near-perfect agreement between IFS-FESOM2-SR and IFS-NEMO-ER, confirming that the biases are driven by the common atmospheric component (OpenIFS) and cloud physics rather than the ocean model choice. The inter-model spread within CMIP6 is large, with models like GISS and ACCESS showing strong positive biases, while INM and FGOALS show widespread negative biases.
Physical Interpretation
Biases in rlds are primarily driven by errors in lower tropospheric temperature, humidity, and cloud base height/fraction. The IFS negative bias over NH winter continents suggests a cold lower atmosphere or a lack of insulating low-level clouds/water vapor, which would enhance surface cooling. The pervasive positive bias over the Southern Ocean suggests excessive emission from low clouds (too much liquid water or cloud fraction) or a warm boundary layer bias. ICON's tropical negative bias implies insufficient humidity or cloud radiative forcing in the ITCZ region.
Caveats
- ERA5 is a reanalysis product; while robust, it relies on its own model physics for radiative transfer in data-sparse regions like the Southern Ocean.
- The analysis is limited to DJF (boreal winter/austral summer); biases may shift seasonally.
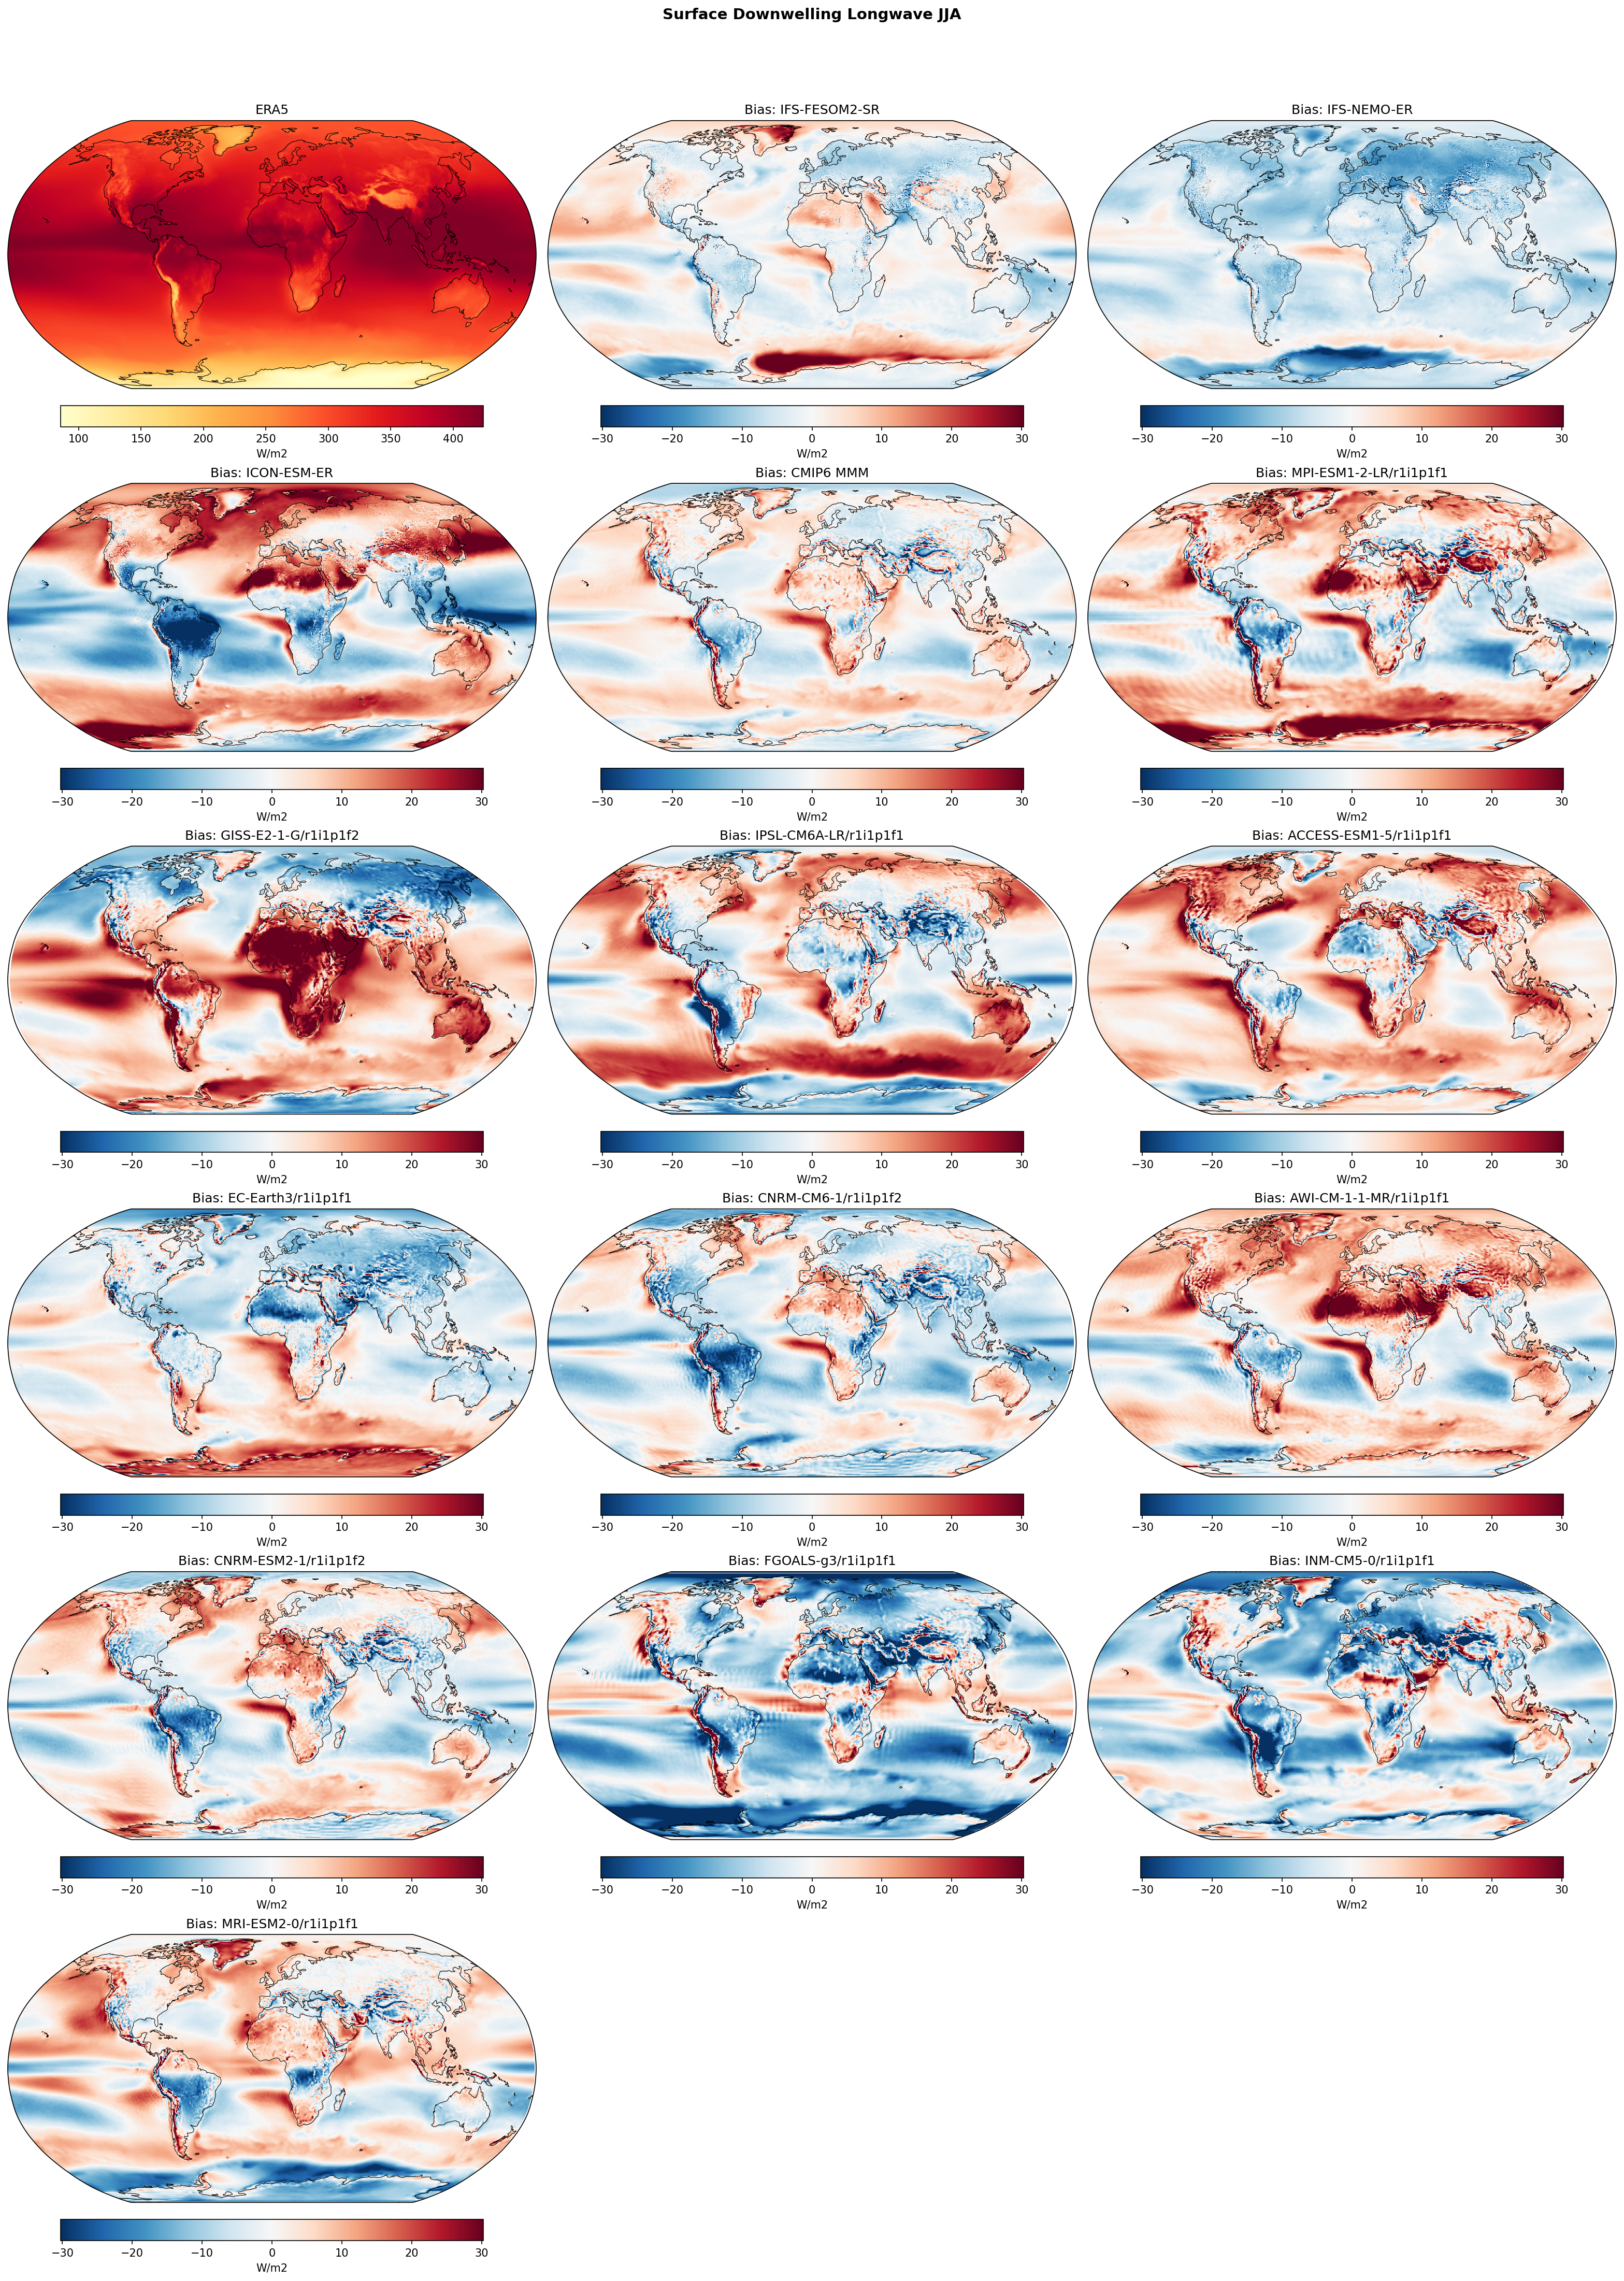
Surface Downwelling Longwave JJA Bias
| Variables | rlds |
|---|---|
| Models | IFS-FESOM2-SR, IFS-NEMO-ER, ICON-ESM-ER, CMIP6 MMM, MPI-ESM1-2-LR/r1i1p1f1, GISS-E2-1-G/r1i1p1f2, IPSL-CM6A-LR/r1i1p1f1, ACCESS-ESM1-5/r1i1p1f1, EC-Earth3/r1i1p1f1, CNRM-CM6-1/r1i1p1f2, AWI-CM-1-1-MR/r1i1p1f1, CNRM-ESM2-1/r1i1p1f2, FGOALS-g3/r1i1p1f1, INM-CM5-0/r1i1p1f1, MRI-ESM2-0/r1i1p1f1 |
| Reference Dataset | ERA5 |
| Units | W/m2 |
| Period | 1980–2014 |
| CMIP6 MMM | Global Mean Bias: 0.68 · Rmse: None |
| MPI-ESM1-2-LR/r1i1p1f1 | Global Mean Bias: 3.77 · Rmse: None |
| GISS-E2-1-G/r1i1p1f2 | Global Mean Bias: 7.37 · Rmse: None |
| IPSL-CM6A-LR/r1i1p1f1 | Global Mean Bias: 3.08 · Rmse: None |
| ACCESS-ESM1-5/r1i1p1f1 | Global Mean Bias: 5.78 · Rmse: None |
| EC-Earth3/r1i1p1f1 | Global Mean Bias: -1.00 · Rmse: None |
| CNRM-CM6-1/r1i1p1f2 | Global Mean Bias: -3.65 · Rmse: None |
| AWI-CM-1-1-MR/r1i1p1f1 | Global Mean Bias: 3.64 · Rmse: None |
| CNRM-ESM2-1/r1i1p1f2 | Global Mean Bias: -0.09 · Rmse: None |
| FGOALS-g3/r1i1p1f1 | Global Mean Bias: -7.16 · Rmse: None |
| INM-CM5-0/r1i1p1f1 | Global Mean Bias: -5.57 · Rmse: None |
| MRI-ESM2-0/r1i1p1f1 | Global Mean Bias: 1.40 · Rmse: None |
Summary high
This figure presents global bias maps of Surface Downwelling Longwave Radiation (RLDS) for the JJA season (1980–2014) relative to ERA5, comparing high-resolution EERIE models (IFS-FESOM2-SR, IFS-NEMO-ER, ICON-ESM-ER) against the CMIP6 ensemble. While EERIE models generally avoid the extreme systematic biases seen in some CMIP6 members, they exhibit distinct regional artifacts, particularly in the Southern Ocean and tropics.
Key Findings
- IFS-FESOM2-SR shows a striking, localized positive bias (>30 W/m²) in the Weddell Sea, likely indicating a failure in winter sea ice formation or excessive cloud cover in that specific sector.
- ICON-ESM-ER displays a strong zonal dipole in the tropics: negative biases in the convective ITCZ regions (suggesting underestimated cloud cover/humidity) and positive biases in the eastern subtropical ocean basins (suggesting overestimated stratocumulus radiative effects).
- CMIP6 models exhibit a wide range of systematic global biases, from strong positive (GISS-E2-1-G, +7.4 W/m²) to strong negative (FGOALS-g3, -7.2 W/m²), whereas IFS-NEMO-ER tends towards a moderate widespread negative bias over oceans.
Spatial Patterns
The Southern Ocean exhibits high variability in bias structure across models; for example, the strong positive anomaly in IFS-FESOM2-SR contrasts with the general negative bias in IFS-NEMO-ER. In the Northern Hemisphere (summer), widespread positive biases are common over the Arctic and continents in several CMIP6 models (e.g., ACCESS-ESM1-5, MPI-ESM1-2-LR). ICON-ESM-ER and several CMIP6 models show distinct 'double ITCZ' or zonal bias structures in the tropical Pacific.
Model Agreement
Agreement is generally low in the Southern Ocean and tropical convective zones, where cloud radiative effects are difficult to parameterize. There is better agreement over NH mid-latitude oceans where biases are typically smaller (+/- 10 W/m²) for the higher-resolution models. The EERIE models resolve topographic features (Andes, Himalayas) more sharply than the coarser CMIP6 models.
Physical Interpretation
RLDS biases are primarily driven by errors in cloud cover fraction, optical depth, and lower tropospheric water vapor. The positive Weddell Sea bias in IFS-FESOM2-SR during austral winter suggests missing sea ice, which would expose the relatively warm ocean to the atmosphere, enhancing moisture fluxes and cloud formation (increasing downwelling LW). Conversely, the negative tropical biases in ICON-ESM-ER suggest a lack of deep convective clouds or insufficient humidity in the ITCZ compared to ERA5.
Caveats
- ERA5 is a reanalysis product; biases in data-sparse regions like the Southern Ocean may partly reflect reanalysis uncertainties.
- The analysis is for JJA only, representing summer in the NH and winter in the SH, which influences the dominant physical processes (e.g., sea ice melt vs. formation).
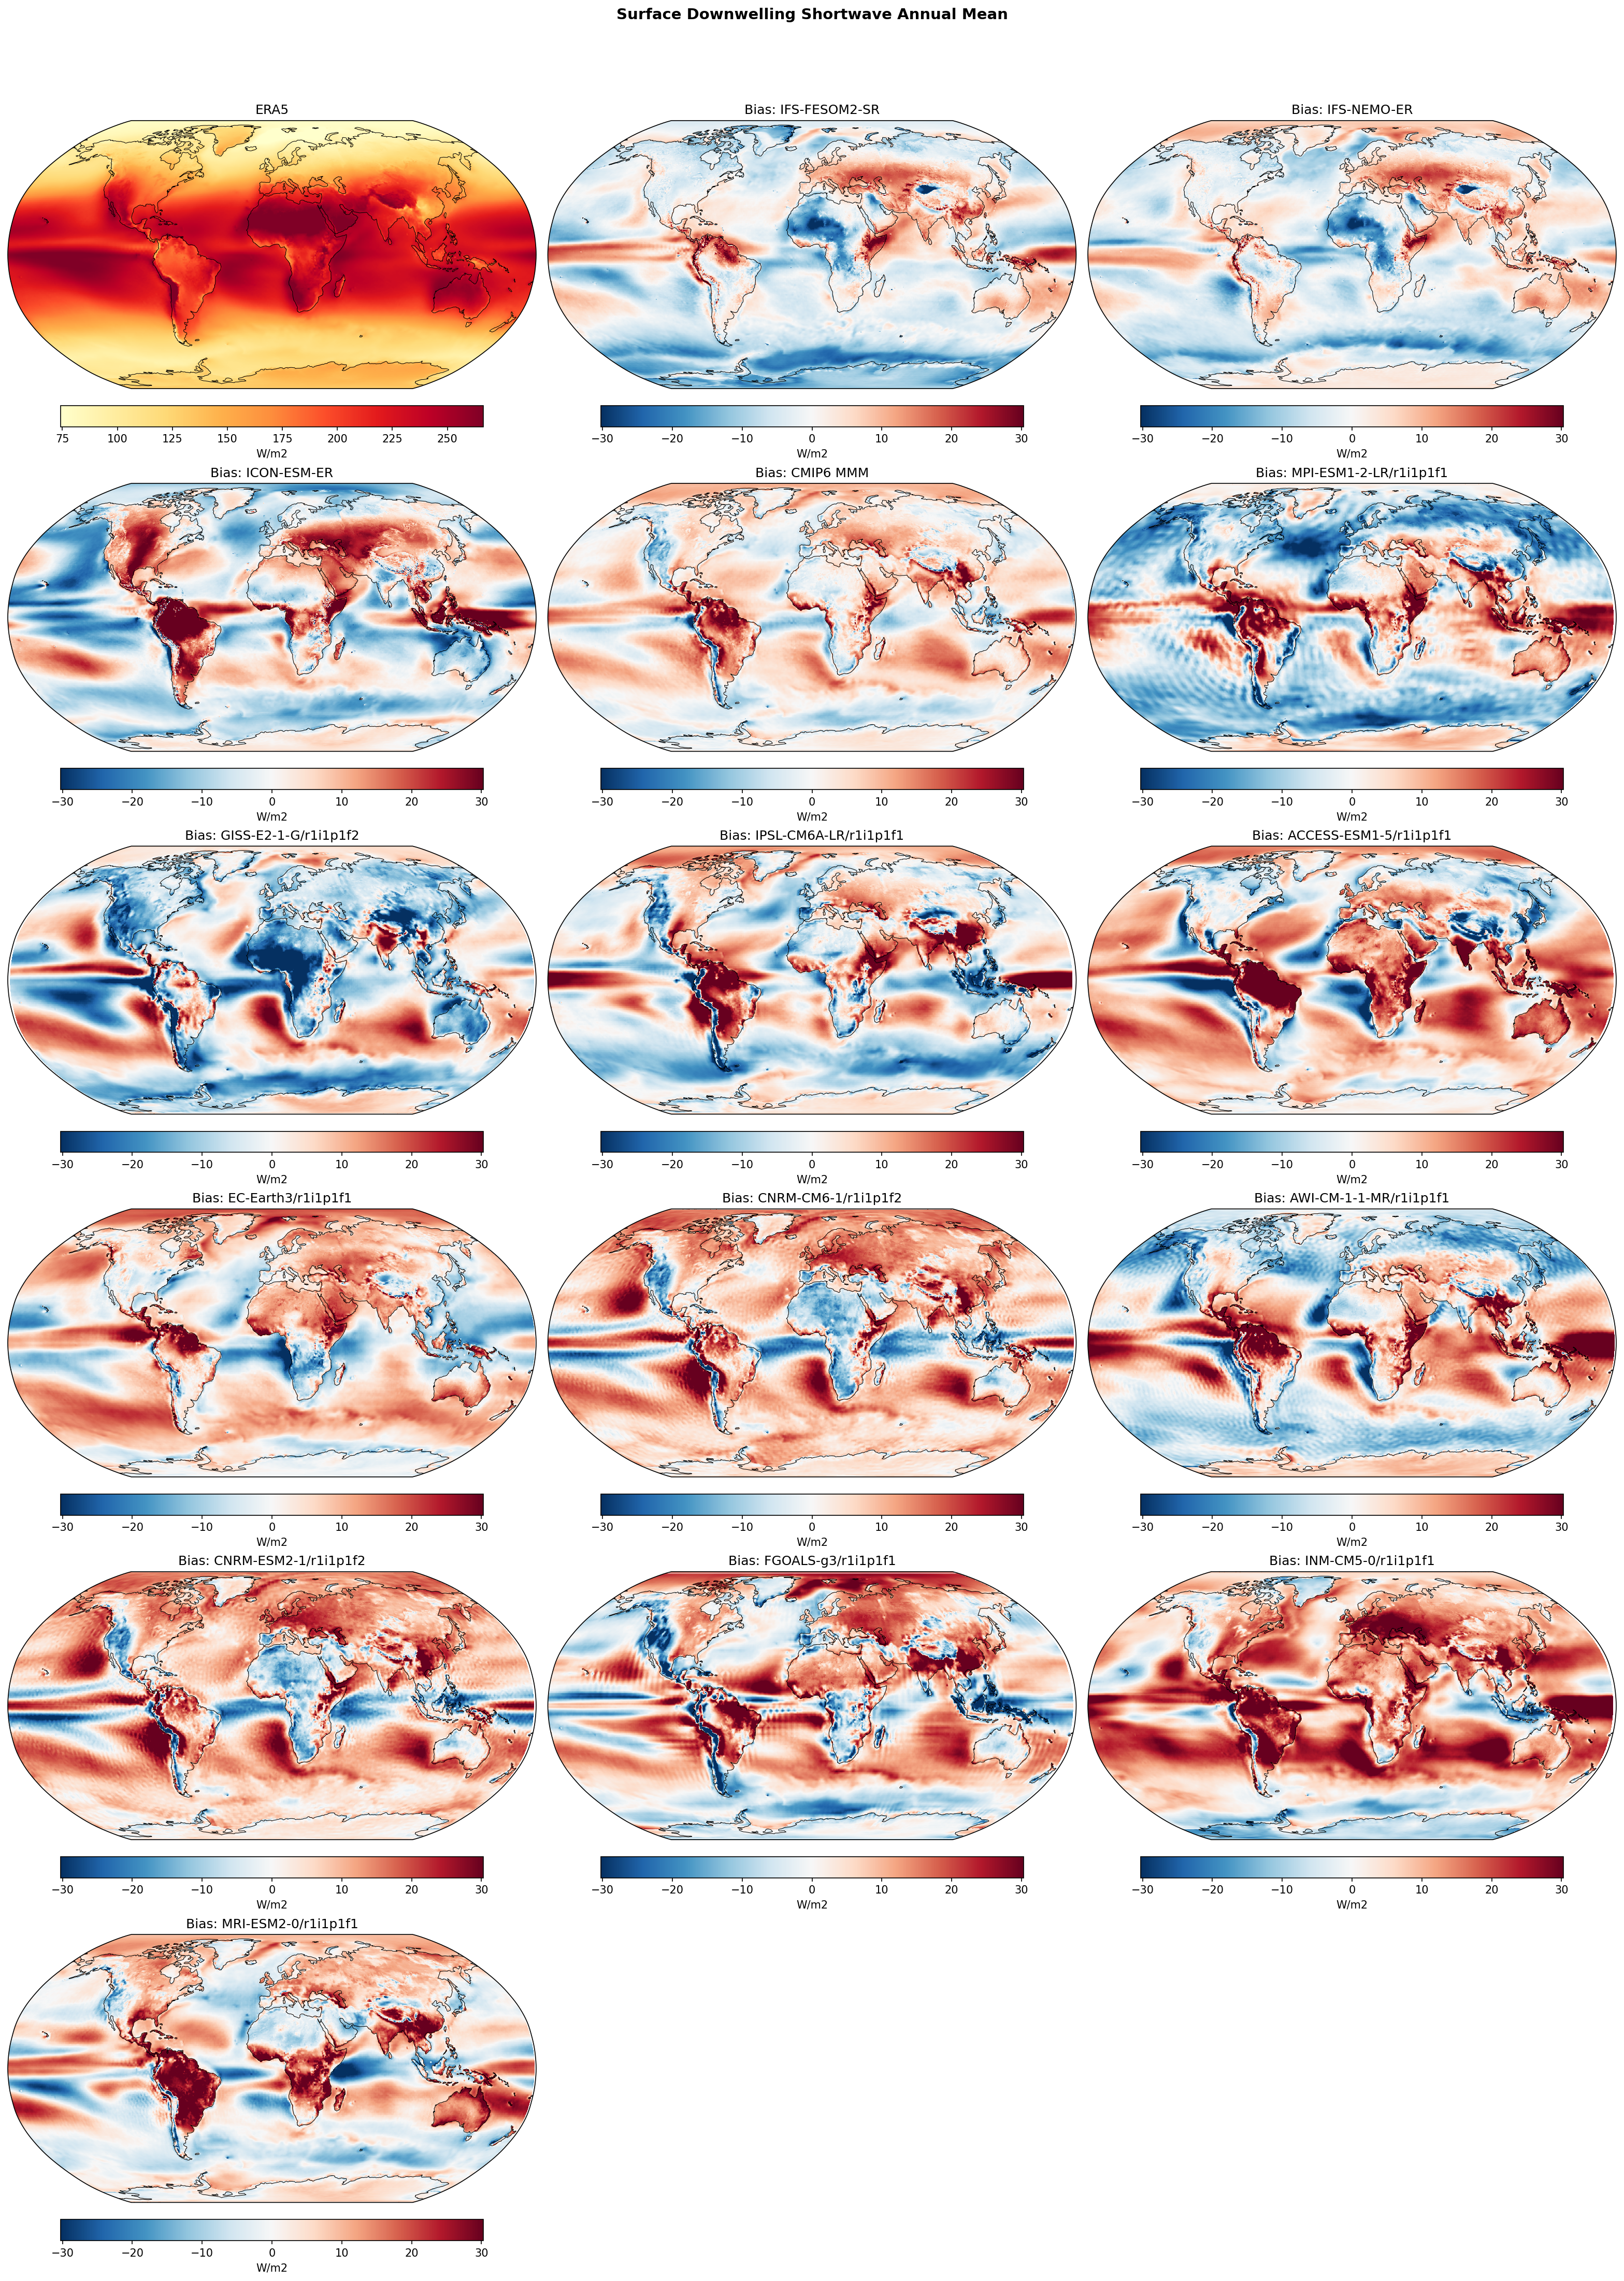
Surface Downwelling Shortwave Annual Mean Bias
| Variables | rsds |
|---|---|
| Models | IFS-FESOM2-SR, IFS-NEMO-ER, ICON-ESM-ER, CMIP6 MMM, MPI-ESM1-2-LR/r1i1p1f1, GISS-E2-1-G/r1i1p1f2, IPSL-CM6A-LR/r1i1p1f1, ACCESS-ESM1-5/r1i1p1f1, EC-Earth3/r1i1p1f1, CNRM-CM6-1/r1i1p1f2, AWI-CM-1-1-MR/r1i1p1f1, CNRM-ESM2-1/r1i1p1f2, FGOALS-g3/r1i1p1f1, INM-CM5-0/r1i1p1f1, MRI-ESM2-0/r1i1p1f1 |
| Reference Dataset | ERA5 |
| Units | W/m2 |
| Period | 1980–2014 |
| IFS-FESOM2-SR | Global Mean Bias: -1.27 · Rmse: 9.31 |
| IFS-NEMO-ER | Global Mean Bias: -1.00 · Rmse: 8.28 |
| ICON-ESM-ER | Global Mean Bias: 1.03 · Rmse: 14.27 |
| CMIP6 MMM | Global Mean Bias: 3.72 · Rmse: 9.01 |
| MPI-ESM1-2-LR/r1i1p1f1 | Global Mean Bias: -1.43 · Rmse: 14.22 |
| GISS-E2-1-G/r1i1p1f2 | Global Mean Bias: -3.52 · Rmse: 14.65 |
| IPSL-CM6A-LR/r1i1p1f1 | Global Mean Bias: 0.96 · Rmse: 13.86 |
| ACCESS-ESM1-5/r1i1p1f1 | Global Mean Bias: 6.55 · Rmse: 15.60 |
| EC-Earth3/r1i1p1f1 | Global Mean Bias: 3.78 · Rmse: 11.24 |
| CNRM-CM6-1/r1i1p1f2 | Global Mean Bias: 6.26 · Rmse: 13.14 |
| AWI-CM-1-1-MR/r1i1p1f1 | Global Mean Bias: 2.45 · Rmse: 14.07 |
| CNRM-ESM2-1/r1i1p1f2 | Global Mean Bias: 6.87 · Rmse: 13.66 |
| FGOALS-g3/r1i1p1f1 | Global Mean Bias: 4.11 · Rmse: 14.35 |
| INM-CM5-0/r1i1p1f1 | Global Mean Bias: 11.11 · Rmse: 16.92 |
| MRI-ESM2-0/r1i1p1f1 | Global Mean Bias: 3.73 · Rmse: 12.29 |
Summary high
This figure evaluates annual mean surface downwelling shortwave radiation (RSDS) biases in high-resolution EERIE models and CMIP6 models relative to ERA5. The IFS-based high-resolution models demonstrate superior global skill (lowest RMSE) but exhibit distinct regional biases compared to ICON and standard CMIP6 models.
Key Findings
- IFS-NEMO-ER and IFS-FESOM2-SR achieve the lowest RMSE (~8.3 and 9.3 W/m²) among individual models, significantly outperforming ICON-ESM-ER (~14.3 W/m²) and most CMIP6 models.
- A systematic positive bias (excessive insolation) persists across nearly all models, including high-resolution ones, in eastern boundary upwelling regions (e.g., off Peru, Namibia, California), indicating a universal struggle to resolve marine stratocumulus decks.
- There is a sharp divergence in Southern Ocean biases: IFS models show a negative bias (too dim/cloudy), whereas ICON-ESM-ER and the majority of CMIP6 models show a strong positive bias (too bright/clear).
Spatial Patterns
The IFS models (FESOM and NEMO) display widespread weak negative biases (-10 to -20 W/m²) over the Southern Ocean and Northern Hemisphere storm tracks. In contrast, ICON-ESM-ER and models like ACCESS-ESM1-5 and CNRM-CM6-1 exhibit strong positive biases (+20 to +30 W/m²) in these regions. Over tropical land masses (e.g., Amazon, Central Africa), models like ACCESS and CNRM show strong positive biases, suggesting potential deficiencies in convective cloud cover, whereas IFS biases are more mixed and smaller in magnitude.
Model Agreement
Agreement is high regarding the sign of errors in the stratocumulus regions (all positive), but low regarding the Southern Ocean, where models split into two camps (negative vs. positive bias). The IFS-NEMO-ER and IFS-FESOM2-SR are strikingly similar to each other, indicating that the atmospheric component (IFS) dictates the radiation errors more than the chosen ocean model (NEMO vs. FESOM).
Physical Interpretation
The biases are primarily driven by cloud radiative effect errors. The positive bias in upwelling zones reflects the 'too few/too optically thin' low-cloud bias common in climate models. The Southern Ocean divergence likely stems from cloud phase parameterization: the 'too bright' models (ICON, CMIP6) likely underestimate supercooled liquid water (optical thickness), while the 'too dim' IFS models may have over-corrected this, producing overly reflective clouds. The superior RMSE of IFS models may be partially influenced by their shared lineage with the ERA5 reanalysis system.
Caveats
- The reference dataset is ERA5, which uses a version of the IFS model physics; this may artificially favor IFS-based simulations due to shared parameterization characteristics compared to completely independent models like ICON or CMIP6.
- Surface downwelling SW is a model-derived product in ERA5, not a direct observation, making it less independent than CERES satellite data.
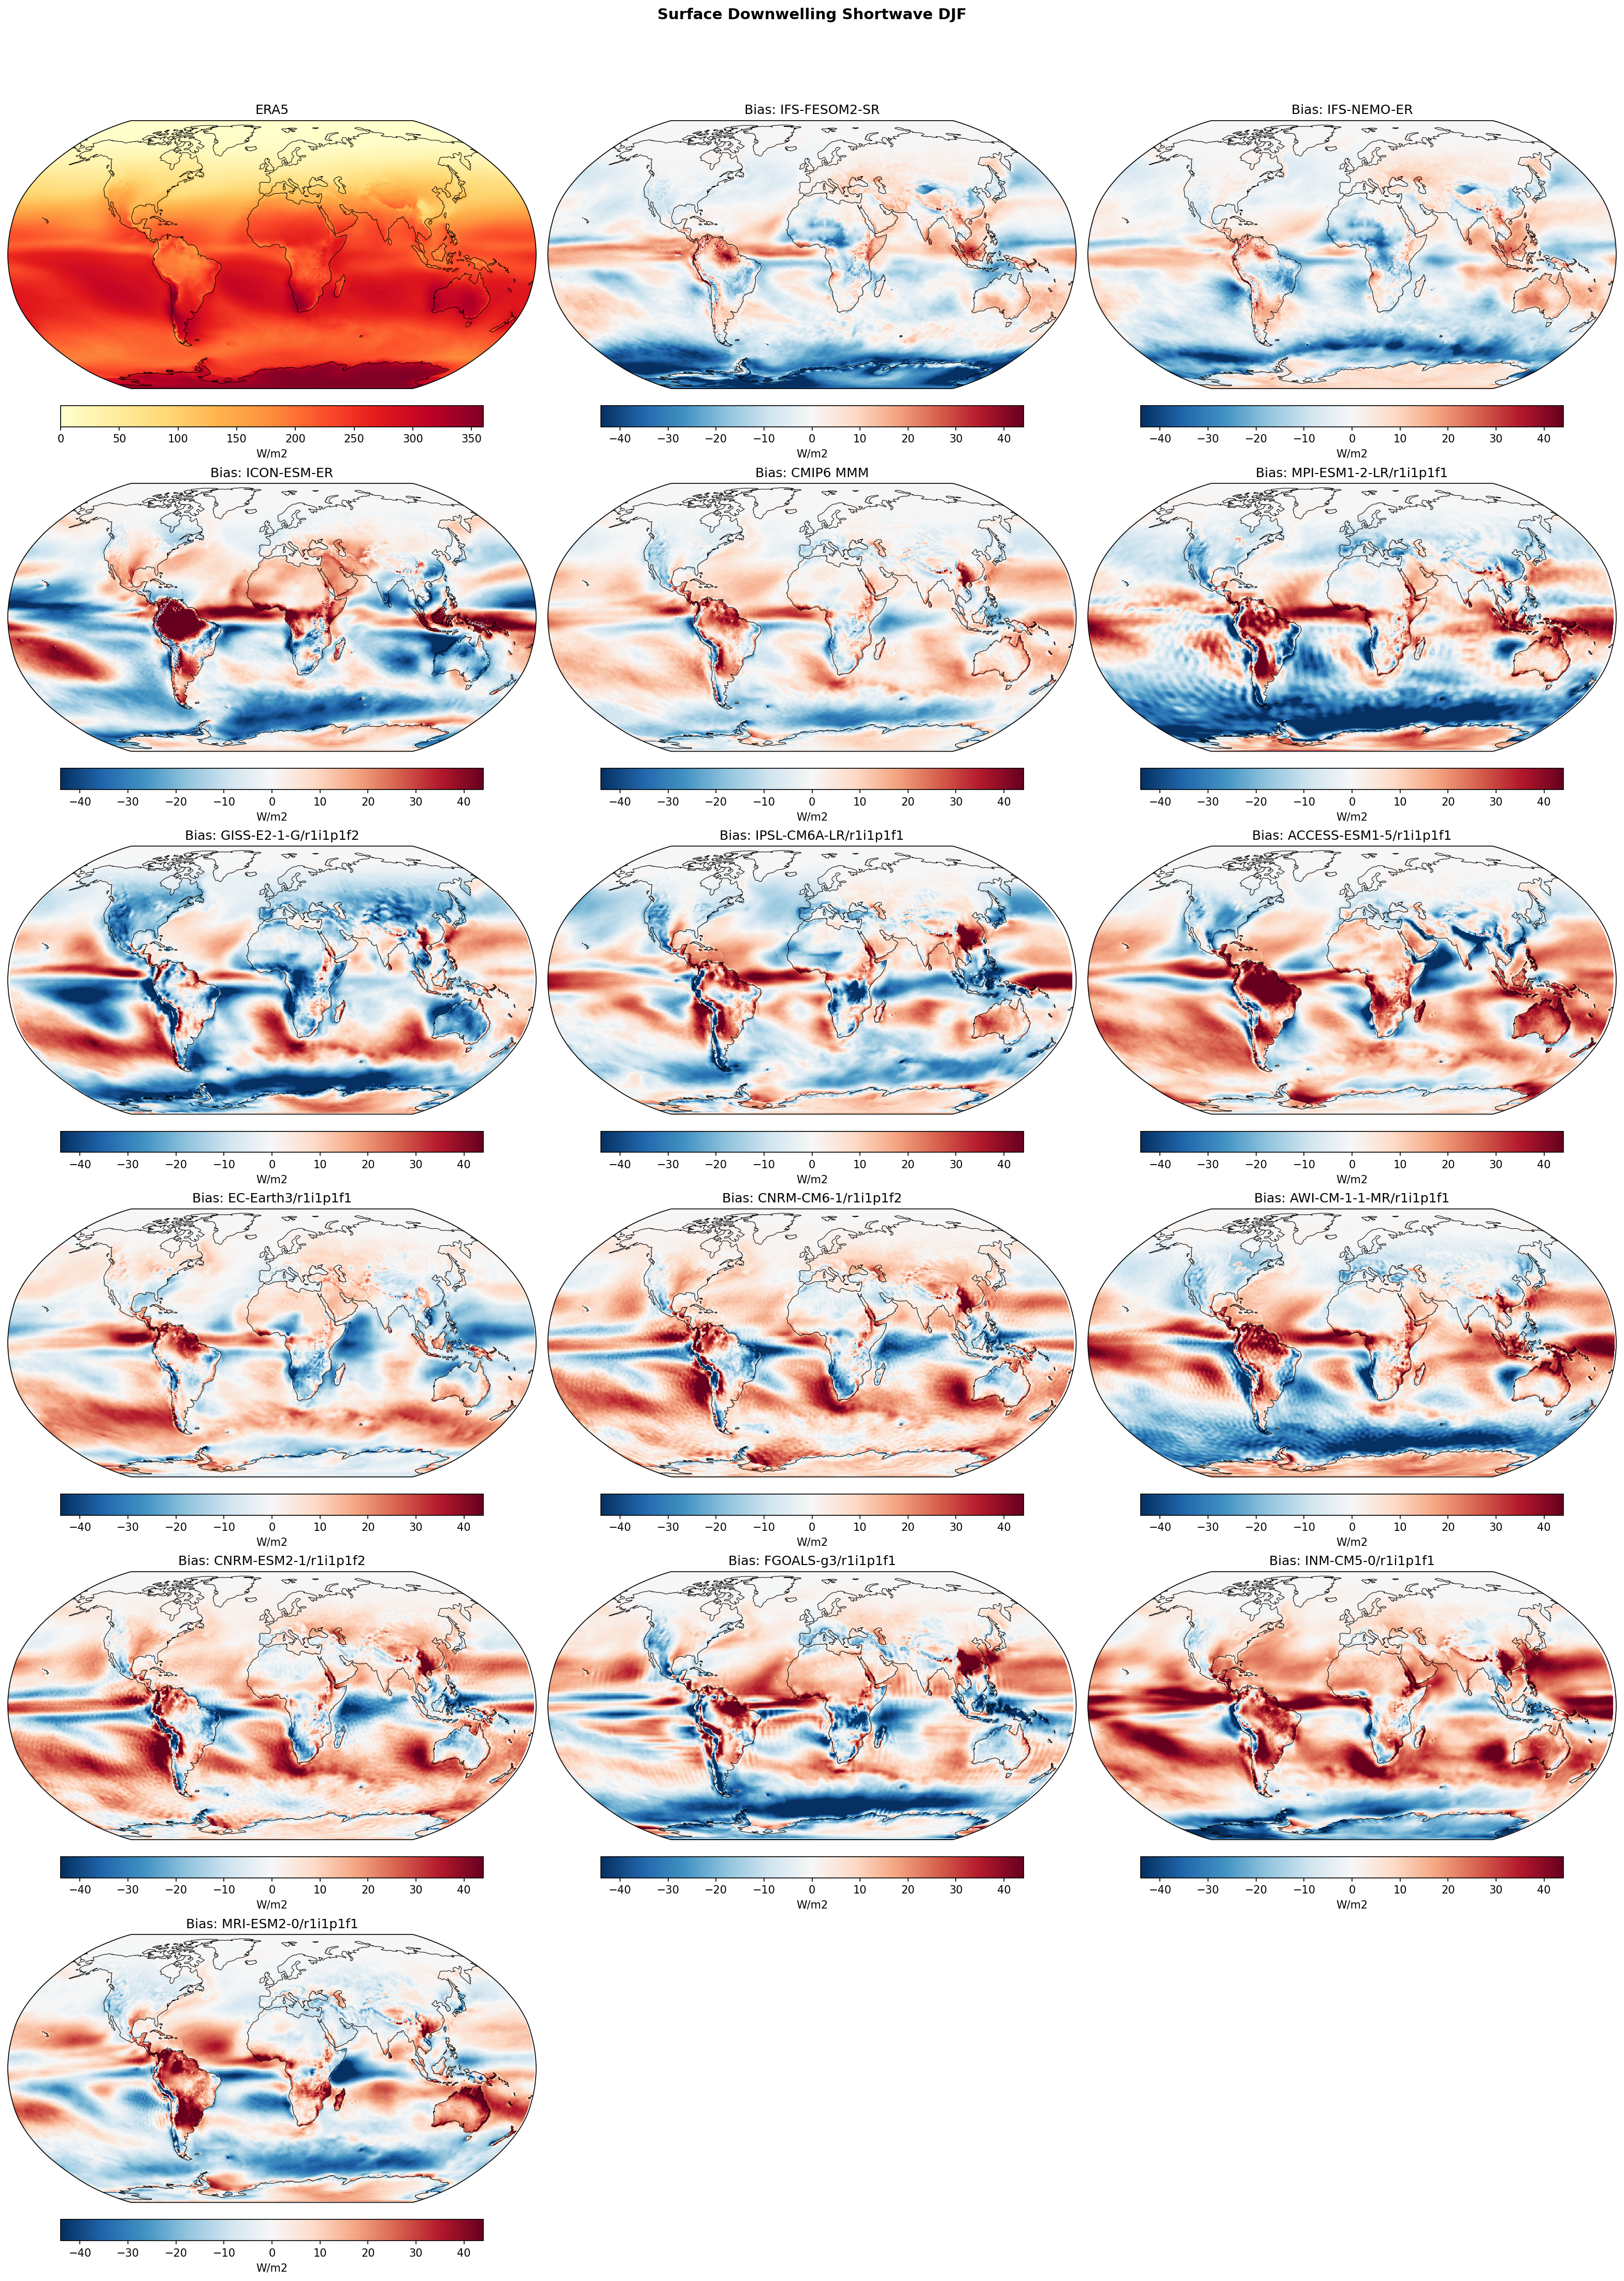
Surface Downwelling Shortwave DJF Bias
| Variables | rsds |
|---|---|
| Models | IFS-FESOM2-SR, IFS-NEMO-ER, ICON-ESM-ER, CMIP6 MMM, MPI-ESM1-2-LR/r1i1p1f1, GISS-E2-1-G/r1i1p1f2, IPSL-CM6A-LR/r1i1p1f1, ACCESS-ESM1-5/r1i1p1f1, EC-Earth3/r1i1p1f1, CNRM-CM6-1/r1i1p1f2, AWI-CM-1-1-MR/r1i1p1f1, CNRM-ESM2-1/r1i1p1f2, FGOALS-g3/r1i1p1f1, INM-CM5-0/r1i1p1f1, MRI-ESM2-0/r1i1p1f1 |
| Reference Dataset | ERA5 |
| Units | W/m2 |
| Period | 1980–2014 |
| CMIP6 MMM | Global Mean Bias: 2.26 · Rmse: None |
| MPI-ESM1-2-LR/r1i1p1f1 | Global Mean Bias: -2.58 · Rmse: None |
| GISS-E2-1-G/r1i1p1f2 | Global Mean Bias: -4.29 · Rmse: None |
| IPSL-CM6A-LR/r1i1p1f1 | Global Mean Bias: -0.30 · Rmse: None |
| ACCESS-ESM1-5/r1i1p1f1 | Global Mean Bias: 6.28 · Rmse: None |
| EC-Earth3/r1i1p1f1 | Global Mean Bias: 1.81 · Rmse: None |
| CNRM-CM6-1/r1i1p1f2 | Global Mean Bias: 5.70 · Rmse: None |
| AWI-CM-1-1-MR/r1i1p1f1 | Global Mean Bias: 1.05 · Rmse: None |
| CNRM-ESM2-1/r1i1p1f2 | Global Mean Bias: 6.07 · Rmse: None |
| FGOALS-g3/r1i1p1f1 | Global Mean Bias: 0.15 · Rmse: None |
| INM-CM5-0/r1i1p1f1 | Global Mean Bias: 10.30 · Rmse: None |
| MRI-ESM2-0/r1i1p1f1 | Global Mean Bias: 0.67 · Rmse: None |
Summary high
This figure evaluates climatological biases in December-January-February (DJF) surface downwelling shortwave radiation (RSDS) for high-resolution EERIE models (IFS, ICON) and a suite of CMIP6 models against ERA5 reanalysis. The analysis reveals significant systematic errors driven by cloud radiative effects, particularly over the Southern Ocean, eastern subtropical oceans, and the Amazon basin.
Key Findings
- IFS-FESOM2-SR and IFS-NEMO-ER display nearly identical patterns, dominated by strong negative biases (> -30 W/m²) over the Southern Ocean storm tracks and positive biases in eastern subtropical marine stratocumulus regions.
- ICON-ESM-ER exhibits a severe positive bias over the Amazon basin, indicating a substantial deficit in cloud cover during the South American monsoon season, a feature shared with ACCESS-ESM1-5 but absent in the IFS models.
- There is a notable bifurcation in Southern Ocean biases: IFS variants and MPI-ESM show negative biases (too much cloud reflection), whereas CNRM, ACCESS, and INM models show strong positive biases (insufficient cloud reflection).
- Systematic positive biases off the west coasts of South America and Africa (Peruvian and Benguela upwelling zones) are ubiquitous across both high-resolution and CMIP6 models, reflecting a persistent difficulty in resolving marine stratocumulus decks.
Spatial Patterns
The Southern Hemisphere (summer) dominates the signal. Zonal bands of bias characterize the Southern Ocean. The classic 'too few stratocumulus' bias appears as intense red patches off the coasts of Chile/Peru and Namibia/Angola. In the tropics, the ITCZ region shows mixed biases, while the Amazon stands out as a region of strong divergence, with ICON showing deep red (positive bias) compared to the mixed/blue signal in IFS models.
Model Agreement
IFS-FESOM2-SR and IFS-NEMO-ER show extremely high agreement, confirming that the atmospheric component (IFS) dictates surface radiation biases regardless of the ocean coupling. Inter-model agreement is high regarding the sign of stratocumulus biases (positive) but low regarding the Southern Ocean, where models split between positive and negative biases. The CMIP6 MMM masks these opposing Southern Ocean errors, resulting in a weaker bias signal than individual models.
Physical Interpretation
Surface shortwave biases are primarily proxies for cloud simulation errors. Positive biases (red) indicate insufficient cloud fraction or optical thickness, allowing too much solar radiation to reach the surface; this is evident in the stratocumulus decks and, for ICON, the Amazon deep convection zone. Negative biases (blue) imply excessive cloud shielding, seen in the IFS Southern Ocean simulation. This suggests IFS may suffer from the 'too bright' low-cloud bias often linked to phase-partitioning issues in supercooled liquid clouds, while ICON struggles with convective cloud generation over tropical land.
Caveats
- Biases are calculated relative to ERA5 reanalysis, which is model-based; comparisons against direct satellite products (e.g., CERES EBAF) would provide a strictly observational baseline.
- The analysis is limited to DJF; seasonal shifts in the ITCZ and sea ice extent will alter these bias patterns in other months.
Surface Downwelling Shortwave JJA Bias
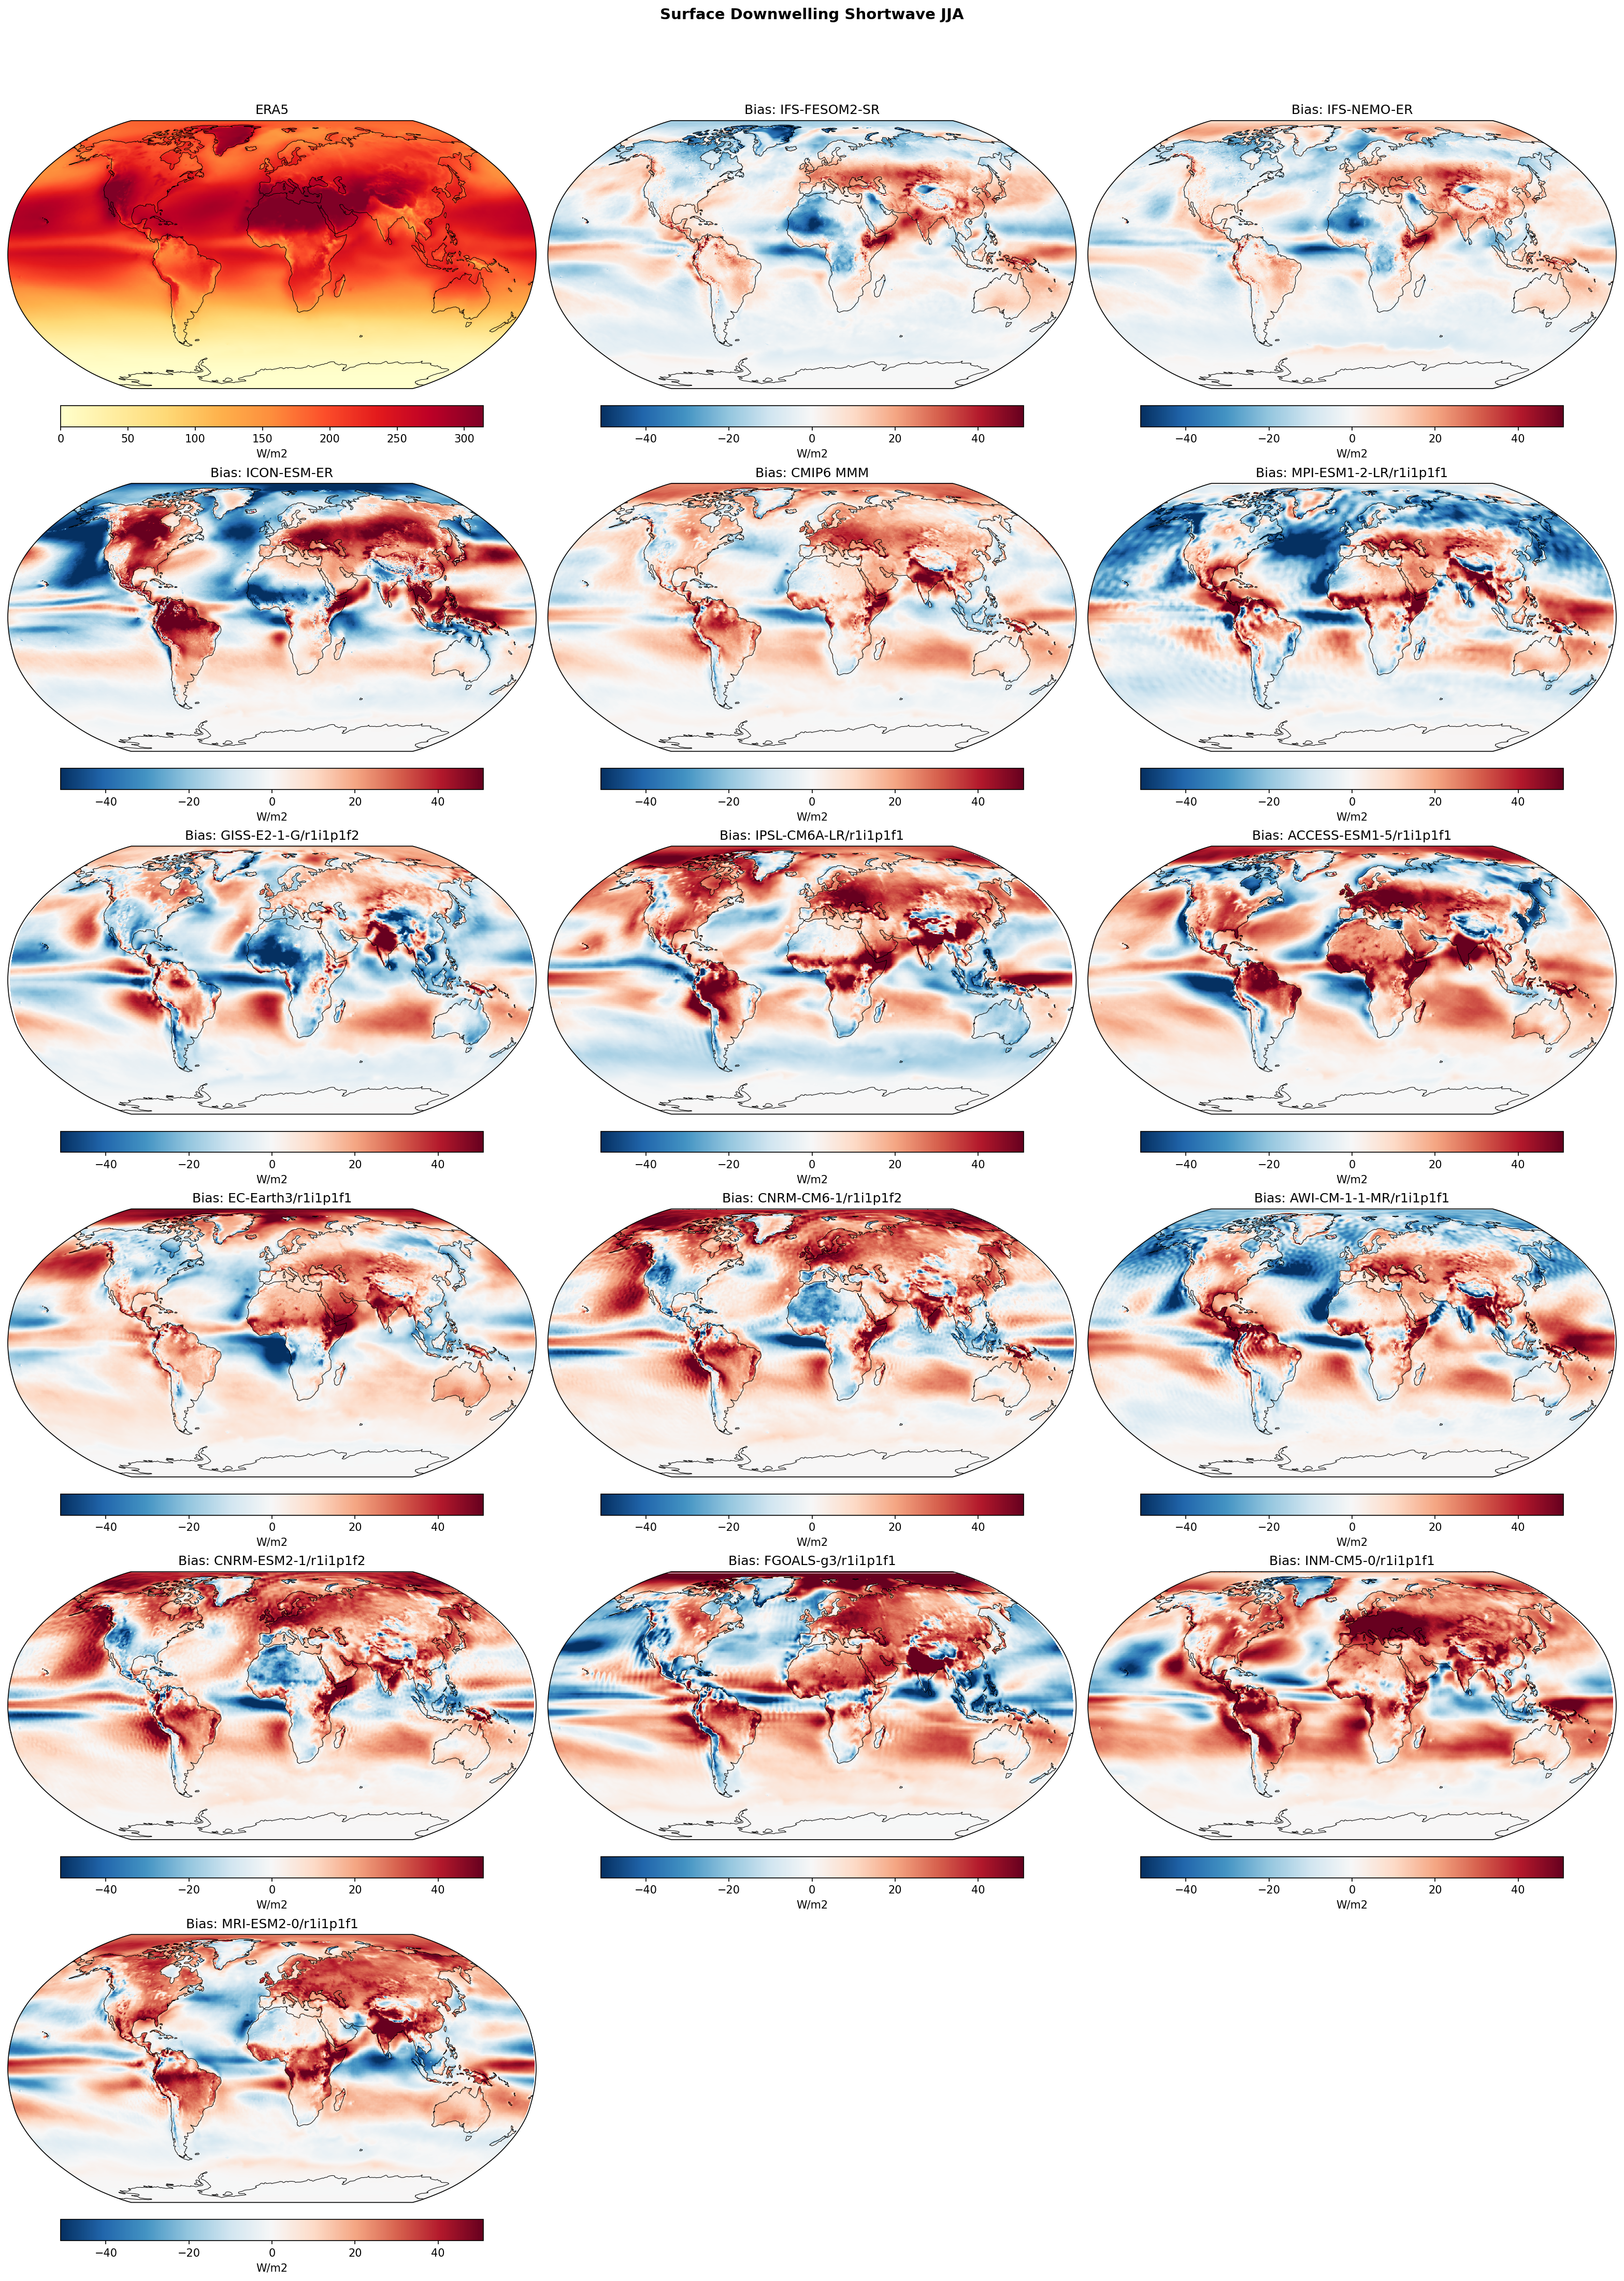
| Variables | rsds |
|---|---|
| Models | IFS-FESOM2-SR, IFS-NEMO-ER, ICON-ESM-ER, CMIP6 MMM, MPI-ESM1-2-LR/r1i1p1f1, GISS-E2-1-G/r1i1p1f2, IPSL-CM6A-LR/r1i1p1f1, ACCESS-ESM1-5/r1i1p1f1, EC-Earth3/r1i1p1f1, CNRM-CM6-1/r1i1p1f2, AWI-CM-1-1-MR/r1i1p1f1, CNRM-ESM2-1/r1i1p1f2, FGOALS-g3/r1i1p1f1, INM-CM5-0/r1i1p1f1, MRI-ESM2-0/r1i1p1f1 |
| Reference Dataset | ERA5 |
| Units | W/m2 |
| Period | 1980–2014 |
| CMIP6 MMM | Global Mean Bias: 5.48 · Rmse: None |
| MPI-ESM1-2-LR/r1i1p1f1 | Global Mean Bias: -1.46 · Rmse: None |
| GISS-E2-1-G/r1i1p1f2 | Global Mean Bias: -0.89 · Rmse: None |
| IPSL-CM6A-LR/r1i1p1f1 | Global Mean Bias: 5.65 · Rmse: None |
| ACCESS-ESM1-5/r1i1p1f1 | Global Mean Bias: 8.09 · Rmse: None |
| EC-Earth3/r1i1p1f1 | Global Mean Bias: 4.79 · Rmse: None |
| CNRM-CM6-1/r1i1p1f2 | Global Mean Bias: 7.64 · Rmse: None |
| AWI-CM-1-1-MR/r1i1p1f1 | Global Mean Bias: 3.05 · Rmse: None |
| CNRM-ESM2-1/r1i1p1f2 | Global Mean Bias: 8.73 · Rmse: None |
| FGOALS-g3/r1i1p1f1 | Global Mean Bias: 6.07 · Rmse: None |
| INM-CM5-0/r1i1p1f1 | Global Mean Bias: 12.44 · Rmse: None |
| MRI-ESM2-0/r1i1p1f1 | Global Mean Bias: 6.28 · Rmse: None |
Summary high
This figure evaluates JJA Surface Downwelling Shortwave (RSDS) radiation biases in high-resolution EERIE models (IFS, ICON) and CMIP6 models against ERA5. The analysis reveals systematic errors in cloud radiative effects, with distinct differences between the IFS and ICON atmospheric formulations.
Key Findings
- **Southern Ocean Excess:** Almost all models, including IFS-FESOM2-SR, IFS-NEMO-ER, and ICON-ESM-ER, show widespread positive biases (20–40 W/m²) over the Southern Ocean (30°S–60°S), indicating a persistent underestimation of cloud cover or optical depth during the austral winter.
- **ICON Continental Bias:** ICON-ESM-ER exhibits a distinct, strong positive bias (>40 W/m²) over Northern Hemisphere landmasses (North America, Eurasia) and the Arctic, suggesting a significant deficit in summer cloud cover compared to the IFS models which have mixed or smaller biases in these regions.
- **Tropical Shielding:** IFS models display prominent negative biases (-20 to -40 W/m²) along the ITCZ and SPCZ, implying excessive reflection/absorption by convective clouds (too optically thick or too frequent) preventing solar radiation from reaching the surface.
- **Stratocumulus Regions:** The classic positive bias in eastern boundary upwelling zones (off Peru/Chile, Namibia/Angola) due to underestimated stratocumulus decks is visible in the CMIP6 MMM but appears somewhat reduced or spatially confined in the high-resolution IFS models.
Spatial Patterns
IFS models show a zonal structure with negative biases in the deep tropics and positive biases in the mid-latitudes. ICON-ESM-ER shows a strong land-sea contrast in the Northern Hemisphere, with land areas receiving significantly excess solar radiation. The CMIP6 MMM highlights systematic positive biases in the Southern Ocean and stratocumulus decks.
Model Agreement
IFS-FESOM2-SR and IFS-NEMO-ER show very high agreement, indicating that the atmospheric component (OpenIFS) determines the SW radiation biases regardless of the ocean coupling. ICON-ESM-ER diverges significantly from the IFS models over NH land. Among CMIP6, INM-CM5-0 is an outlier with extreme positive global biases (>12 W/m² mean), while MPI-ESM1-2-LR tends towards negative biases.
Physical Interpretation
Positive surface SW biases are physically driven by insufficient cloud blocking (low cloud fraction, low liquid water path, or aerosol deficiencies). The Southern Ocean bias is a known issue related to mixed-phase cloud parameterisation. The intense positive bias in ICON over NH land implies a 'hot summer' bias driven by lack of cloud shading. Negative tropical biases suggest deep convective clouds are too reflective.
Caveats
- ERA5 is used as the reference; while generally reliable, CERES-EBAF is the observational standard for radiation budget analysis.
- JJA represents winter in the Southern Hemisphere; biases poleward of 60°S are limited by low solar insolation.
2m Temperature Annual Mean Bias
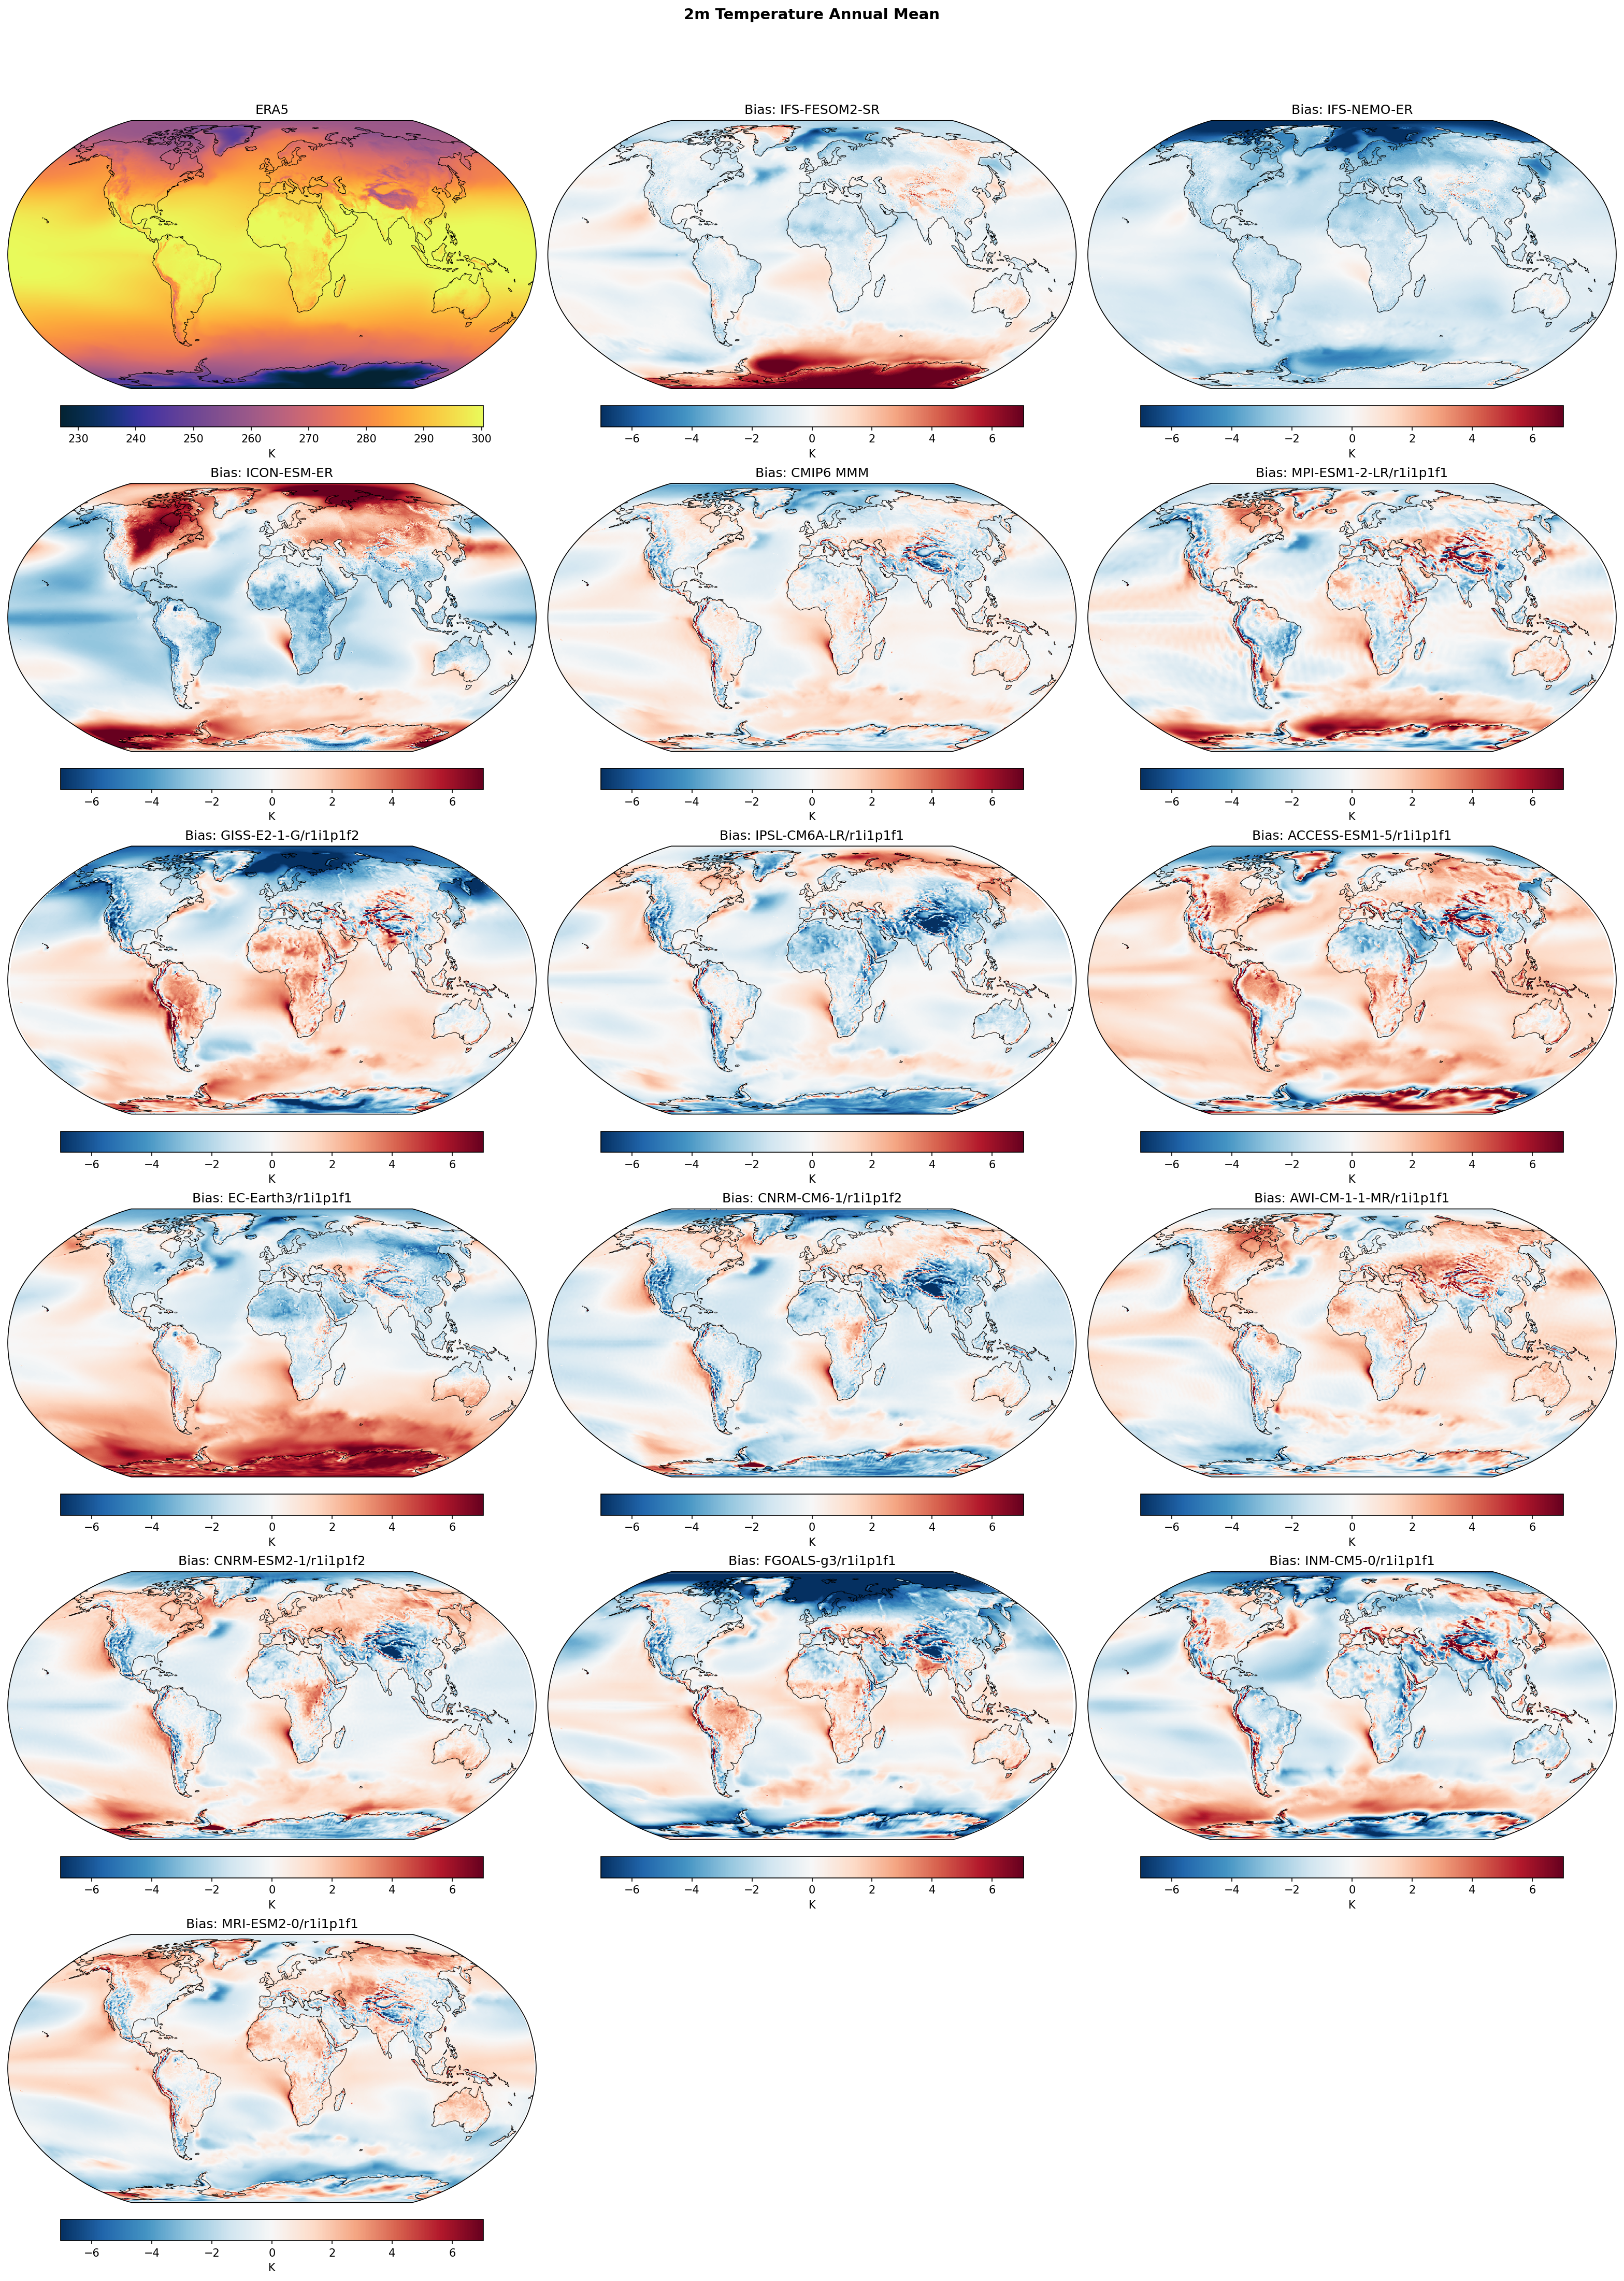
| Variables | tas |
|---|---|
| Models | IFS-FESOM2-SR, IFS-NEMO-ER, ICON-ESM-ER, HadGEM3-GC5, CMIP6 MMM, MPI-ESM1-2-LR/r1i1p1f1, GISS-E2-1-G/r1i1p1f2, IPSL-CM6A-LR/r1i1p1f1, ACCESS-ESM1-5/r1i1p1f1, EC-Earth3/r1i1p1f1, CNRM-CM6-1/r1i1p1f2, AWI-CM-1-1-MR/r1i1p1f1, CNRM-ESM2-1/r1i1p1f2, FGOALS-g3/r1i1p1f1, INM-CM5-0/r1i1p1f1, MRI-ESM2-0/r1i1p1f1 |
| Reference Dataset | ERA5 |
| Units | K |
| Period | 1980–2014 |
| IFS-FESOM2-SR | Global Mean Bias: -0.03 · Rmse: 1.49 |
| IFS-NEMO-ER | Global Mean Bias: -1.34 · Rmse: 1.80 |
| ICON-ESM-ER | Global Mean Bias: -0.38 · Rmse: 2.30 |
| HadGEM3-GC5 | Global Mean Bias: 0.71 · Rmse: 1.33 |
| CMIP6 MMM | Global Mean Bias: 0.00 · Rmse: 1.13 |
| MPI-ESM1-2-LR/r1i1p1f1 | Global Mean Bias: 0.12 · Rmse: 1.67 |
| GISS-E2-1-G/r1i1p1f2 | Global Mean Bias: 0.01 · Rmse: 2.15 |
| IPSL-CM6A-LR/r1i1p1f1 | Global Mean Bias: -0.43 · Rmse: 1.60 |
| ACCESS-ESM1-5/r1i1p1f1 | Global Mean Bias: 0.89 · Rmse: 1.92 |
| EC-Earth3/r1i1p1f1 | Global Mean Bias: 0.36 · Rmse: 2.06 |
| CNRM-CM6-1/r1i1p1f2 | Global Mean Bias: -0.59 · Rmse: 1.60 |
| AWI-CM-1-1-MR/r1i1p1f1 | Global Mean Bias: 0.42 · Rmse: 1.37 |
| CNRM-ESM2-1/r1i1p1f2 | Global Mean Bias: 0.03 · Rmse: 1.52 |
| FGOALS-g3/r1i1p1f1 | Global Mean Bias: -0.55 · Rmse: 2.44 |
| INM-CM5-0/r1i1p1f1 | Global Mean Bias: -0.36 · Rmse: 1.88 |
| MRI-ESM2-0/r1i1p1f1 | Global Mean Bias: 0.13 · Rmse: 1.39 |
Summary high
This figure evaluates the annual mean 2m temperature biases of four high-resolution EERIE models (IFS-FESOM2-SR, IFS-NEMO-ER, ICON-ESM-ER, HadGEM3-GC5) and the CMIP6 ensemble against ERA5 reanalysis. While the CMIP6 Multi-Model Mean (MMM) exhibits the lowest RMSE (1.13 K), the high-resolution HadGEM3-GC5 achieves a competitive RMSE (1.33 K) despite a global warm bias, whereas IFS-NEMO-ER and ICON-ESM-ER show substantial systematic cold biases and regional errors.
Key Findings
- IFS-FESOM2-SR has a near-zero global mean bias (-0.03 K) but exhibits regional cold biases in the North Atlantic and North Pacific, contrasting with warm biases over Antarctica.
- IFS-NEMO-ER is systematically too cold (global mean -1.34 K), with severe widespread cold biases over Northern Hemisphere landmasses and the Himalayas.
- HadGEM3-GC5 is the best-performing individual model by RMSE (1.33 K) but shows a systematic warm bias (+0.71 K), particularly strong in the Southern Ocean and North Pacific.
- ICON-ESM-ER displays the largest errors (RMSE 2.30 K) with a distinct dipole pattern: extreme warm biases over high-latitude continents (Canada, Siberia, Antarctica) versus deep cold biases over the oceans.
Spatial Patterns
A persistent 'cold blob' bias in the North Atlantic (south of Greenland) appears in almost all models (including CMIP6 MMM), indicative of common difficulties in representing the Gulf Stream separation and North Atlantic Current path. The Southern Ocean shows divergent behavior: HadGEM3-GC5 and many CMIP6 models (e.g., EC-Earth3) exhibit a strong warm bias, likely due to cloud radiative errors, whereas IFS-NEMO-ER and ICON-ESM-ER show cold biases there. High-latitude land areas (Siberia, Canada) are strongly warm in ICON-ESM-ER but strongly cold in IFS-NEMO-ER.
Model Agreement
Agreement is low among the EERIE models, which span from globally cold (IFS-NEMO-ER) to globally warm (HadGEM3-GC5). However, structural biases like the North Atlantic cold anomaly are robust across generations (EERIE vs CMIP6). HadGEM3-GC5 closely resembles the bias patterns of ACCESS-ESM1-5 and EC-Earth3 (warm Southern Ocean), while IFS-NEMO-ER's continental cold bias is unique in its severity.
Physical Interpretation
The pervasive North Atlantic cold bias suggests that even at eddy-rich resolutions, models may struggle with the precise separation latitude of the Gulf Stream or the strength of the AMOC heat transport. The warm Southern Ocean bias in HadGEM3-GC5 is a known systematic error often linked to insufficient supercooled liquid cloud reflection (too much SW absorption). The extreme continental warm bias in ICON-ESM-ER likely stems from surface energy balance issues, possibly related to snow albedo feedbacks or stable boundary layer parameterisation in winter.
Caveats
- ERA5 reanalysis itself has higher uncertainty in polar regions (Antarctica/Arctic), complicating the validation of extreme high-latitude biases.
- Annual means obscure seasonal compensations; for example, continental biases are often dominated by winter physics.
2m Temperature DJF Bias
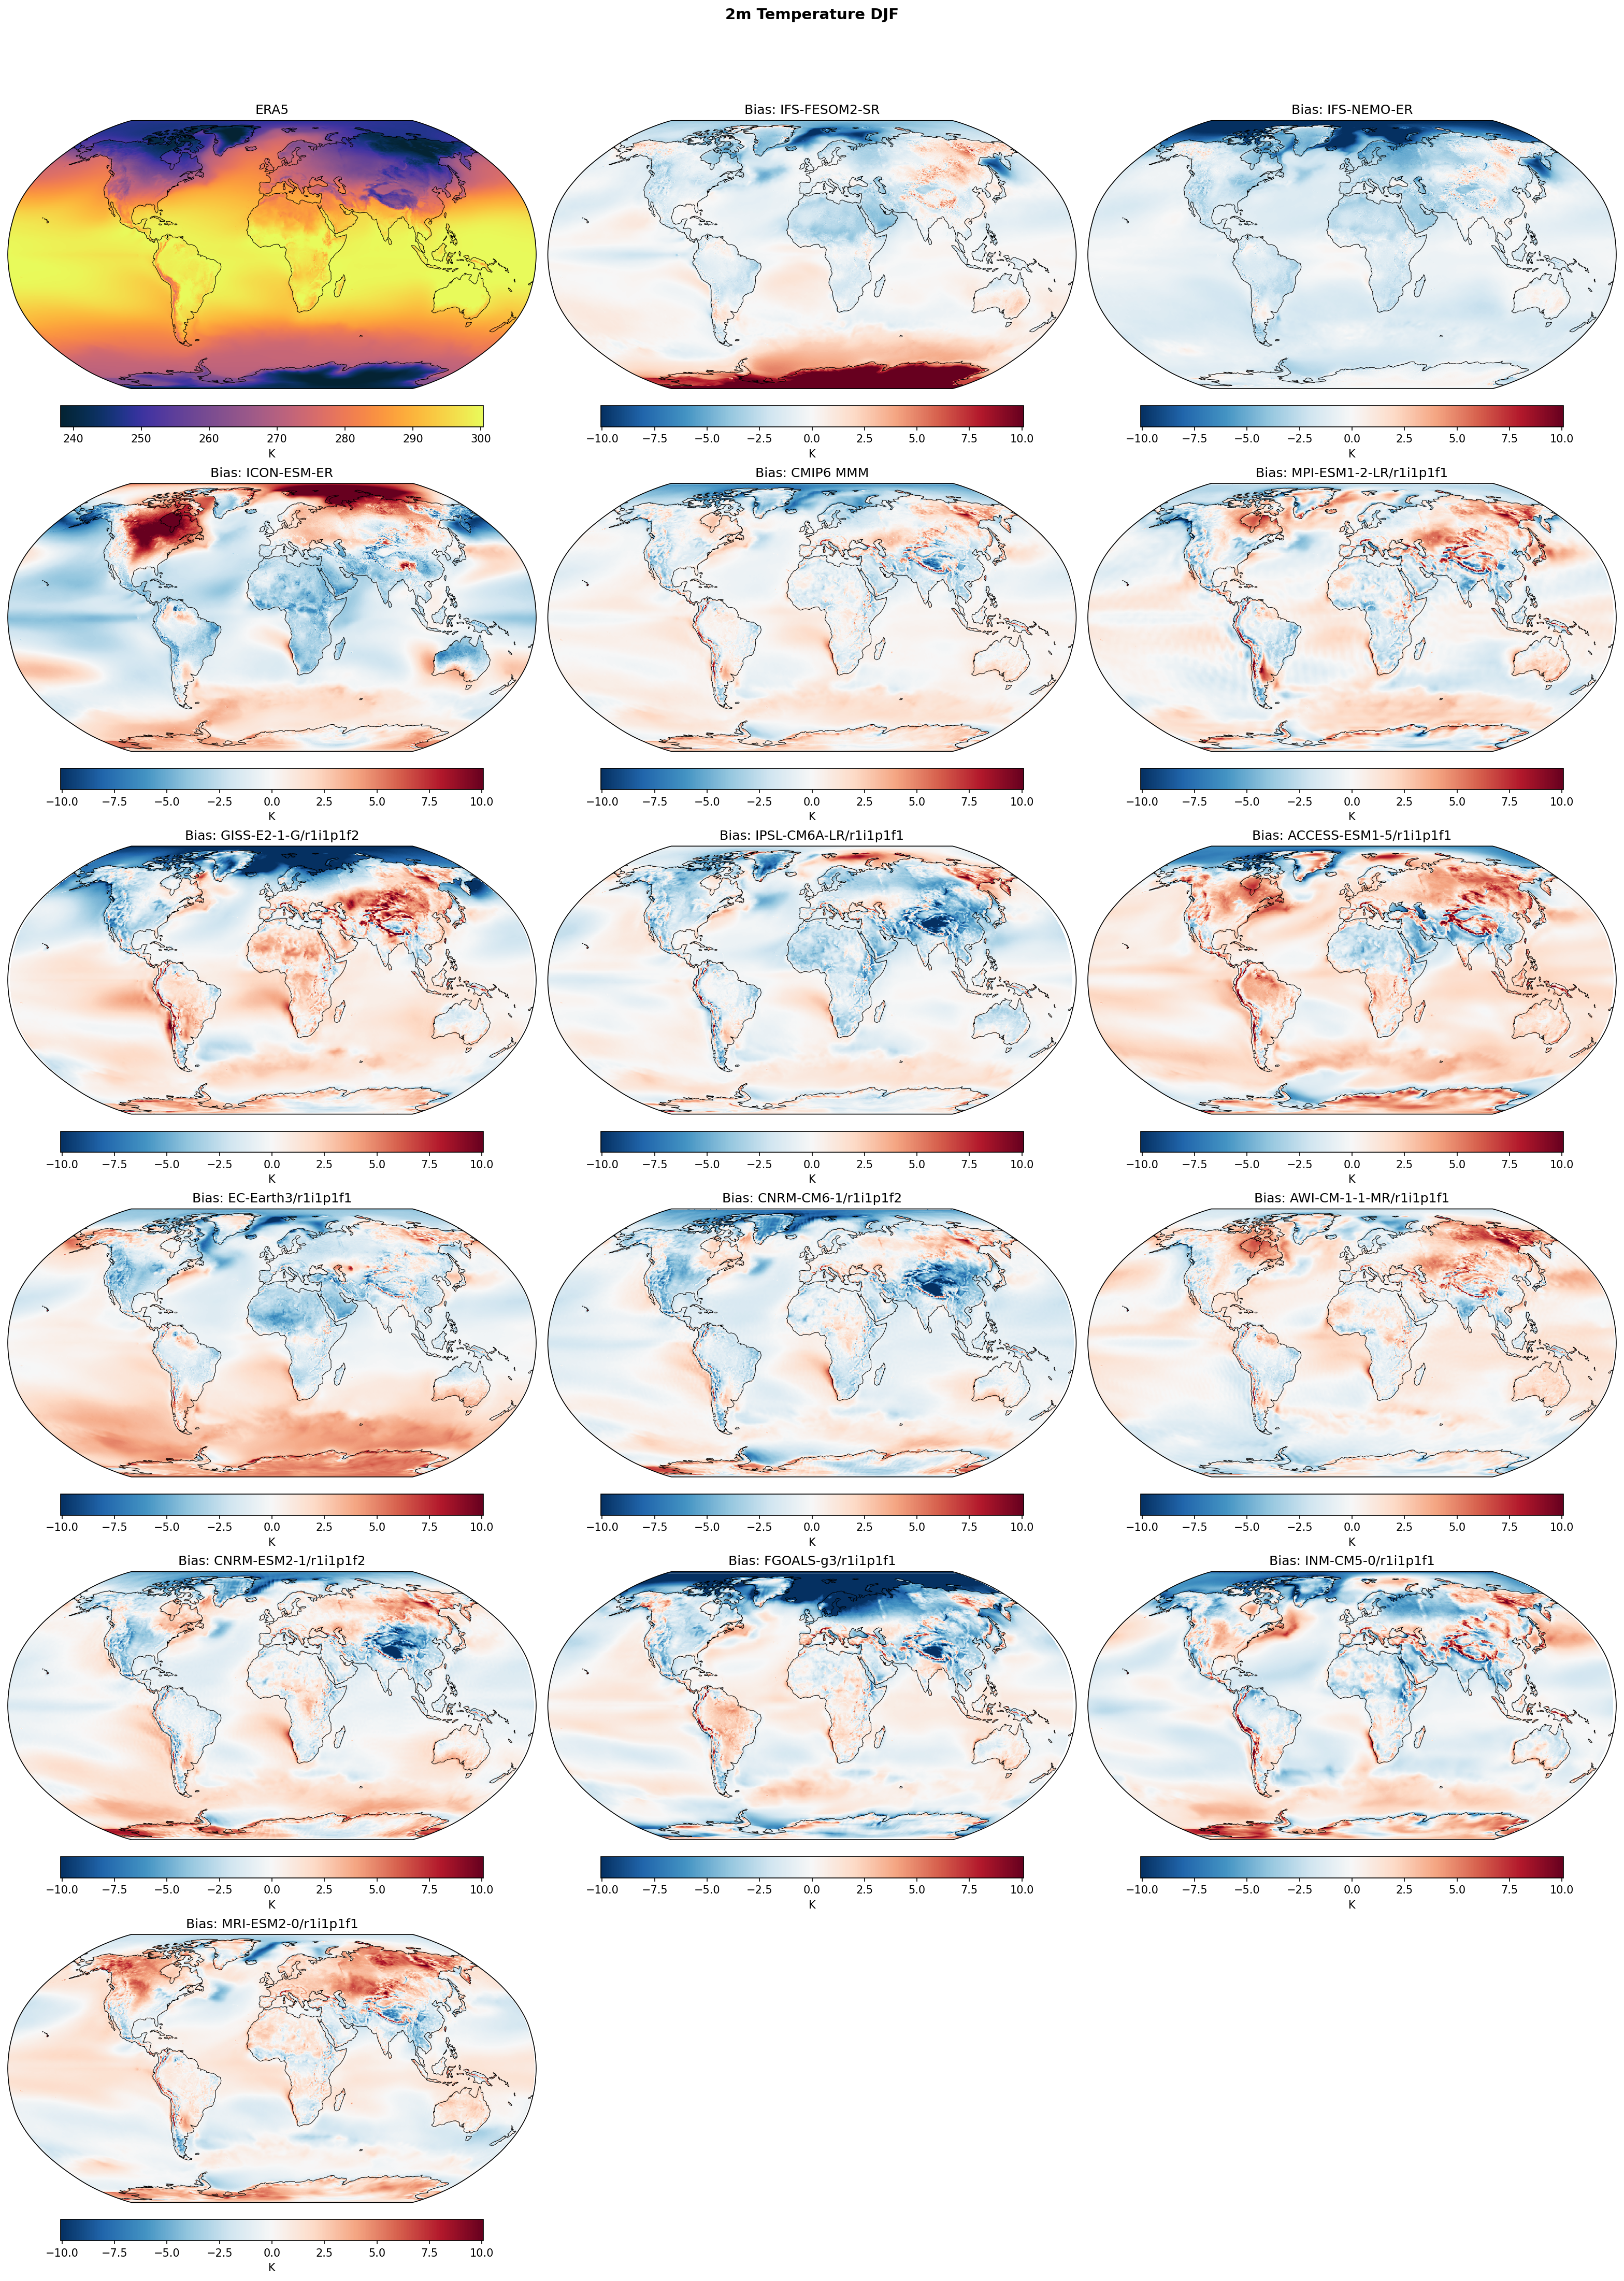
| Variables | tas |
|---|---|
| Models | IFS-FESOM2-SR, IFS-NEMO-ER, ICON-ESM-ER, HadGEM3-GC5, CMIP6 MMM, MPI-ESM1-2-LR/r1i1p1f1, GISS-E2-1-G/r1i1p1f2, IPSL-CM6A-LR/r1i1p1f1, ACCESS-ESM1-5/r1i1p1f1, EC-Earth3/r1i1p1f1, CNRM-CM6-1/r1i1p1f2, AWI-CM-1-1-MR/r1i1p1f1, CNRM-ESM2-1/r1i1p1f2, FGOALS-g3/r1i1p1f1, INM-CM5-0/r1i1p1f1, MRI-ESM2-0/r1i1p1f1 |
| Reference Dataset | ERA5 |
| Units | K |
| Period | 1980–2014 |
| CMIP6 MMM | Global Mean Bias: -0.00 · Rmse: None |
| MPI-ESM1-2-LR/r1i1p1f1 | Global Mean Bias: 0.09 · Rmse: None |
| GISS-E2-1-G/r1i1p1f2 | Global Mean Bias: 0.18 · Rmse: None |
| IPSL-CM6A-LR/r1i1p1f1 | Global Mean Bias: -0.55 · Rmse: None |
| ACCESS-ESM1-5/r1i1p1f1 | Global Mean Bias: 0.93 · Rmse: None |
| EC-Earth3/r1i1p1f1 | Global Mean Bias: 0.25 · Rmse: None |
| CNRM-CM6-1/r1i1p1f2 | Global Mean Bias: -0.63 · Rmse: None |
| AWI-CM-1-1-MR/r1i1p1f1 | Global Mean Bias: 0.41 · Rmse: None |
| CNRM-ESM2-1/r1i1p1f2 | Global Mean Bias: 0.00 · Rmse: None |
| FGOALS-g3/r1i1p1f1 | Global Mean Bias: -0.73 · Rmse: None |
| INM-CM5-0/r1i1p1f1 | Global Mean Bias: -0.39 · Rmse: None |
| MRI-ESM2-0/r1i1p1f1 | Global Mean Bias: 0.37 · Rmse: None |
Summary high
This diagnostic evaluates DJF 2m temperature biases relative to ERA5 for high-resolution EERIE models (IFS-FESOM2, IFS-NEMO, ICON, HadGEM3) alongside the CMIP6 Multi-Model Mean and individual CMIP6 members.
Key Findings
- ICON-ESM-ER exhibits a striking regional warm bias (>7.5 K) over North America and the Arctic, significantly stronger than in other EERIE models.
- IFS-FESOM2-SR displays a pronounced warm bias over the Antarctic continent, which is largely absent in the IFS-NEMO-ER configuration, suggesting ocean/sea-ice model formulation (FESOM vs NEMO) strongly influences high-latitude surface coupling.
- A persistent cold bias ('cold blob') in the subpolar North Atlantic is evident in IFS-FESOM2-SR, IFS-NEMO-ER, and the CMIP6 MMM, indicative of common structural errors in Gulf Stream separation or North Atlantic Current heat transport.
- HadGEM3-GC5 shows a distinct hemispheric asymmetry with cold biases over Northern Hemisphere continents and warm biases over the Southern Ocean and South America (Amazon).
Spatial Patterns
The CMIP6 MMM shows a classic pattern of warm Arctic / cold North Atlantic / warm Southern Ocean biases. The high-resolution EERIE models show sharper, more regionalised features. For instance, IFS variants are generally cool over global oceans but differ over Antarctica. ICON has a unique dipole of extreme warmth over North America vs cool biases over North Africa and the Middle East. Most models show warm biases over the Amazon, most pronounced in HadGEM3-GC5 and EC-Earth3.
Model Agreement
There is broad inter-model agreement on the cold bias in the North Atlantic subpolar gyre and warm biases in the Arctic (polar amplification of bias), though magnitudes vary. Disagreement is highest over Northern Hemisphere continents in winter: ICON is strongly warm, HadGEM3 is cold, and IFS is mixed/neutral. The representation of the Southern Ocean also varies, with HadGEM3 and CMIP6 MMM showing widespread warm biases, while IFS models are cooler.
Physical Interpretation
The North Atlantic cold bias suggests that even at eddy-rich resolutions (~10 km), models may struggle with the precise path of the North Atlantic Current or AMOC strength. The strong winter warm bias in ICON over North America likely points to deficiencies in snow cover parameterisation (albedo feedback) or an overly diffusive stable boundary layer scheme preventing surface cooling. The difference between IFS-FESOM2 and IFS-NEMO over Antarctica highlights the sensitivity of surface temperature to the underlying sea-ice/ocean grid and coupling physics (unstructured mesh vs structured).
Caveats
- Analysis is limited to DJF (boreal winter/austral summer); biases in JJA may reverse, particularly over land.
- Biases are relative to ERA5 reanalysis; while robust for T2m, sparse observations in Antarctica and the Arctic introduce some uncertainty in the reference.
2m Temperature JJA Bias
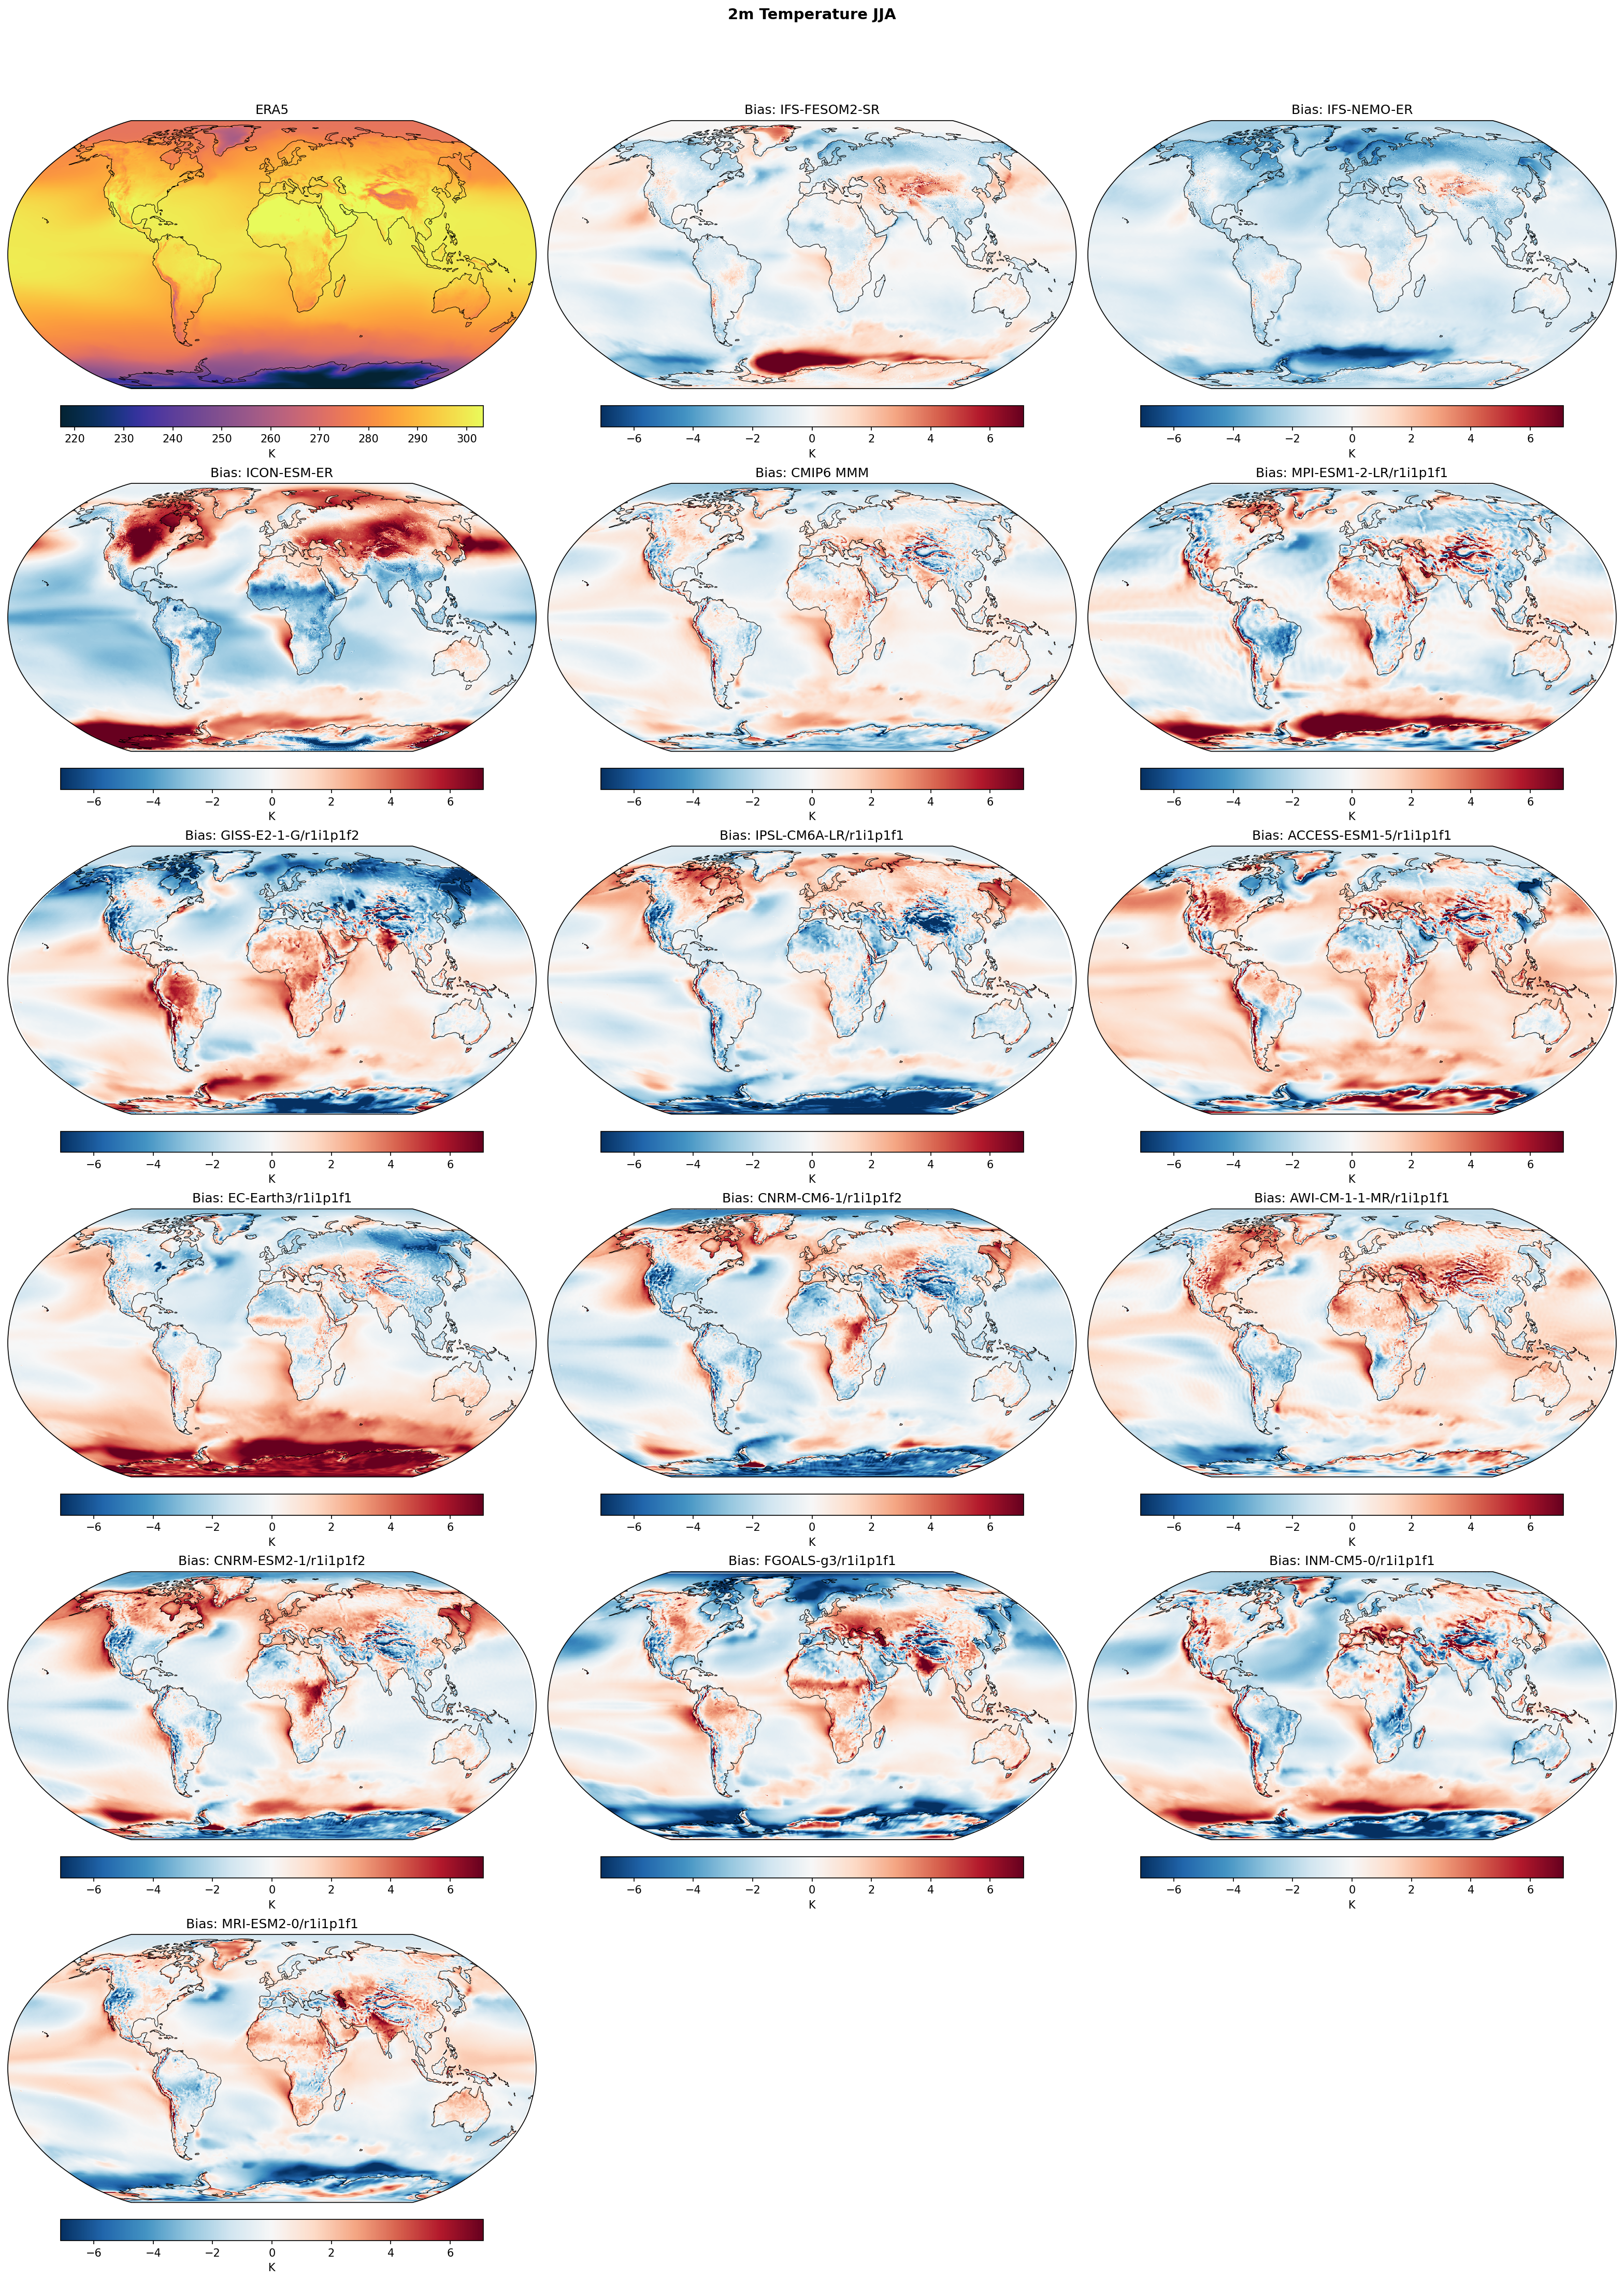
| Variables | tas |
|---|---|
| Models | IFS-FESOM2-SR, IFS-NEMO-ER, ICON-ESM-ER, HadGEM3-GC5, CMIP6 MMM, MPI-ESM1-2-LR/r1i1p1f1, GISS-E2-1-G/r1i1p1f2, IPSL-CM6A-LR/r1i1p1f1, ACCESS-ESM1-5/r1i1p1f1, EC-Earth3/r1i1p1f1, CNRM-CM6-1/r1i1p1f2, AWI-CM-1-1-MR/r1i1p1f1, CNRM-ESM2-1/r1i1p1f2, FGOALS-g3/r1i1p1f1, INM-CM5-0/r1i1p1f1, MRI-ESM2-0/r1i1p1f1 |
| Reference Dataset | ERA5 |
| Units | K |
| Period | 1980–2014 |
| CMIP6 MMM | Global Mean Bias: 0.03 · Rmse: None |
| MPI-ESM1-2-LR/r1i1p1f1 | Global Mean Bias: 0.13 · Rmse: None |
| GISS-E2-1-G/r1i1p1f2 | Global Mean Bias: -0.10 · Rmse: None |
| IPSL-CM6A-LR/r1i1p1f1 | Global Mean Bias: -0.37 · Rmse: None |
| ACCESS-ESM1-5/r1i1p1f1 | Global Mean Bias: 0.82 · Rmse: None |
| EC-Earth3/r1i1p1f1 | Global Mean Bias: 0.51 · Rmse: None |
| CNRM-CM6-1/r1i1p1f2 | Global Mean Bias: -0.50 · Rmse: None |
| AWI-CM-1-1-MR/r1i1p1f1 | Global Mean Bias: 0.39 · Rmse: None |
| CNRM-ESM2-1/r1i1p1f2 | Global Mean Bias: 0.14 · Rmse: None |
| FGOALS-g3/r1i1p1f1 | Global Mean Bias: -0.31 · Rmse: None |
| INM-CM5-0/r1i1p1f1 | Global Mean Bias: -0.29 · Rmse: None |
| MRI-ESM2-0/r1i1p1f1 | Global Mean Bias: -0.03 · Rmse: None |
Summary high
This figure presents JJA 2m temperature biases relative to ERA5 for high-resolution EERIE models (IFS, ICON, HadGEM3) and a selection of CMIP6 models. The EERIE models generally exhibit reduced biases in eastern boundary upwelling regions compared to the CMIP6 Multi-Model Mean (MMM), though they introduce distinct high-latitude and oceanic biases.
Key Findings
- ICON-ESM-ER exhibits a strong warm bias (>4 K) over Northern Hemisphere land masses (Canada, Siberia) during their summer (JJA) and over Antarctica during its winter.
- IFS-FESOM2-SR and IFS-NEMO-ER show a widespread weak cold bias (-1 to -2 K) across most global oceans, in contrast to the warm biases often seen in CMIP6 models (e.g., ACCESS-ESM1-5).
- High-resolution EERIE models effectively mitigate the classic 'warm bias' found in CMIP6 MMM eastern boundary upwelling zones (e.g., off the coasts of Peru and Namibia), likely due to better-resolved coastal dynamics.
- Southern Hemisphere winter (JJA) biases vary significantly: HadGEM3-GC5 and ICON-ESM-ER show strong warming over the Southern Ocean, while IFS models are generally cooler with localized warming in the Weddell Sea sector.
Spatial Patterns
The CMIP6 MMM shows characteristic warm biases in the major upwelling regions (eastern Pacific and Atlantic basins) and the Southern Ocean. In contrast, EERIE models like IFS-NEMO and IFS-FESOM replace these warm biases with a pervasive cool oceanic bias. ICON-ESM-ER stands out with a 'warm poles / cool tropics' pattern, showing intense warming over high-latitude continents and sea-ice zones. The North Atlantic 'warming hole' (cold anomaly south of Greenland) is present in most models, including HadGEM3-GC5 and the CMIP6 MMM.
Model Agreement
There is significant inter-model disagreement regarding the sign of the bias over the Southern Ocean and Antarctica (SH Winter). While ICON and HadGEM3 are notably warm, the IFS variants are colder. Conversely, most models agree on a cold bias in the North Atlantic subpolar gyre. The IFS-FESOM2-SR and IFS-NEMO-ER are spatially very similar, suggesting the atmospheric component (IFS) or shared tuning dominates the bias pattern over the ocean model differences.
Physical Interpretation
The reduction of warm biases in eastern boundary currents in EERIE models is physically consistent with higher resolution resolving coastal winds and upwelling eddies better than standard CMIP6 resolutions. The strong summer warm bias over NH land in ICON-ESM-ER suggests potential deficiencies in land-surface coupling (e.g., soil moisture drying) or cloud radiative shading. The pervasive oceanic cold bias in IFS models may indicate issues with surface flux parameterizations or vertical mixing. The strong SH winter warm biases in ICON and HadGEM3 likely stem from insufficient sea ice formation or excessive ocean-to-atmosphere heat fluxes.
Caveats
- The analysis is restricted to the JJA season; biases in DJF may differ significantly, particularly for seasonal sea-ice zones.
- Biases are relative to ERA5; uncertainties in ERA5 over Antarctica and remote oceans should be considered.
10m U Wind Annual Mean Bias
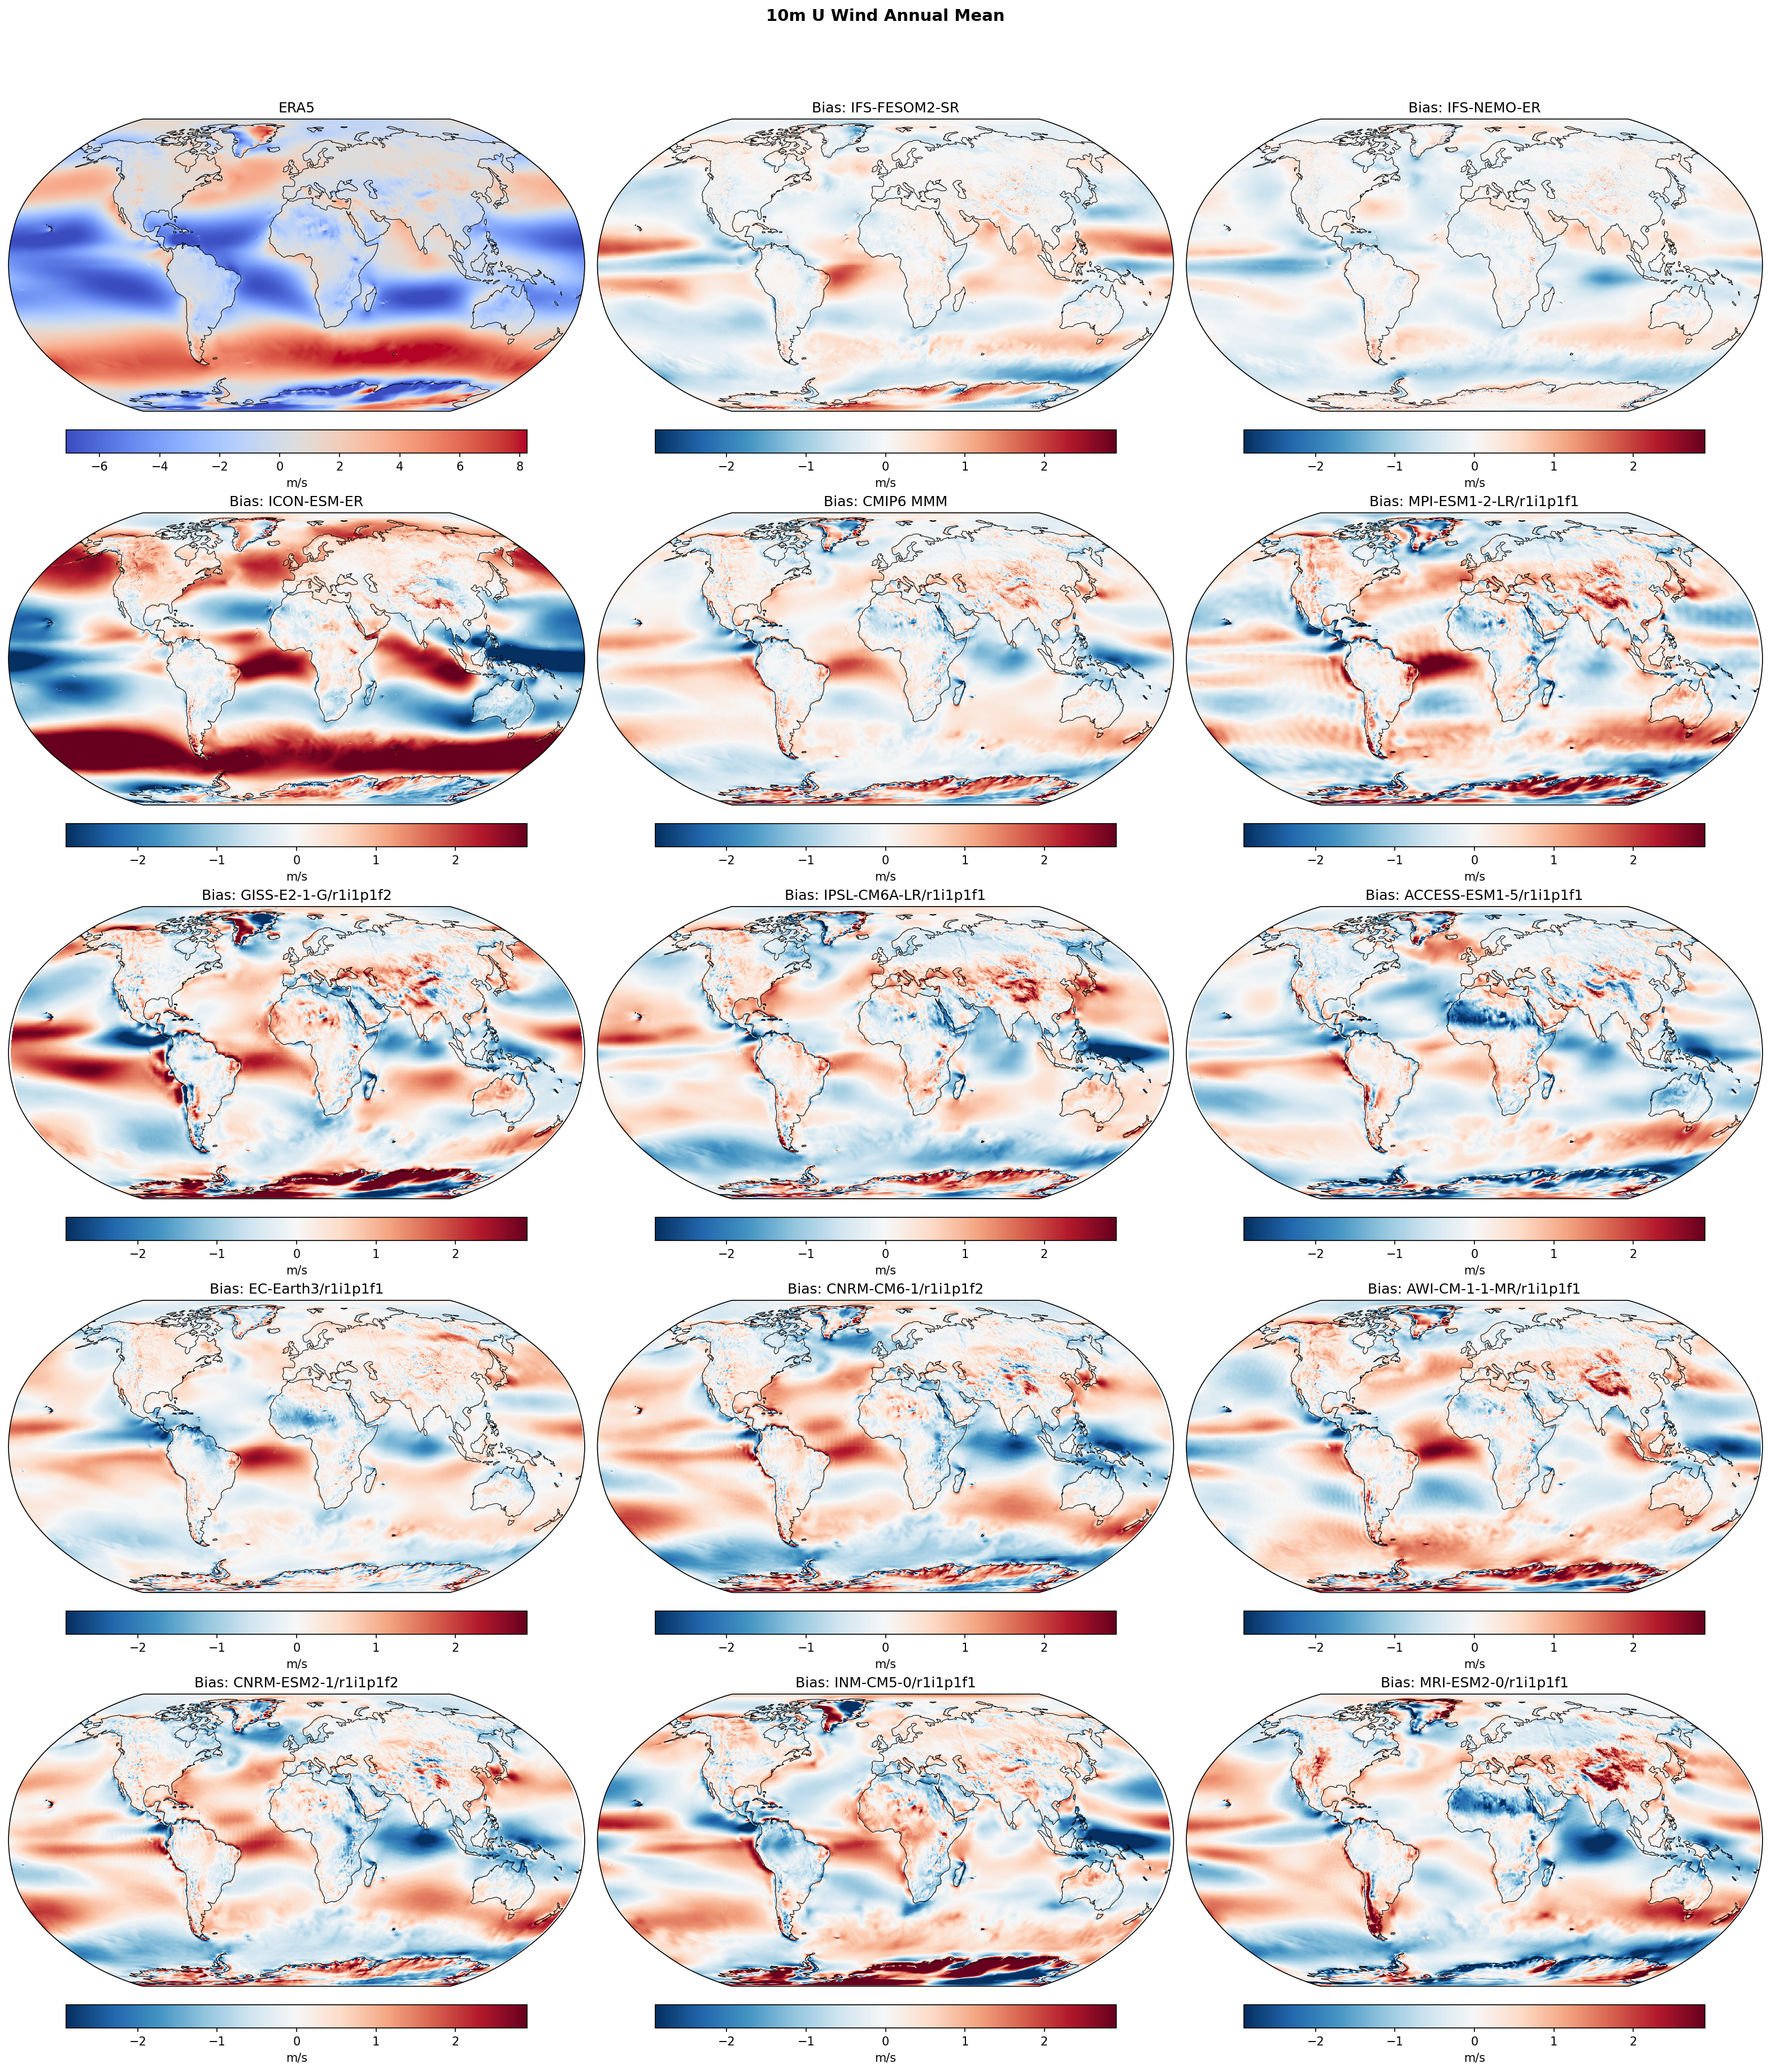
| Variables | uas |
|---|---|
| Models | IFS-FESOM2-SR, IFS-NEMO-ER, ICON-ESM-ER, HadGEM3-GC5, CMIP6 MMM, MPI-ESM1-2-LR/r1i1p1f1, GISS-E2-1-G/r1i1p1f2, IPSL-CM6A-LR/r1i1p1f1, ACCESS-ESM1-5/r1i1p1f1, EC-Earth3/r1i1p1f1, CNRM-CM6-1/r1i1p1f2, AWI-CM-1-1-MR/r1i1p1f1, CNRM-ESM2-1/r1i1p1f2, INM-CM5-0/r1i1p1f1, MRI-ESM2-0/r1i1p1f1 |
| Reference Dataset | ERA5 |
| Units | m/s |
| Period | 1980–2014 |
| IFS-FESOM2-SR | Global Mean Bias: -0.01 · Rmse: 0.54 |
| IFS-NEMO-ER | Global Mean Bias: -0.11 · Rmse: 0.41 |
| ICON-ESM-ER | Global Mean Bias: 0.26 · Rmse: 1.67 |
| HadGEM3-GC5 | Global Mean Bias: 0.08 · Rmse: 0.51 |
| CMIP6 MMM | Global Mean Bias: 0.01 · Rmse: 0.62 |
| MPI-ESM1-2-LR/r1i1p1f1 | Global Mean Bias: 0.08 · Rmse: 0.87 |
| GISS-E2-1-G/r1i1p1f2 | Global Mean Bias: 0.14 · Rmse: 1.07 |
| IPSL-CM6A-LR/r1i1p1f1 | Global Mean Bias: -0.04 · Rmse: 0.83 |
| ACCESS-ESM1-5/r1i1p1f1 | Global Mean Bias: -0.19 · Rmse: 0.82 |
| EC-Earth3/r1i1p1f1 | Global Mean Bias: 0.03 · Rmse: 0.62 |
| CNRM-CM6-1/r1i1p1f2 | Global Mean Bias: 0.02 · Rmse: 0.85 |
| AWI-CM-1-1-MR/r1i1p1f1 | Global Mean Bias: 0.08 · Rmse: 0.79 |
| CNRM-ESM2-1/r1i1p1f2 | Global Mean Bias: 0.03 · Rmse: 0.84 |
| INM-CM5-0/r1i1p1f1 | Global Mean Bias: 0.07 · Rmse: 1.03 |
| MRI-ESM2-0/r1i1p1f1 | Global Mean Bias: -0.07 · Rmse: 0.97 |
Summary high
This figure evaluates annual mean 10m zonal wind biases relative to ERA5, demonstrating that the high-resolution EERIE models (IFS-NEMO, IFS-FESOM, HadGEM3) significantly outperform the CMIP6 multi-model mean and individual standard-resolution models, with the notable exception of ICON-ESM-ER.
Key Findings
- IFS-NEMO-ER achieves the best performance with the lowest global RMSE (0.41 m/s) and minimal spatial biases, likely benefiting from its shared lineage with the ERA5 reference.
- ICON-ESM-ER is a distinct outlier with severe systematic biases (RMSE 1.67 m/s), showing excessive wind speeds globally: westerlies are too strong (positive bias >2 m/s) and trade winds are too strong (negative bias <-2 m/s).
- HadGEM3-GC5 and IFS-FESOM2-SR (RMSE ~0.5 m/s) show marked improvements over the CMIP6 Multi-Model Mean (RMSE 0.62 m/s), particularly in reducing the equatorward bias and intensity errors of the Southern Ocean westerlies common in lower-resolution models.
Spatial Patterns
The CMIP6 MMM and several individual models (e.g., GISS-E2-1-G, CNRM-CM6-1) exhibit strong positive biases in the Southern Ocean, indicating westerlies that are too strong or shifted equatorward. In the tropics, ICON-ESM-ER displays intense negative biases (excessive easterlies), while HadGEM3-GC5 and the CMIP6 MMM show mild positive biases (weak trades) in the Pacific. The North Atlantic storm track is well-represented in IFS variants but shows variable biases across the CMIP6 ensemble.
Model Agreement
There is high agreement between IFS-NEMO-ER, IFS-FESOM2-SR, and ERA5. The EERIE models (excluding ICON) cluster with much lower biases than the spread seen in the CMIP6 ensemble. ICON-ESM-ER diverges sharply from both observations and other models.
Physical Interpretation
The systematic overestimation of wind speeds in ICON-ESM-ER suggests insufficient surface drag parameterization or momentum dissipation. The reduced biases in IFS and HadGEM3 likely result from a combination of higher resolution (better resolved orographic blocking and air-sea interaction) and, for IFS, physics packages that are highly tuned for numerical weather prediction similar to the ERA5 reanalysis system.
Caveats
- The use of ERA5 as the reference dataset creates a 'home advantage' for IFS-based models (IFS-NEMO, IFS-FESOM, EC-Earth) due to shared atmospheric physics and dynamics.
- The ICON-ESM-ER biases are large enough to potentially distort coupled ocean circulation features (e.g., Ekman transport).
10m U Wind DJF Bias
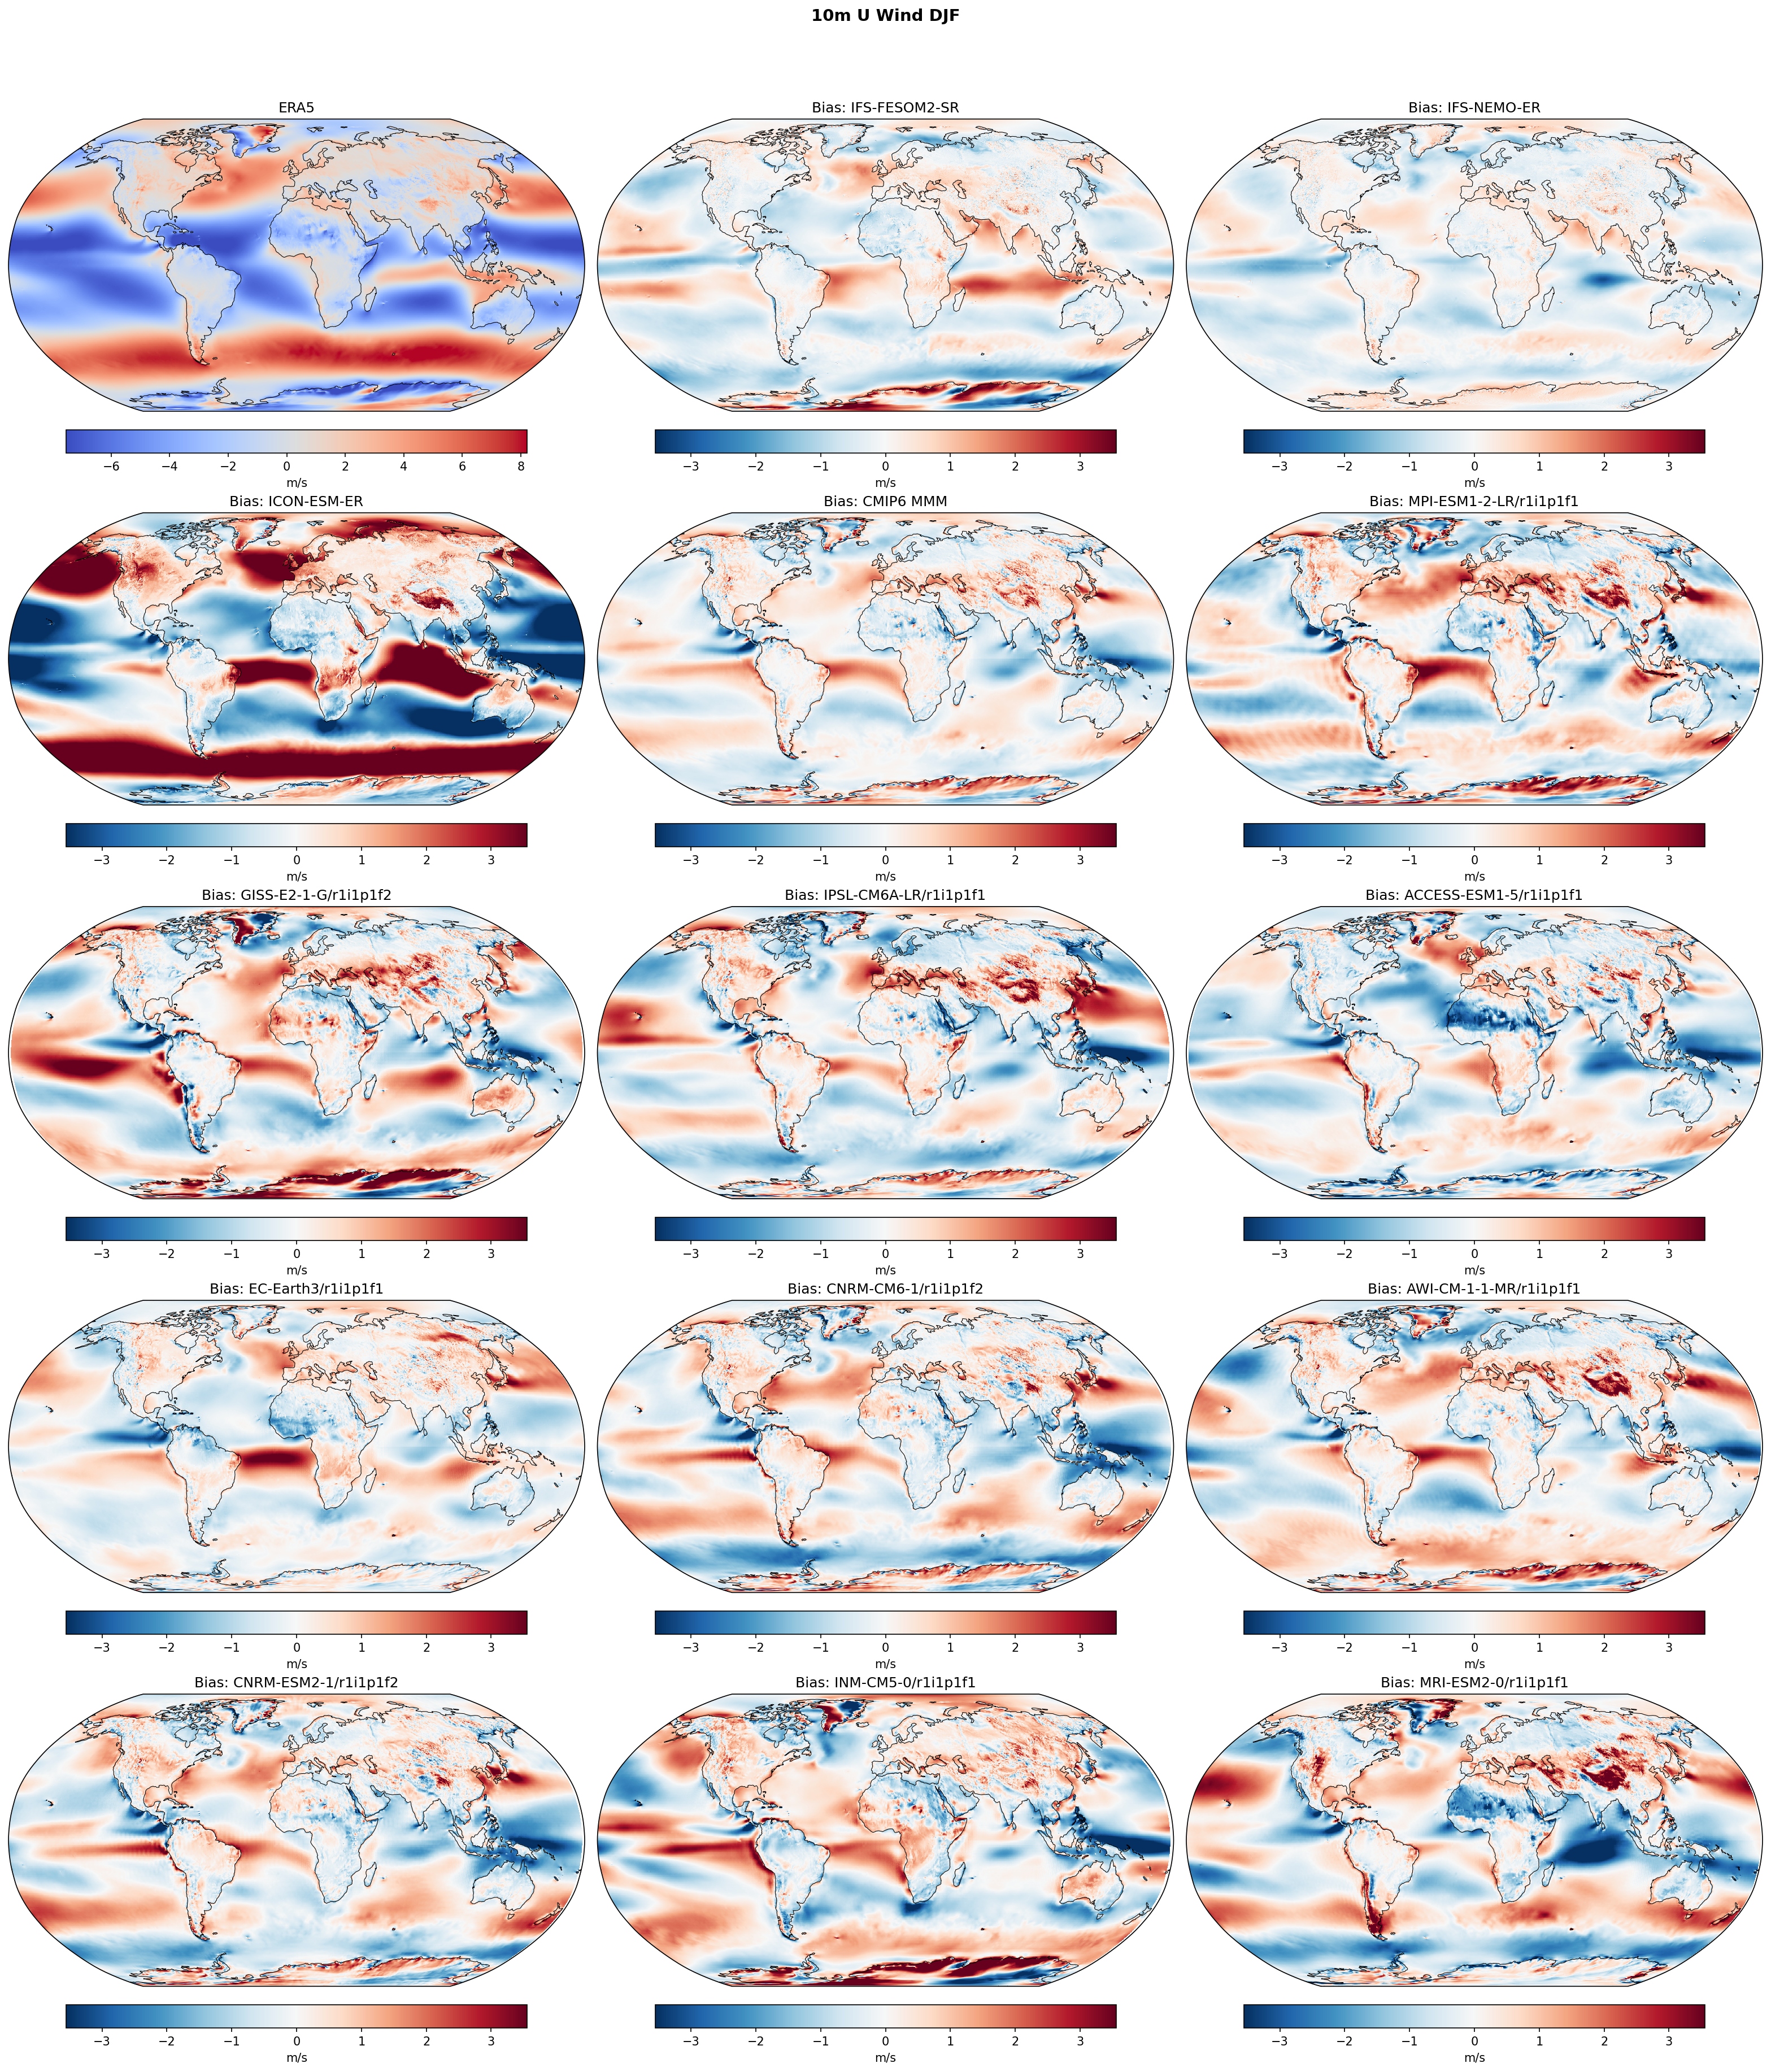
| Variables | uas |
|---|---|
| Models | IFS-FESOM2-SR, IFS-NEMO-ER, ICON-ESM-ER, HadGEM3-GC5, CMIP6 MMM, MPI-ESM1-2-LR/r1i1p1f1, GISS-E2-1-G/r1i1p1f2, IPSL-CM6A-LR/r1i1p1f1, ACCESS-ESM1-5/r1i1p1f1, EC-Earth3/r1i1p1f1, CNRM-CM6-1/r1i1p1f2, AWI-CM-1-1-MR/r1i1p1f1, CNRM-ESM2-1/r1i1p1f2, INM-CM5-0/r1i1p1f1, MRI-ESM2-0/r1i1p1f1 |
| Reference Dataset | ERA5 |
| Units | m/s |
| Period | 1980–2014 |
| CMIP6 MMM | Global Mean Bias: -0.04 · Rmse: None |
| MPI-ESM1-2-LR/r1i1p1f1 | Global Mean Bias: 0.01 · Rmse: None |
| GISS-E2-1-G/r1i1p1f2 | Global Mean Bias: 0.12 · Rmse: None |
| IPSL-CM6A-LR/r1i1p1f1 | Global Mean Bias: -0.09 · Rmse: None |
| ACCESS-ESM1-5/r1i1p1f1 | Global Mean Bias: -0.29 · Rmse: None |
| EC-Earth3/r1i1p1f1 | Global Mean Bias: -0.01 · Rmse: None |
| CNRM-CM6-1/r1i1p1f2 | Global Mean Bias: -0.07 · Rmse: None |
| AWI-CM-1-1-MR/r1i1p1f1 | Global Mean Bias: 0.03 · Rmse: None |
| CNRM-ESM2-1/r1i1p1f2 | Global Mean Bias: -0.07 · Rmse: None |
| INM-CM5-0/r1i1p1f1 | Global Mean Bias: 0.07 · Rmse: None |
| MRI-ESM2-0/r1i1p1f1 | Global Mean Bias: -0.12 · Rmse: None |
Summary high
This figure evaluates DJF 10m zonal wind (U-component) biases relative to ERA5, revealing a systematic equatorward shift of the Southern Hemisphere westerly jet across most models, including high-resolution simulations, while identifying significant outliers in model performance.
Key Findings
- Systematic Southern Hemisphere Bias: Nearly all models (IFS, HadGEM3, CMIP6 MMM) exhibit a distinct dipole bias in the Southern Ocean (positive bias ~40-50°S, negative bias ~60°S), indicating the modeled westerly jet is shifted equatorward relative to ERA5.
- ICON-ESM-ER Outlier: This model shows severe, widespread biases significantly larger than other groups (>3 m/s), characterized by excessive westerlies over Northern Hemisphere landmasses and subtropical oceans, and weak westerlies in the high-latitude Southern Ocean.
- North Atlantic Jet Extension: HadGEM3-GC5 and the CMIP6 MMM show a strong positive zonal wind bias extending across the North Atlantic towards Europe, suggesting the winter jet is too zonal or extends too far east.
- IFS Performance: The IFS-based models (FESOM2-SR, NEMO-ER) and EC-Earth3 show relatively low bias magnitudes compared to other models, though the structural shift in the Southern Hemisphere persists.
Spatial Patterns
The dominant spatial feature is the zonally symmetric dipole in the Southern Hemisphere biases, reflecting circulation shifts. In the Northern Hemisphere, biases are more regionally localized, with positive (westerly) biases frequently appearing in the North Atlantic storm track and subtropical Pacific. Tropical trade wind biases are generally smaller but mixed in sign, with HadGEM3 showing positive biases (weaker easterlies) in the central Pacific.
Model Agreement
There is strong structural agreement between IFS-FESOM2-SR and IFS-NEMO-ER, suggesting the ocean model dynamical core (unstructured vs. structured) has minimal impact on surface wind biases compared to the atmospheric component. These high-resolution models generally align with the CMIP6 Multi-Model Mean pattern but do not eliminate the common Southern Hemisphere jet shift bias. ICON-ESM-ER disagrees strongly with the ensemble due to its extreme bias magnitudes.
Physical Interpretation
The pervasive equatorward shift of the Southern Hemisphere westerlies is a longstanding model bias, often attributed to cloud-radiative feedbacks (insufficient shortwave reflection over the Southern Ocean) or insufficient eddy-momentum flux convergence, though the latter should be improved in these eddy-rich resolutions. The excessive westerlies over land in ICON-ESM-ER suggest potential issues with surface drag parameterization or land-atmosphere coupling in this specific configuration. The North Atlantic biases relate to the simulation of storm track tilt and the Gulf Stream extension.
Caveats
- The color scale saturates for ICON-ESM-ER, making it difficult to assess the full magnitude of its errors.
- The analysis relies on ERA5 as truth; while robust, reanalyses can have their own uncertainties in data-sparse regions like the Southern Ocean.
10m U Wind JJA Bias
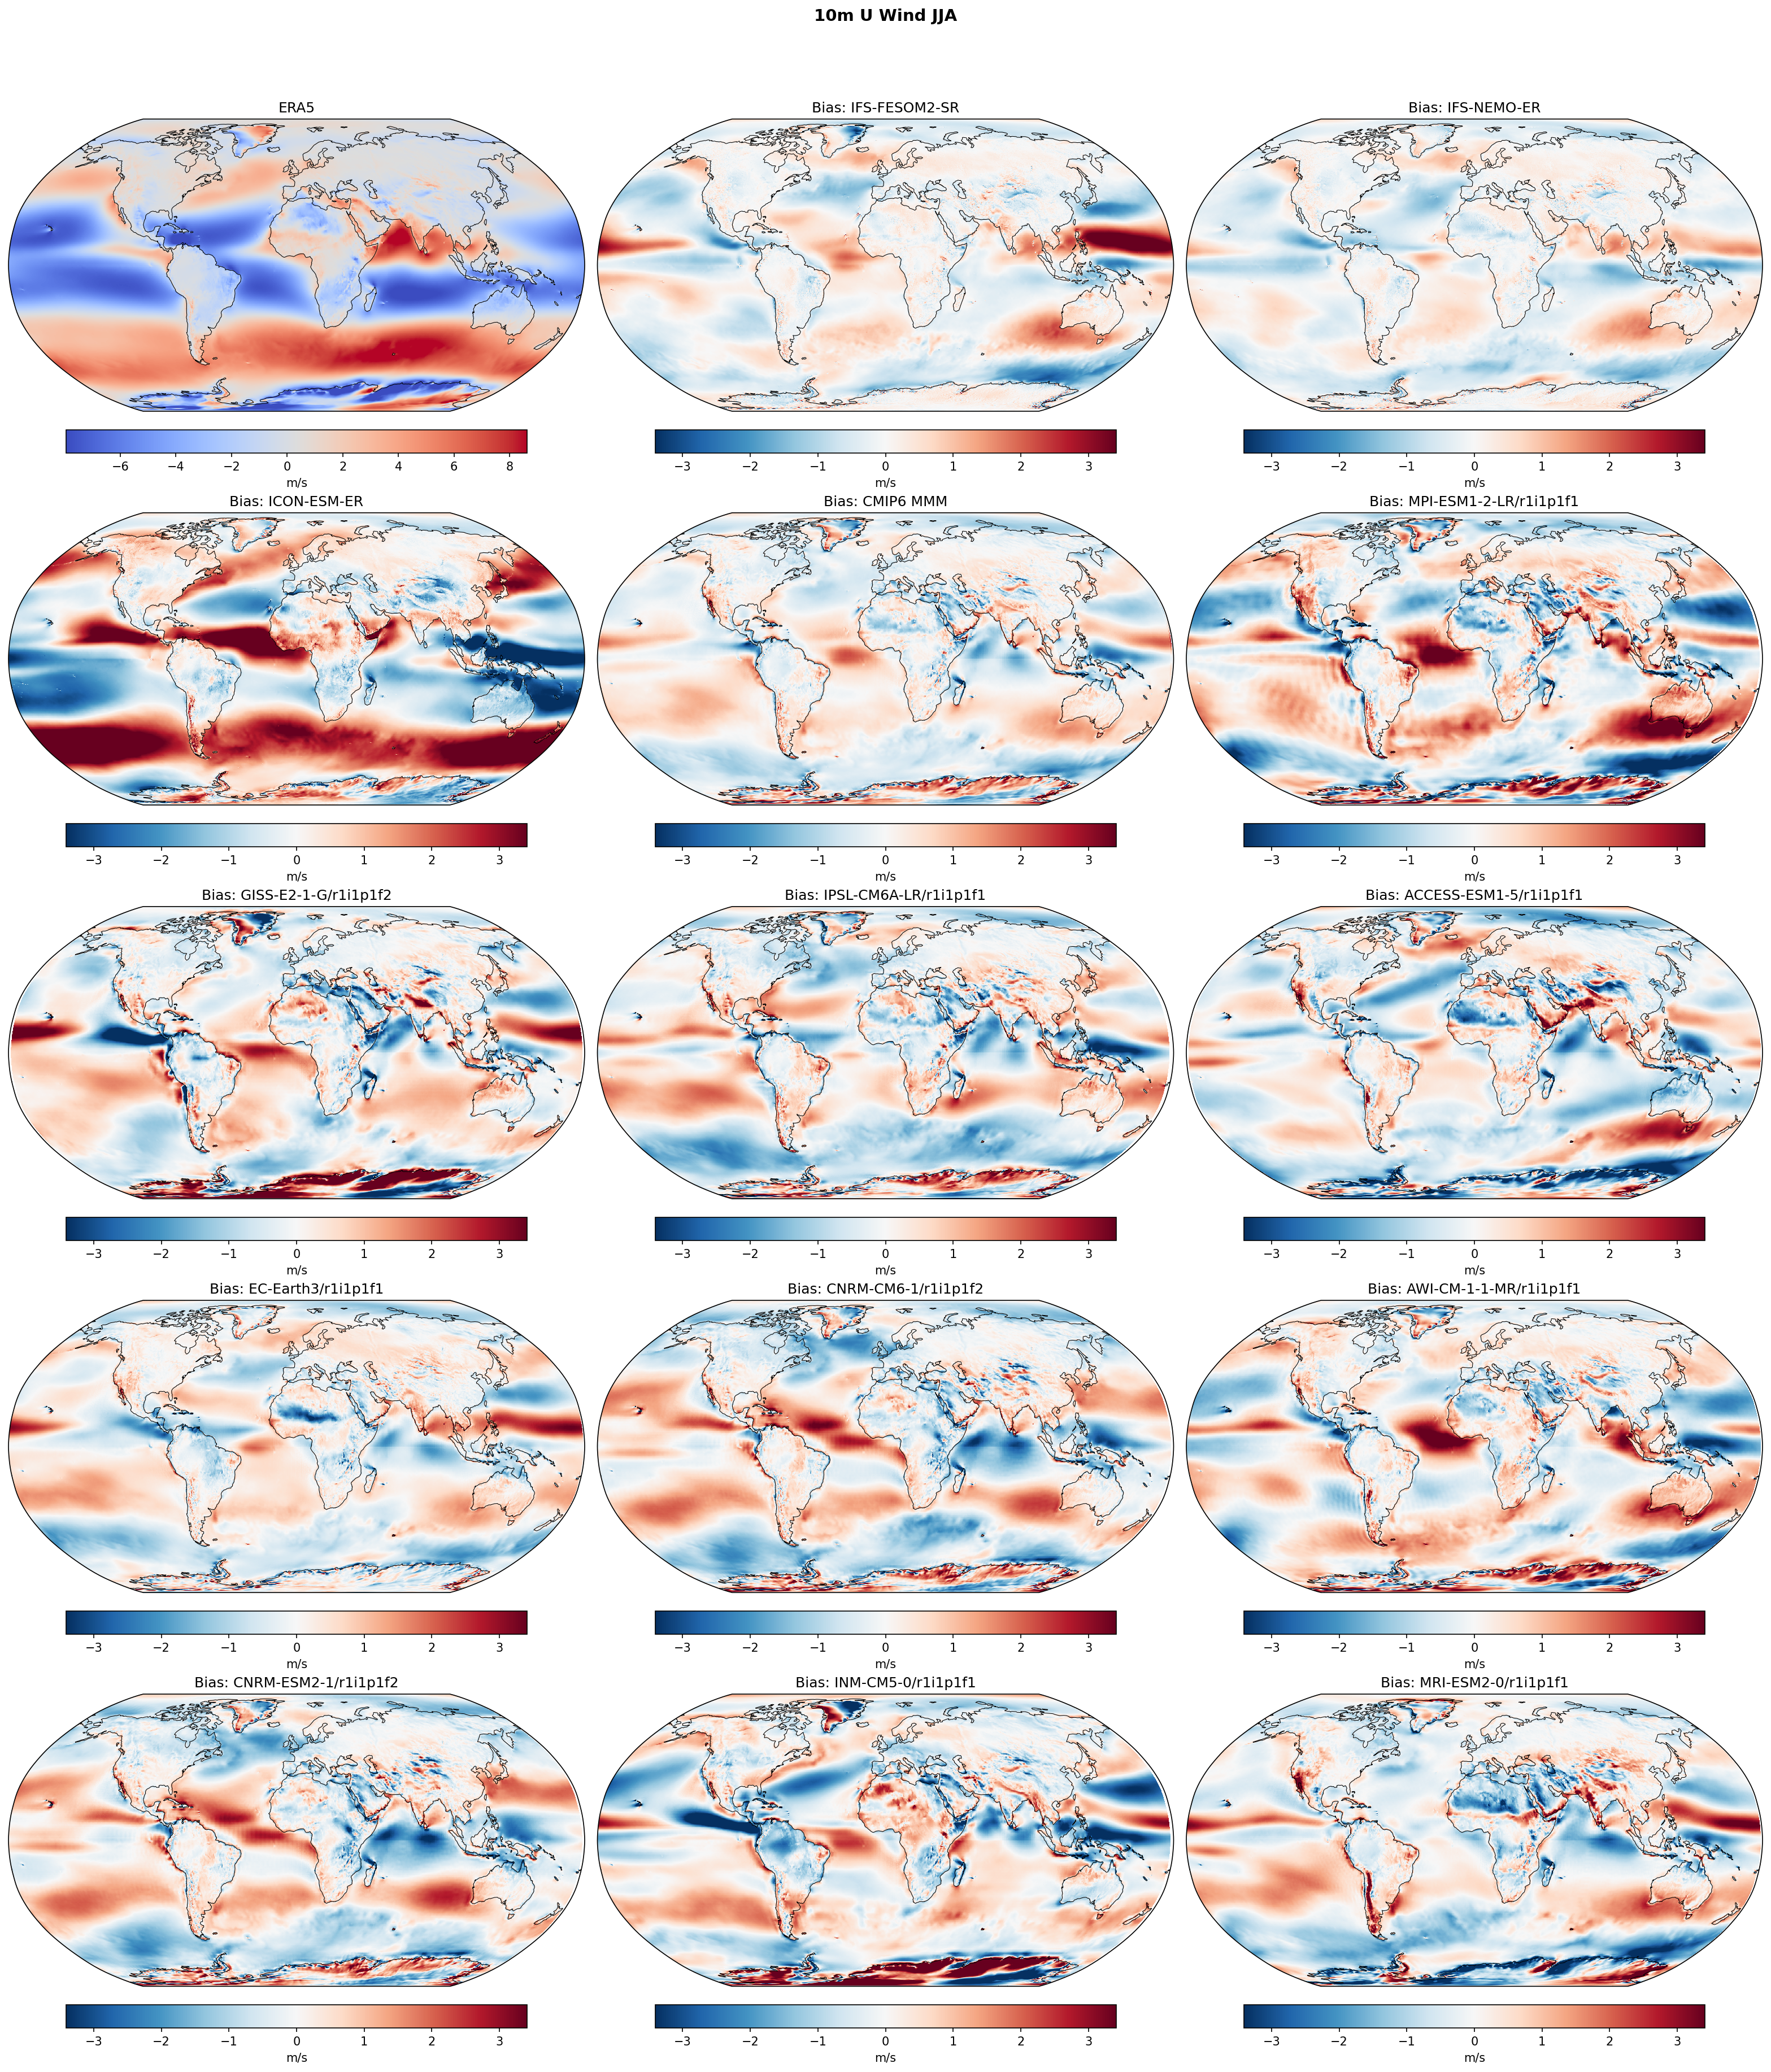
| Variables | uas |
|---|---|
| Models | IFS-FESOM2-SR, IFS-NEMO-ER, ICON-ESM-ER, HadGEM3-GC5, CMIP6 MMM, MPI-ESM1-2-LR/r1i1p1f1, GISS-E2-1-G/r1i1p1f2, IPSL-CM6A-LR/r1i1p1f1, ACCESS-ESM1-5/r1i1p1f1, EC-Earth3/r1i1p1f1, CNRM-CM6-1/r1i1p1f2, AWI-CM-1-1-MR/r1i1p1f1, CNRM-ESM2-1/r1i1p1f2, INM-CM5-0/r1i1p1f1, MRI-ESM2-0/r1i1p1f1 |
| Reference Dataset | ERA5 |
| Units | m/s |
| Period | 1980–2014 |
| CMIP6 MMM | Global Mean Bias: -0.01 · Rmse: None |
| MPI-ESM1-2-LR/r1i1p1f1 | Global Mean Bias: 0.07 · Rmse: None |
| GISS-E2-1-G/r1i1p1f2 | Global Mean Bias: 0.09 · Rmse: None |
| IPSL-CM6A-LR/r1i1p1f1 | Global Mean Bias: -0.06 · Rmse: None |
| ACCESS-ESM1-5/r1i1p1f1 | Global Mean Bias: -0.18 · Rmse: None |
| EC-Earth3/r1i1p1f1 | Global Mean Bias: 0.02 · Rmse: None |
| CNRM-CM6-1/r1i1p1f2 | Global Mean Bias: 0.03 · Rmse: None |
| AWI-CM-1-1-MR/r1i1p1f1 | Global Mean Bias: 0.08 · Rmse: None |
| CNRM-ESM2-1/r1i1p1f2 | Global Mean Bias: 0.03 · Rmse: None |
| INM-CM5-0/r1i1p1f1 | Global Mean Bias: -0.07 · Rmse: None |
| MRI-ESM2-0/r1i1p1f1 | Global Mean Bias: -0.08 · Rmse: None |
Summary high
This figure displays the global spatial biases in JJA 10m zonal wind (U-component) relative to ERA5 for four high-resolution EERIE models (IFS-FESOM2-SR, IFS-NEMO-ER, ICON-ESM-ER, HadGEM3-GC5) and the CMIP6 ensemble. The IFS-based models demonstrate significantly reduced biases compared to ICON-ESM-ER and the CMIP6 multi-model mean, particularly in the Southern Hemisphere storm track.
Key Findings
- IFS-FESOM2-SR and IFS-NEMO-ER show the highest skill, with weak, spatially unstructured biases (mostly <1 m/s), indicating accurate positioning of the major wind belts.
- ICON-ESM-ER exhibits a severe systematic bias in the Southern Hemisphere, characterized by a strong dipole (positive bias ~40°S, negative bias ~60°S), indicating a significant equatorward shift of the eddy-driven westerly jet.
- In the Tropical Pacific, ICON-ESM-ER shows a strong negative (easterly) bias, implying trade winds that are too intense, whereas GISS-E2-1-G and several CMIP6 models show a positive (westerly) bias, indicating weak trades.
- The South Asian Summer Monsoon (Somali Jet) westerlies are underestimated in ICON-ESM-ER and IPSL-CM6A-LR (negative/easterly bias in the Arabian Sea), but are well-captured by the IFS models.
Spatial Patterns
The most prominent feature is the zonal dipole in the Southern Ocean seen in ICON-ESM-ER, HadGEM3-GC5, and the CMIP6 MMM, corresponding to a meridional displacement of the westerlies. In the tropics, biases are largely zonal, affecting the trade wind strength. The IFS models largely avoid these zonal bands, showing only localized coastal or regional discrepancies.
Model Agreement
There is a strong divergence between the IFS models (high agreement with ERA5) and ICON-ESM-ER (poor agreement, large systematic biases). HadGEM3-GC5 falls in between, sharing the equatorward SH jet shift seen in CMIP6 but with smaller magnitudes than ICON. The CMIP6 MMM obscures individual model variability but highlights the pervasive equatorward jet bias and weak Atlantic trades common in the ensemble.
Physical Interpretation
The equatorward shift of the Southern Hemisphere westerly jet in ICON-ESM-ER and HadGEM3-GC5 is a longstanding bias often associated with insufficient resolution of transient eddies or cloud-radiative feedbacks, though its strong presence in the high-resolution ICON-ESM-ER is notable. The overly strong Pacific trades in ICON suggest a potential 'cold tongue' bias (La Niña-like state) in the coupled system, driving stronger Walker circulation. Conversely, the weak trades in many CMIP6 models often correlate with warm SST biases in upwelling regions.
Caveats
- Biases are relative to ERA5; while robust, ERA5 has its own uncertainties in the Southern Ocean.
- The sign convention (red = positive, blue = negative) requires careful interpretation in easterly regimes (e.g., blue bias in trades = stronger easterlies).
10m V Wind Annual Mean Bias
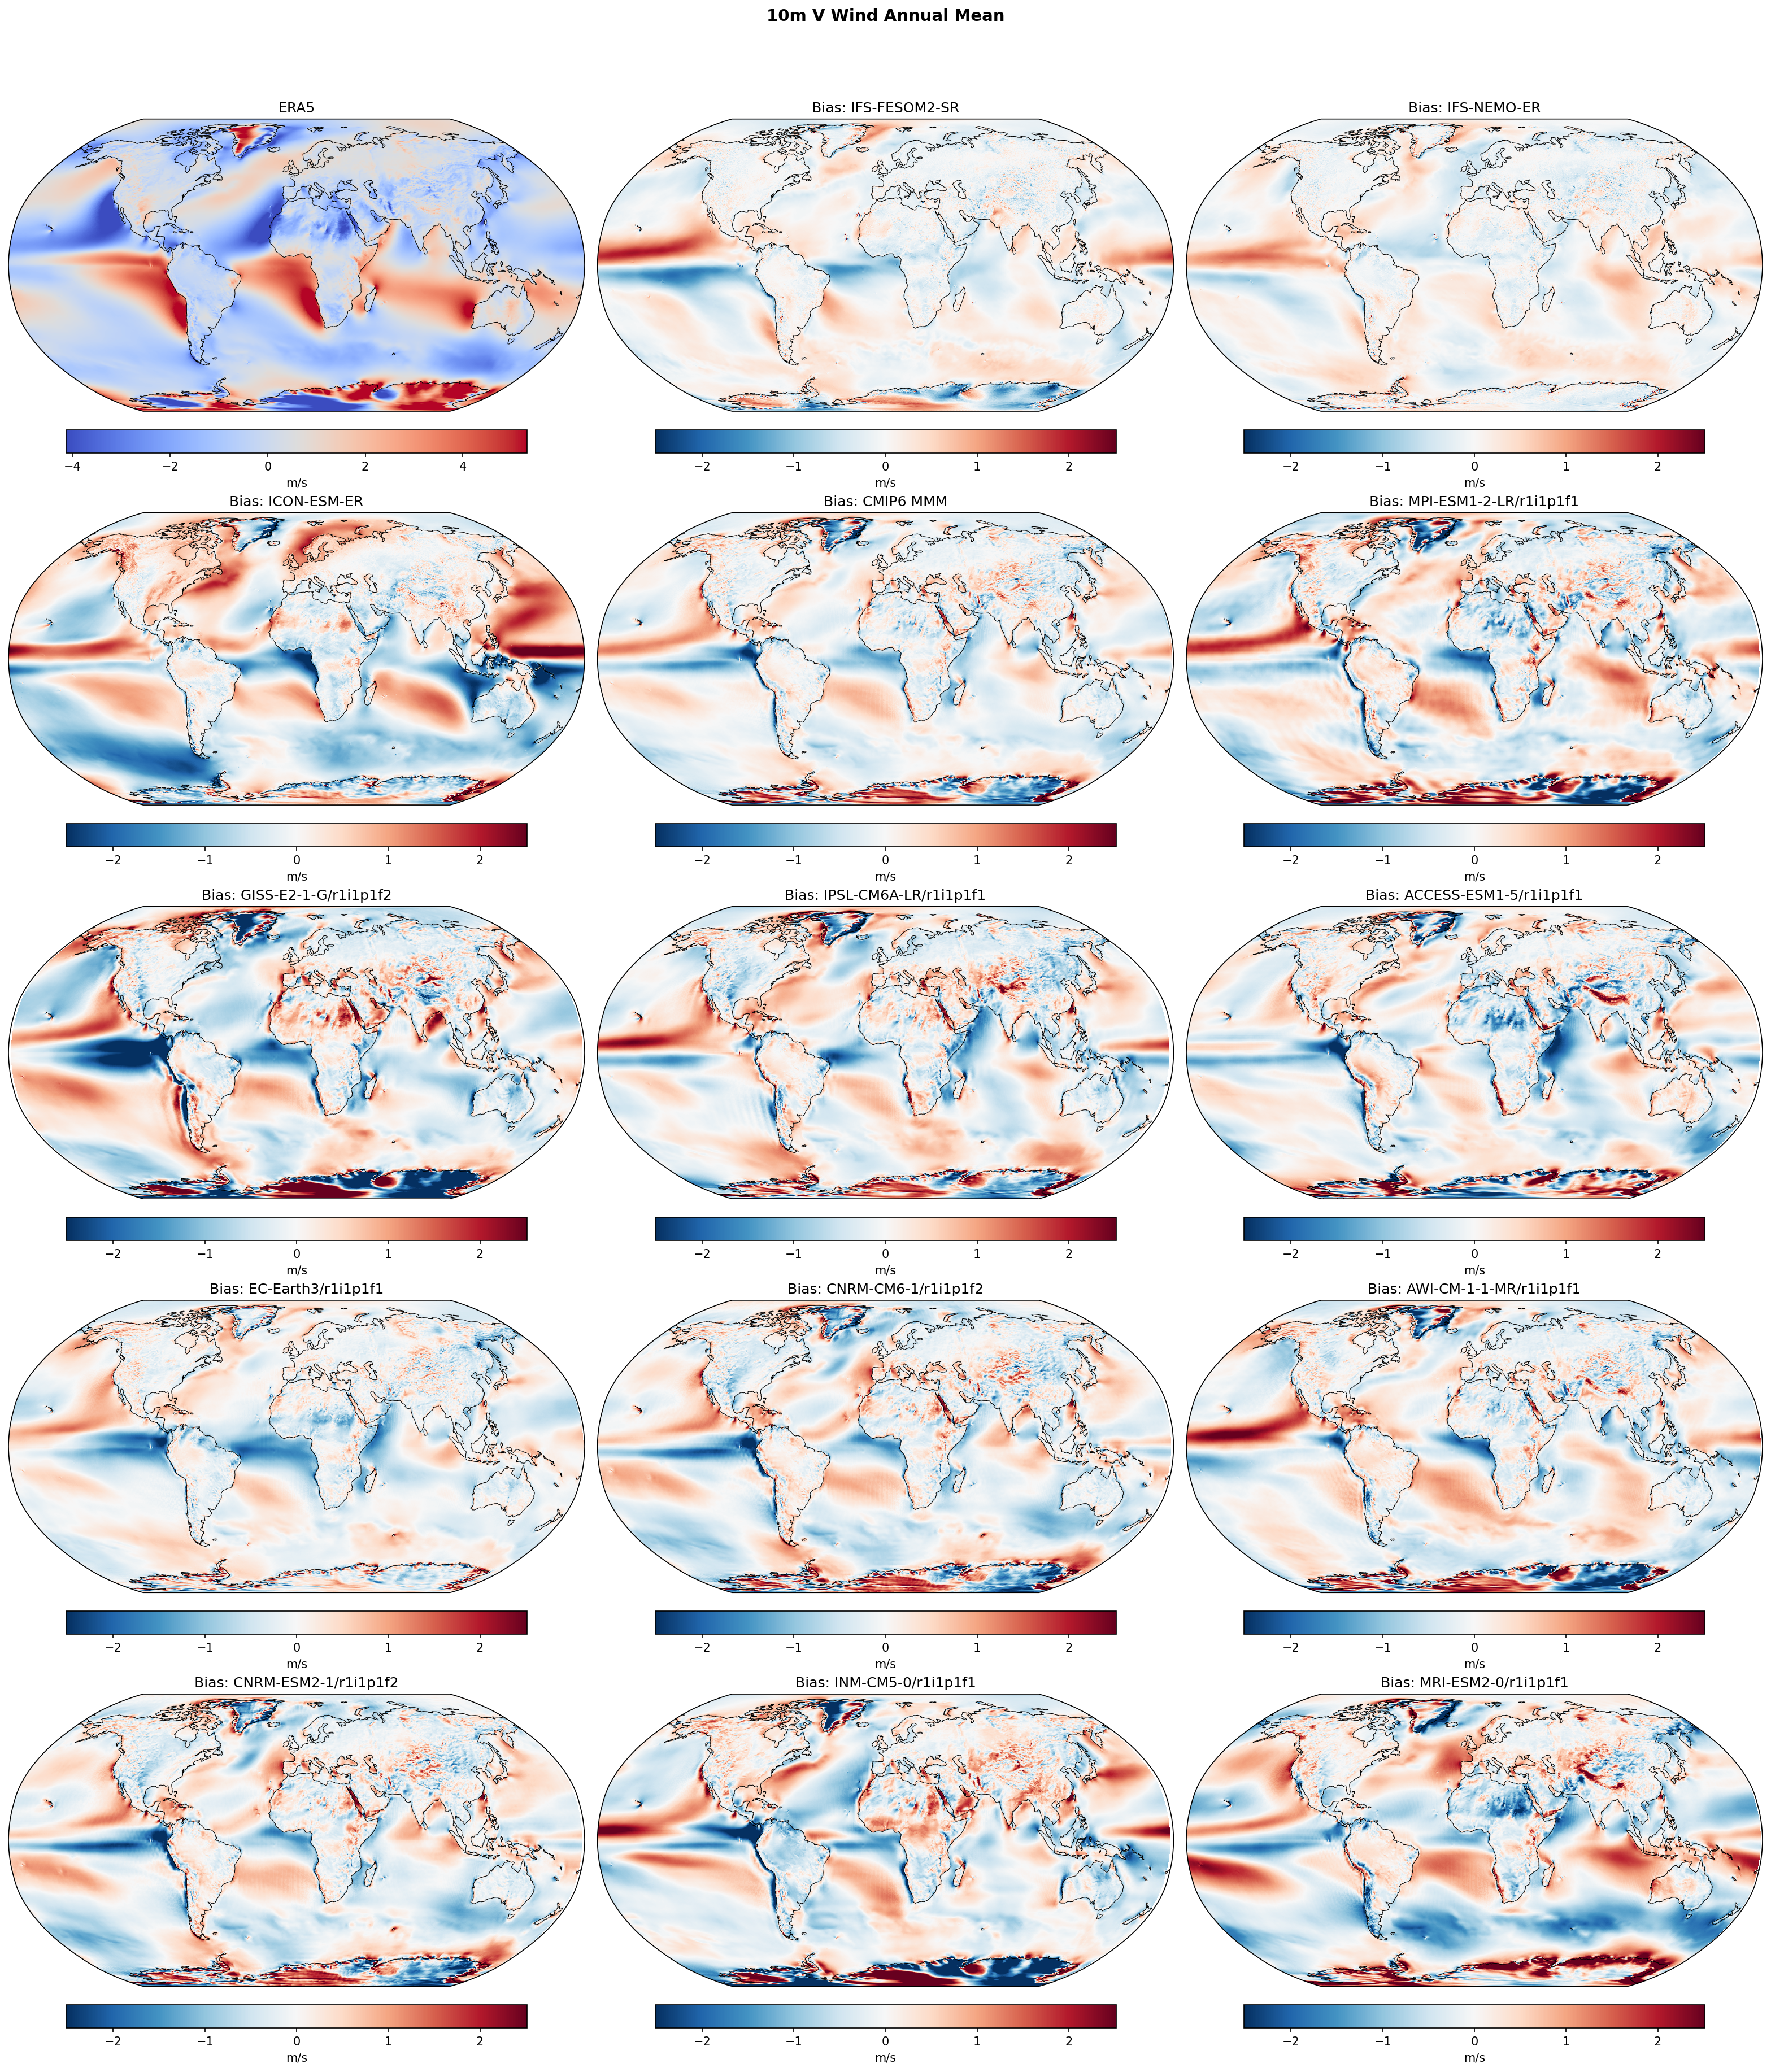
| Variables | vas |
|---|---|
| Models | IFS-FESOM2-SR, IFS-NEMO-ER, ICON-ESM-ER, HadGEM3-GC5, CMIP6 MMM, MPI-ESM1-2-LR/r1i1p1f1, GISS-E2-1-G/r1i1p1f2, IPSL-CM6A-LR/r1i1p1f1, ACCESS-ESM1-5/r1i1p1f1, EC-Earth3/r1i1p1f1, CNRM-CM6-1/r1i1p1f2, AWI-CM-1-1-MR/r1i1p1f1, CNRM-ESM2-1/r1i1p1f2, INM-CM5-0/r1i1p1f1, MRI-ESM2-0/r1i1p1f1 |
| Reference Dataset | ERA5 |
| Units | m/s |
| Period | 1980–2014 |
| IFS-FESOM2-SR | Global Mean Bias: -0.01 · Rmse: 0.46 |
| IFS-NEMO-ER | Global Mean Bias: 0.03 · Rmse: 0.34 |
| ICON-ESM-ER | Global Mean Bias: -0.06 · Rmse: 0.85 |
| HadGEM3-GC5 | Global Mean Bias: -0.05 · Rmse: 0.45 |
| CMIP6 MMM | Global Mean Bias: -0.05 · Rmse: 0.54 |
| MPI-ESM1-2-LR/r1i1p1f1 | Global Mean Bias: -0.00 · Rmse: 0.75 |
| GISS-E2-1-G/r1i1p1f2 | Global Mean Bias: -0.11 · Rmse: 0.94 |
| IPSL-CM6A-LR/r1i1p1f1 | Global Mean Bias: 0.01 · Rmse: 0.68 |
| ACCESS-ESM1-5/r1i1p1f1 | Global Mean Bias: -0.09 · Rmse: 0.70 |
| EC-Earth3/r1i1p1f1 | Global Mean Bias: -0.10 · Rmse: 0.52 |
| CNRM-CM6-1/r1i1p1f2 | Global Mean Bias: -0.06 · Rmse: 0.63 |
| AWI-CM-1-1-MR/r1i1p1f1 | Global Mean Bias: 0.01 · Rmse: 0.66 |
| CNRM-ESM2-1/r1i1p1f2 | Global Mean Bias: -0.06 · Rmse: 0.63 |
| INM-CM5-0/r1i1p1f1 | Global Mean Bias: -0.06 · Rmse: 0.87 |
| MRI-ESM2-0/r1i1p1f1 | Global Mean Bias: -0.04 · Rmse: 0.89 |
Summary high
This diagnostic evaluates annual mean meridional (10m V) wind biases against ERA5. The high-resolution IFS-NEMO-ER model demonstrates superior performance with minimal global bias (RMSE 0.34 m/s), significantly outperforming both the CMIP6 ensemble and the high-resolution ICON-ESM-ER, which exhibits severe zonal and tropical circulation errors.
Key Findings
- IFS-NEMO-ER achieves the lowest global RMSE (0.34 m/s), effectively eliminating the large-scale systematic biases seen in CMIP6 models and ICON-ESM-ER.
- ICON-ESM-ER, despite its high resolution, performs poorly (RMSE 0.85 m/s), displaying strong zonal banding in the Southern Ocean and excessive southerly flow in the tropical Pacific, resembling the biases of lower-performing CMIP6 models like MRI-ESM2-0.
- IFS-FESOM2-SR performs well (RMSE 0.46 m/s) but introduces a distinct negative bias (excessive northerly flow) in the tropical North Atlantic trade wind region compared to the NEMO configuration.
- Most CMIP6 models and ICON-ESM-ER show dipolar bias patterns in the tropical Pacific, indicative of errors in ITCZ positioning and Hadley cell intensity.
Spatial Patterns
The IFS-NEMO-ER map is largely neutral (white). In contrast, ICON-ESM-ER shows a distinct negative bias band around 50°S and positive bias around 60°S in the Southern Ocean, suggesting a meridional shift in the westerlies. In the tropical Southeast Pacific, ICON and several CMIP6 models (e.g., GISS-E2-1-G, MRI-ESM2-0) display strong positive biases (red), indicating overly strong southerly trade winds flowing into the ITCZ.
Model Agreement
There is a stark divergence between the IFS family (high agreement with observations) and ICON-ESM-ER (poor agreement). EC-Earth3 (standard resolution) performs surprisingly well (RMSE 0.52 m/s), outperforming the high-res ICON and the CMIP6 MMM, suggesting that resolution alone does not guarantee correct surface circulation.
Physical Interpretation
The positive V-wind biases in the Southeast Pacific (seen in ICON and CMIP6) correspond to stronger-than-observed southerly cross-equatorial flow, a common symptom of the 'Double ITCZ' syndrome where the ITCZ is often too strong or displaced. The contrast between IFS-NEMO and IFS-FESOM suggests that ocean coupling (surface currents/temperature gradients) significantly influences atmospheric low-level winds. ICON's Southern Ocean dipole suggests a structural error in the placement of the Ferrel/Polar cell boundary.
Caveats
- The analysis is based on annual means, which may mask seasonal biases in ITCZ migration.
- RMSE values aggregate global errors; regional biases in key upwelling zones might be physically more significant than the global average suggests.
10m V Wind DJF Bias
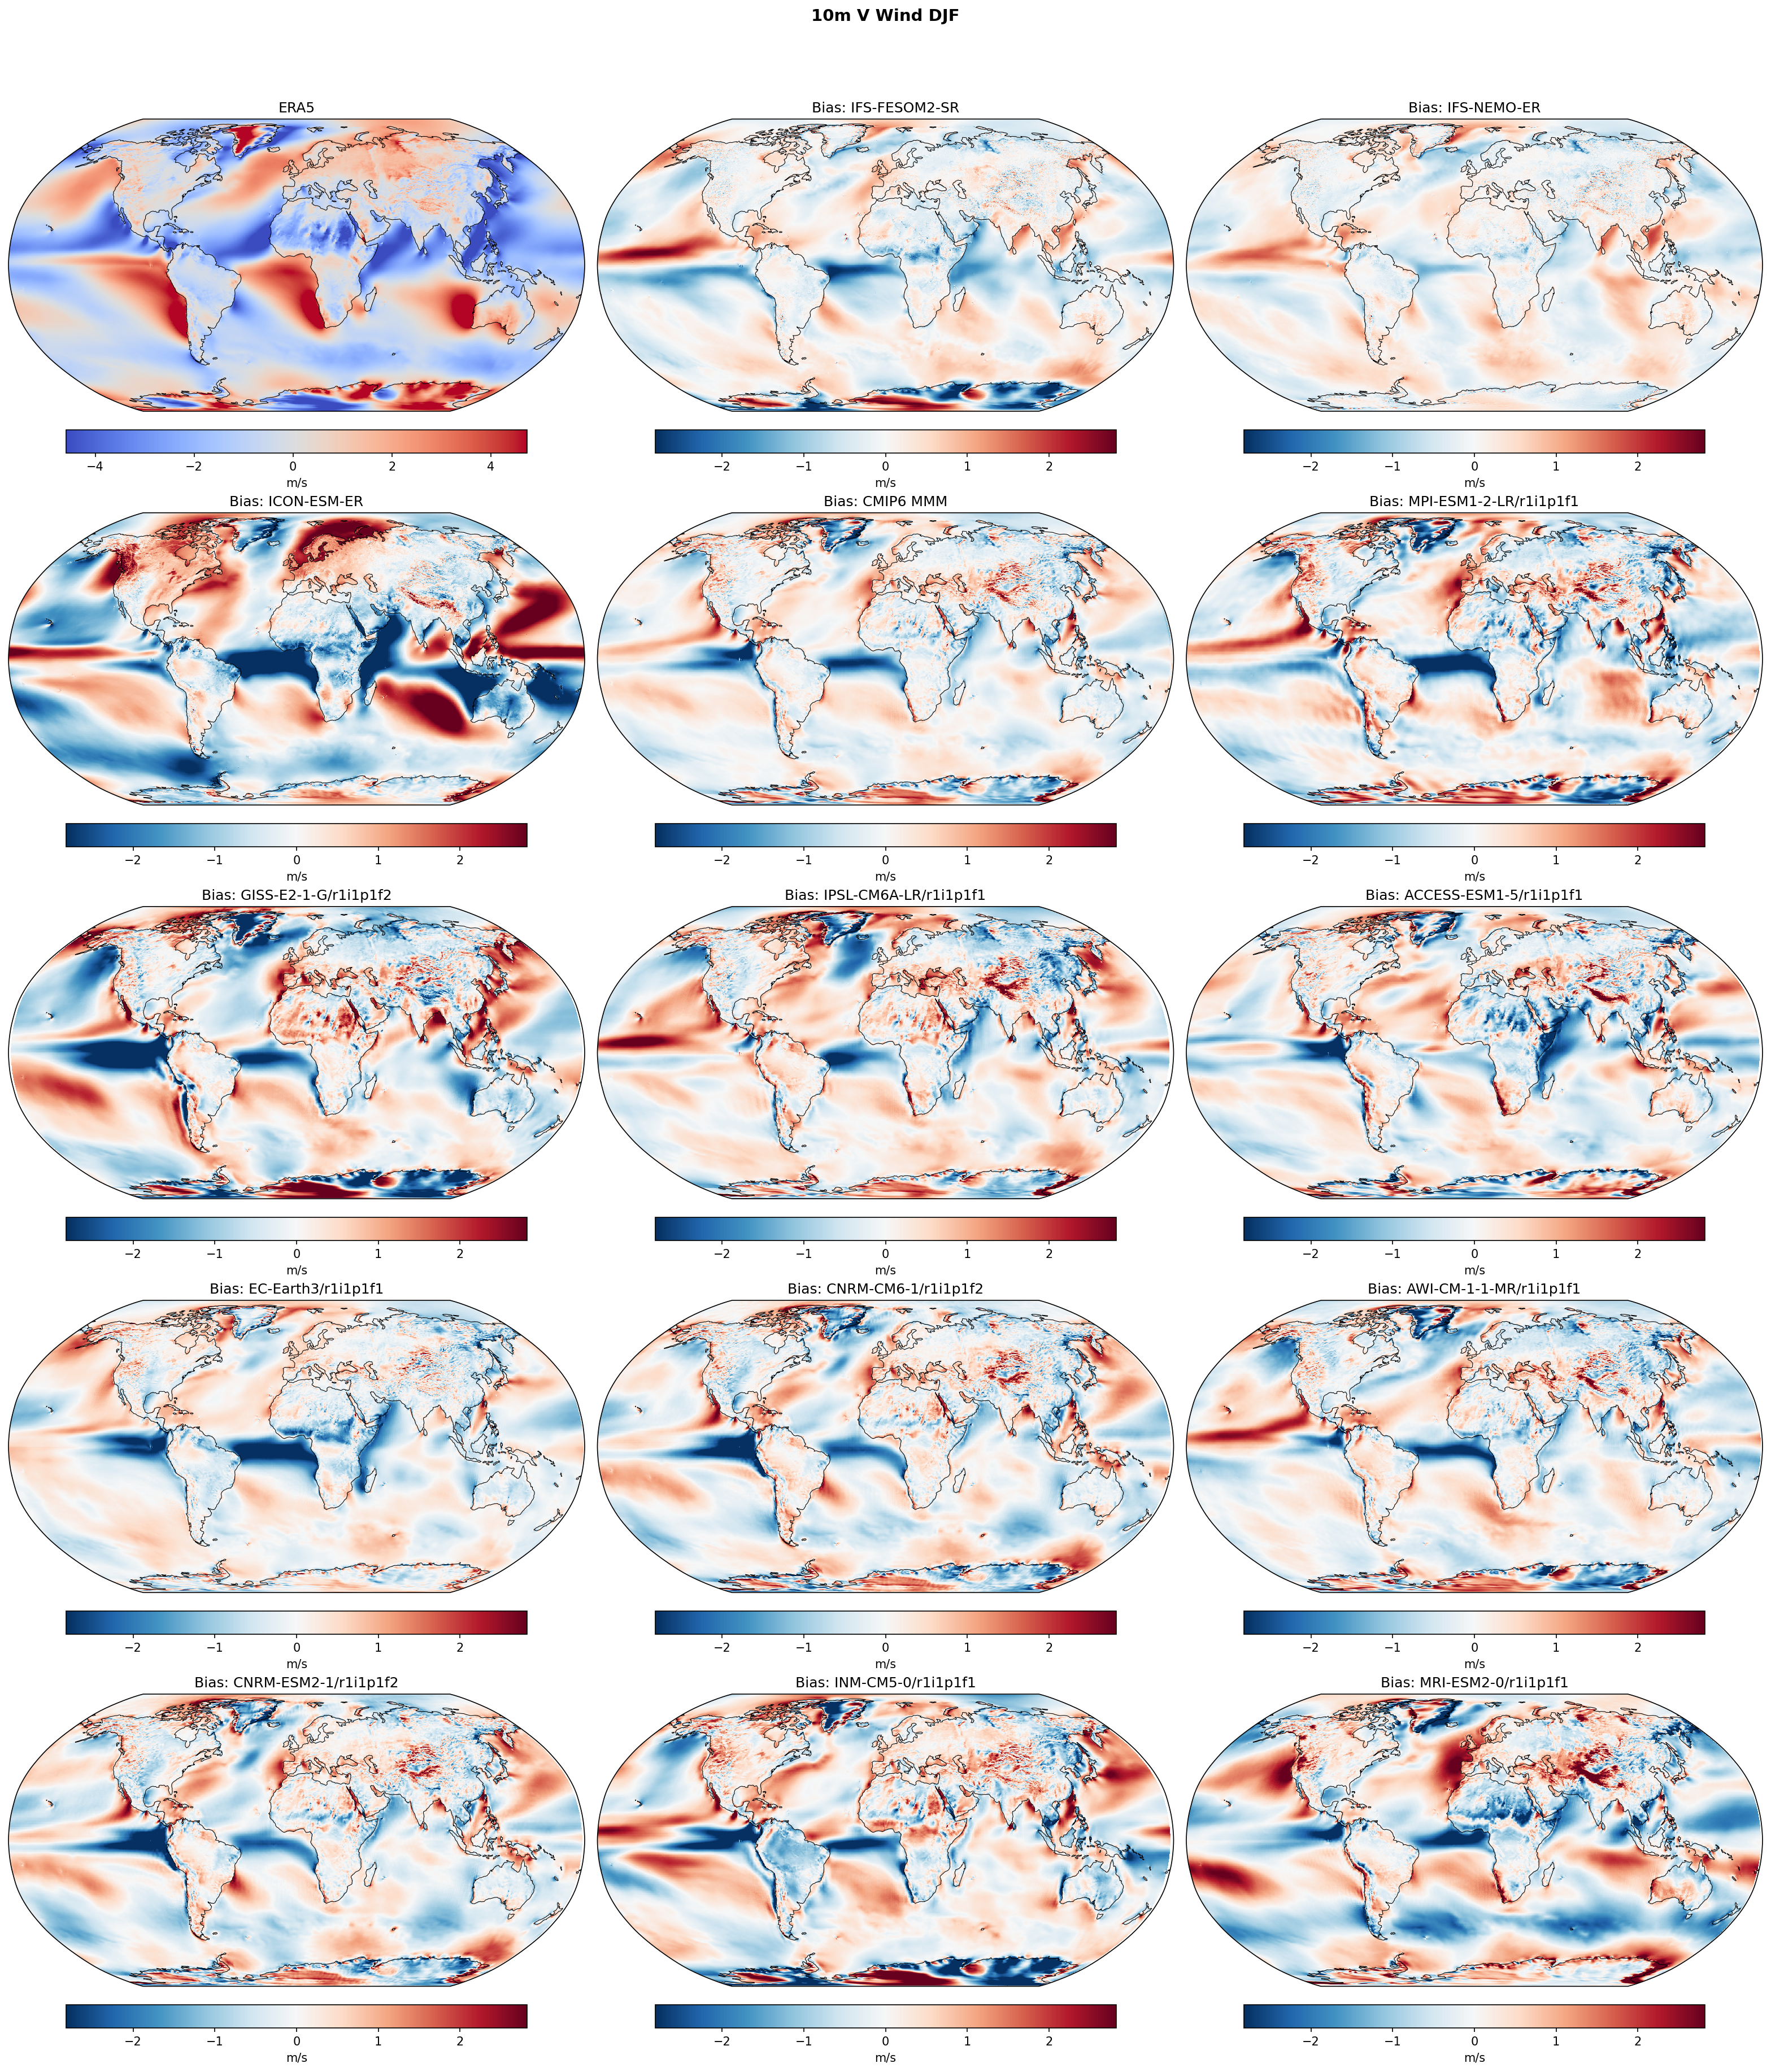
| Variables | vas |
|---|---|
| Models | IFS-FESOM2-SR, IFS-NEMO-ER, ICON-ESM-ER, HadGEM3-GC5, CMIP6 MMM, MPI-ESM1-2-LR/r1i1p1f1, GISS-E2-1-G/r1i1p1f2, IPSL-CM6A-LR/r1i1p1f1, ACCESS-ESM1-5/r1i1p1f1, EC-Earth3/r1i1p1f1, CNRM-CM6-1/r1i1p1f2, AWI-CM-1-1-MR/r1i1p1f1, CNRM-ESM2-1/r1i1p1f2, INM-CM5-0/r1i1p1f1, MRI-ESM2-0/r1i1p1f1 |
| Reference Dataset | ERA5 |
| Units | m/s |
| Period | 1980–2014 |
| CMIP6 MMM | Global Mean Bias: -0.06 · Rmse: None |
| MPI-ESM1-2-LR/r1i1p1f1 | Global Mean Bias: -0.08 · Rmse: None |
| GISS-E2-1-G/r1i1p1f2 | Global Mean Bias: -0.09 · Rmse: None |
| IPSL-CM6A-LR/r1i1p1f1 | Global Mean Bias: 0.09 · Rmse: None |
| ACCESS-ESM1-5/r1i1p1f1 | Global Mean Bias: -0.07 · Rmse: None |
| EC-Earth3/r1i1p1f1 | Global Mean Bias: -0.13 · Rmse: None |
| CNRM-CM6-1/r1i1p1f2 | Global Mean Bias: -0.07 · Rmse: None |
| AWI-CM-1-1-MR/r1i1p1f1 | Global Mean Bias: -0.06 · Rmse: None |
| CNRM-ESM2-1/r1i1p1f2 | Global Mean Bias: -0.08 · Rmse: None |
| INM-CM5-0/r1i1p1f1 | Global Mean Bias: -0.00 · Rmse: None |
| MRI-ESM2-0/r1i1p1f1 | Global Mean Bias: -0.09 · Rmse: None |
Summary high
This figure evaluates DJF 10m meridional (V) wind biases relative to ERA5. While the IFS and HadGEM3 high-resolution models exhibit moderate biases sharing systematic tropical features with the CMIP6 ensemble, ICON-ESM-ER stands out with severe large-scale circulation errors in the extratropics.
Key Findings
- Systematic positive bias in Northern Hemisphere tropical trade winds: Most models (IFS variants, HadGEM3, CMIP6 MMM) show positive biases (red) in the tropical North Pacific and Atlantic. Since observed DJF trades are northerly (negative V), this indicates a systematic weakening of the trade winds.
- IFS model consistency: IFS-FESOM2-SR and IFS-NEMO-ER display nearly identical bias patterns, suggesting that the atmospheric component (IFS) dictates surface wind errors rather than the ocean model formulation (unstructured FESOM vs structured NEMO).
- ICON-ESM-ER outlier status: ICON-ESM-ER exhibits dramatically larger biases than other EERIE models, with saturated errors (>2 m/s) in the North Atlantic, North Pacific, and Southern Ocean, indicative of major distortions in standing wave patterns and jet stream placement.
- Resolution effects: While high-resolution models (IFS, HadGEM3) resolve finer-scale bias structures compared to coarser CMIP6 models (e.g., GISS-E2-1-G), the sign and location of tropical errors remain consistent, pointing to persistent parametric or dynamical deficiencies independent of resolution.
Spatial Patterns
The dominant systematic error is a zonal band of positive bias (weakened northerly flow) just north of the equator in the Pacific and Atlantic, likely associated with ITCZ positioning or Hadley cell strength. In the extratropics, biases manifest as dipole or wave-like structures (alternating red/blue), representing phase shifts in stationary Rossby waves and storm tracks, particularly evident in the Southern Ocean westerlies.
Model Agreement
There is high agreement between the two IFS configurations. HadGEM3-GC5 agrees well with the IFS models in terms of magnitude and pattern (moderate biases). ICON-ESM-ER disagrees significantly with the group, showing much higher RMSE. The CMIP6 MMM smooths out individual variability but confirms the tropical trade wind weakening is a robust multi-model systematic error.
Physical Interpretation
The positive V-wind bias in the NH tropics implies the southward branch of the winter Hadley cell is too weak or the ITCZ is displaced northward (a common 'double ITCZ' symptom). The large-scale extratropical biases, particularly in ICON, suggest errors in the meridional position of the jet streams or the amplitude of stationary planetary waves, which drive the meridional exchange of air masses.
Caveats
- Biases in 10m wind are sensitive to surface drag and boundary layer parameterizations, not just free-tropospheric circulation.
- The saturation of the color scale for ICON-ESM-ER masks the true magnitude of its peak errors.
10m V Wind JJA Bias
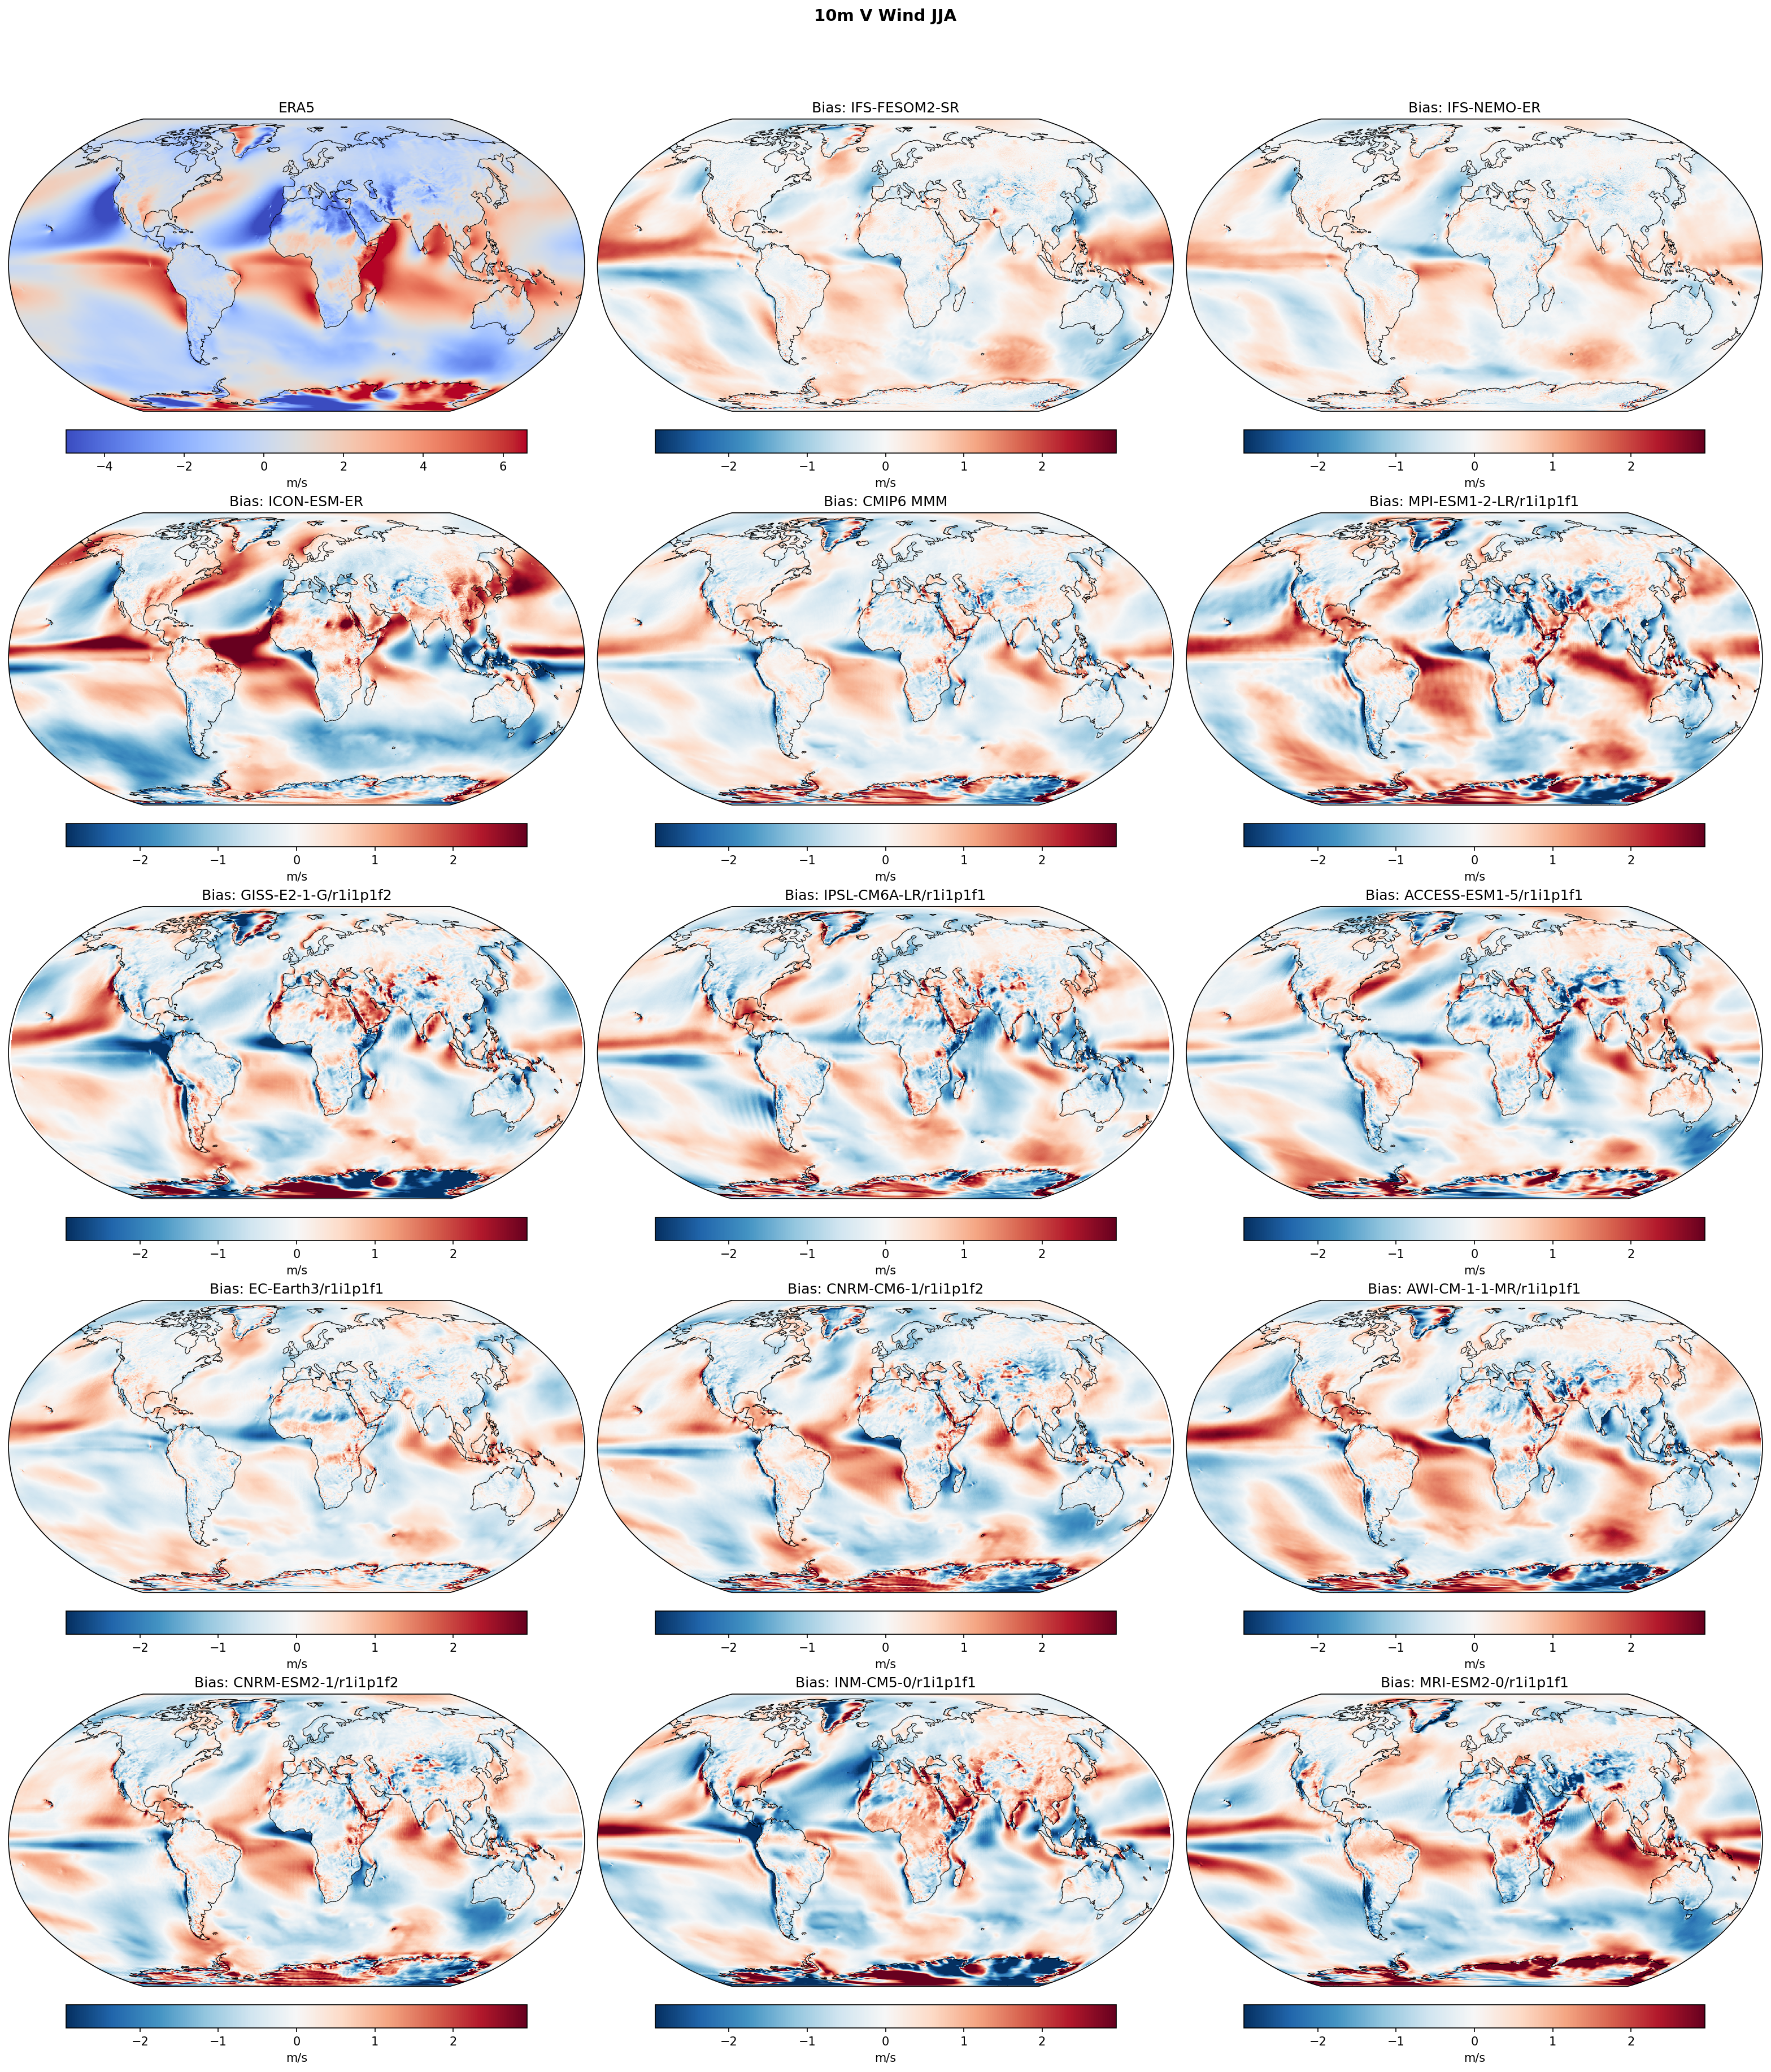
| Variables | vas |
|---|---|
| Models | IFS-FESOM2-SR, IFS-NEMO-ER, ICON-ESM-ER, HadGEM3-GC5, CMIP6 MMM, MPI-ESM1-2-LR/r1i1p1f1, GISS-E2-1-G/r1i1p1f2, IPSL-CM6A-LR/r1i1p1f1, ACCESS-ESM1-5/r1i1p1f1, EC-Earth3/r1i1p1f1, CNRM-CM6-1/r1i1p1f2, AWI-CM-1-1-MR/r1i1p1f1, CNRM-ESM2-1/r1i1p1f2, INM-CM5-0/r1i1p1f1, MRI-ESM2-0/r1i1p1f1 |
| Reference Dataset | ERA5 |
| Units | m/s |
| Period | 1980–2014 |
| CMIP6 MMM | Global Mean Bias: -0.03 · Rmse: None |
| MPI-ESM1-2-LR/r1i1p1f1 | Global Mean Bias: 0.09 · Rmse: None |
| GISS-E2-1-G/r1i1p1f2 | Global Mean Bias: -0.11 · Rmse: None |
| IPSL-CM6A-LR/r1i1p1f1 | Global Mean Bias: -0.06 · Rmse: None |
| ACCESS-ESM1-5/r1i1p1f1 | Global Mean Bias: -0.08 · Rmse: None |
| EC-Earth3/r1i1p1f1 | Global Mean Bias: -0.04 · Rmse: None |
| CNRM-CM6-1/r1i1p1f2 | Global Mean Bias: -0.02 · Rmse: None |
| AWI-CM-1-1-MR/r1i1p1f1 | Global Mean Bias: 0.06 · Rmse: None |
| CNRM-ESM2-1/r1i1p1f2 | Global Mean Bias: -0.03 · Rmse: None |
| INM-CM5-0/r1i1p1f1 | Global Mean Bias: -0.12 · Rmse: None |
| MRI-ESM2-0/r1i1p1f1 | Global Mean Bias: 0.03 · Rmse: None |
Summary high
This diagnostic evaluates JJA 10m meridional (V) wind biases relative to ERA5. The high-resolution IFS and HadGEM3 models demonstrate reduced systematic errors compared to the CMIP6 Multi-Model Mean and ICON-ESM-ER, particularly in capturing the intensity of major monsoon circulations.
Key Findings
- The Somali Jet (South Asian Monsoon) is systematically underestimated (blue/northerly bias in the Arabian Sea) in the CMIP6 MMM and ICON-ESM-ER, while IFS-FESOM2-SR, IFS-NEMO-ER, and HadGEM3-GC5 capture this feature with significantly lower bias.
- A pervasive dipole bias exists in the tropical Atlantic (negative bias north of equator, positive south) across most CMIP6 models and ICON-ESM-ER, indicating a southward shift of the ITCZ or weak northward penetration of the West African Monsoon; this is notably improved in the IFS configurations.
- ICON-ESM-ER exhibits high-magnitude biases globally compared to the other EERIE models (IFS, HadGEM3), with particularly strong discrepancies over the Asian landmass and tropical oceans.
- The two IFS configurations (FESOM2 vs NEMO) show very similar atmospheric wind bias patterns, suggesting that the ocean model grid/physics is secondary to the atmospheric formulation in driving these surface wind errors.
Spatial Patterns
The dominant spatial features are zonal dipole structures in the tropics related to ITCZ positioning and large-scale negative biases in the western Indian Ocean (weak Somali Jet). High-resolution models (IFS, HadGEM3) show finer-scale, eddy-like bias structures in the Southern Ocean, whereas lower-resolution CMIP6 models display broader, smoother error patterns.
Model Agreement
There is a distinct divergence in performance among the high-resolution EERIE models: IFS-FESOM2-SR, IFS-NEMO-ER, and HadGEM3-GC5 show strong agreement with observations (low bias), whereas ICON-ESM-ER diverges significantly, showing errors similar to or exceeding the poorer-performing standard-resolution CMIP6 models.
Physical Interpretation
The negative V-wind bias in the Arabian Sea during JJA represents a weakening of the cross-equatorial Somali Jet, a critical driver of Indian Summer Monsoon rainfall. The Atlantic dipole suggests a failure to fully advect moisture northward into the Sahel (West African Monsoon). The reduced biases in IFS and HadGEM3 suggest that their combination of resolution and physics better maintains the meridional pressure gradients required to drive these cross-equatorial flows.
Caveats
- 10m winds over high orography (e.g., Himalayas in ICON bias) are sensitive to vertical interpolation and surface drag parameterizations.
- Biases are shown relative to ERA5; while robust, reanalysis surface winds over the open ocean are themselves modeled products constrained by sparse observations.