Ocean Surface Ocean SST Evaluation
Synthesis
Related diagnostics
SST Annual Mean Bias
| Variables | tos |
|---|---|
| Models | IFS-FESOM2-SR, IFS-NEMO-ER, ICON-ESM-ER, HadGEM3-GC5 |
| Reference Dataset | ESA-CCI L4 v3.0.1 |
| Units | K |
| Period | 1980–2014 |
| IFS-FESOM2-SR | Global Mean Bias: -0.06 · Rmse: 0.84 |
| IFS-NEMO-ER | Global Mean Bias: -0.92 · Rmse: 1.16 |
| ICON-ESM-ER | Global Mean Bias: -0.23 · Rmse: 1.66 |
| HadGEM3-GC5 | Global Mean Bias: 0.45 · Rmse: 0.83 |
Summary high
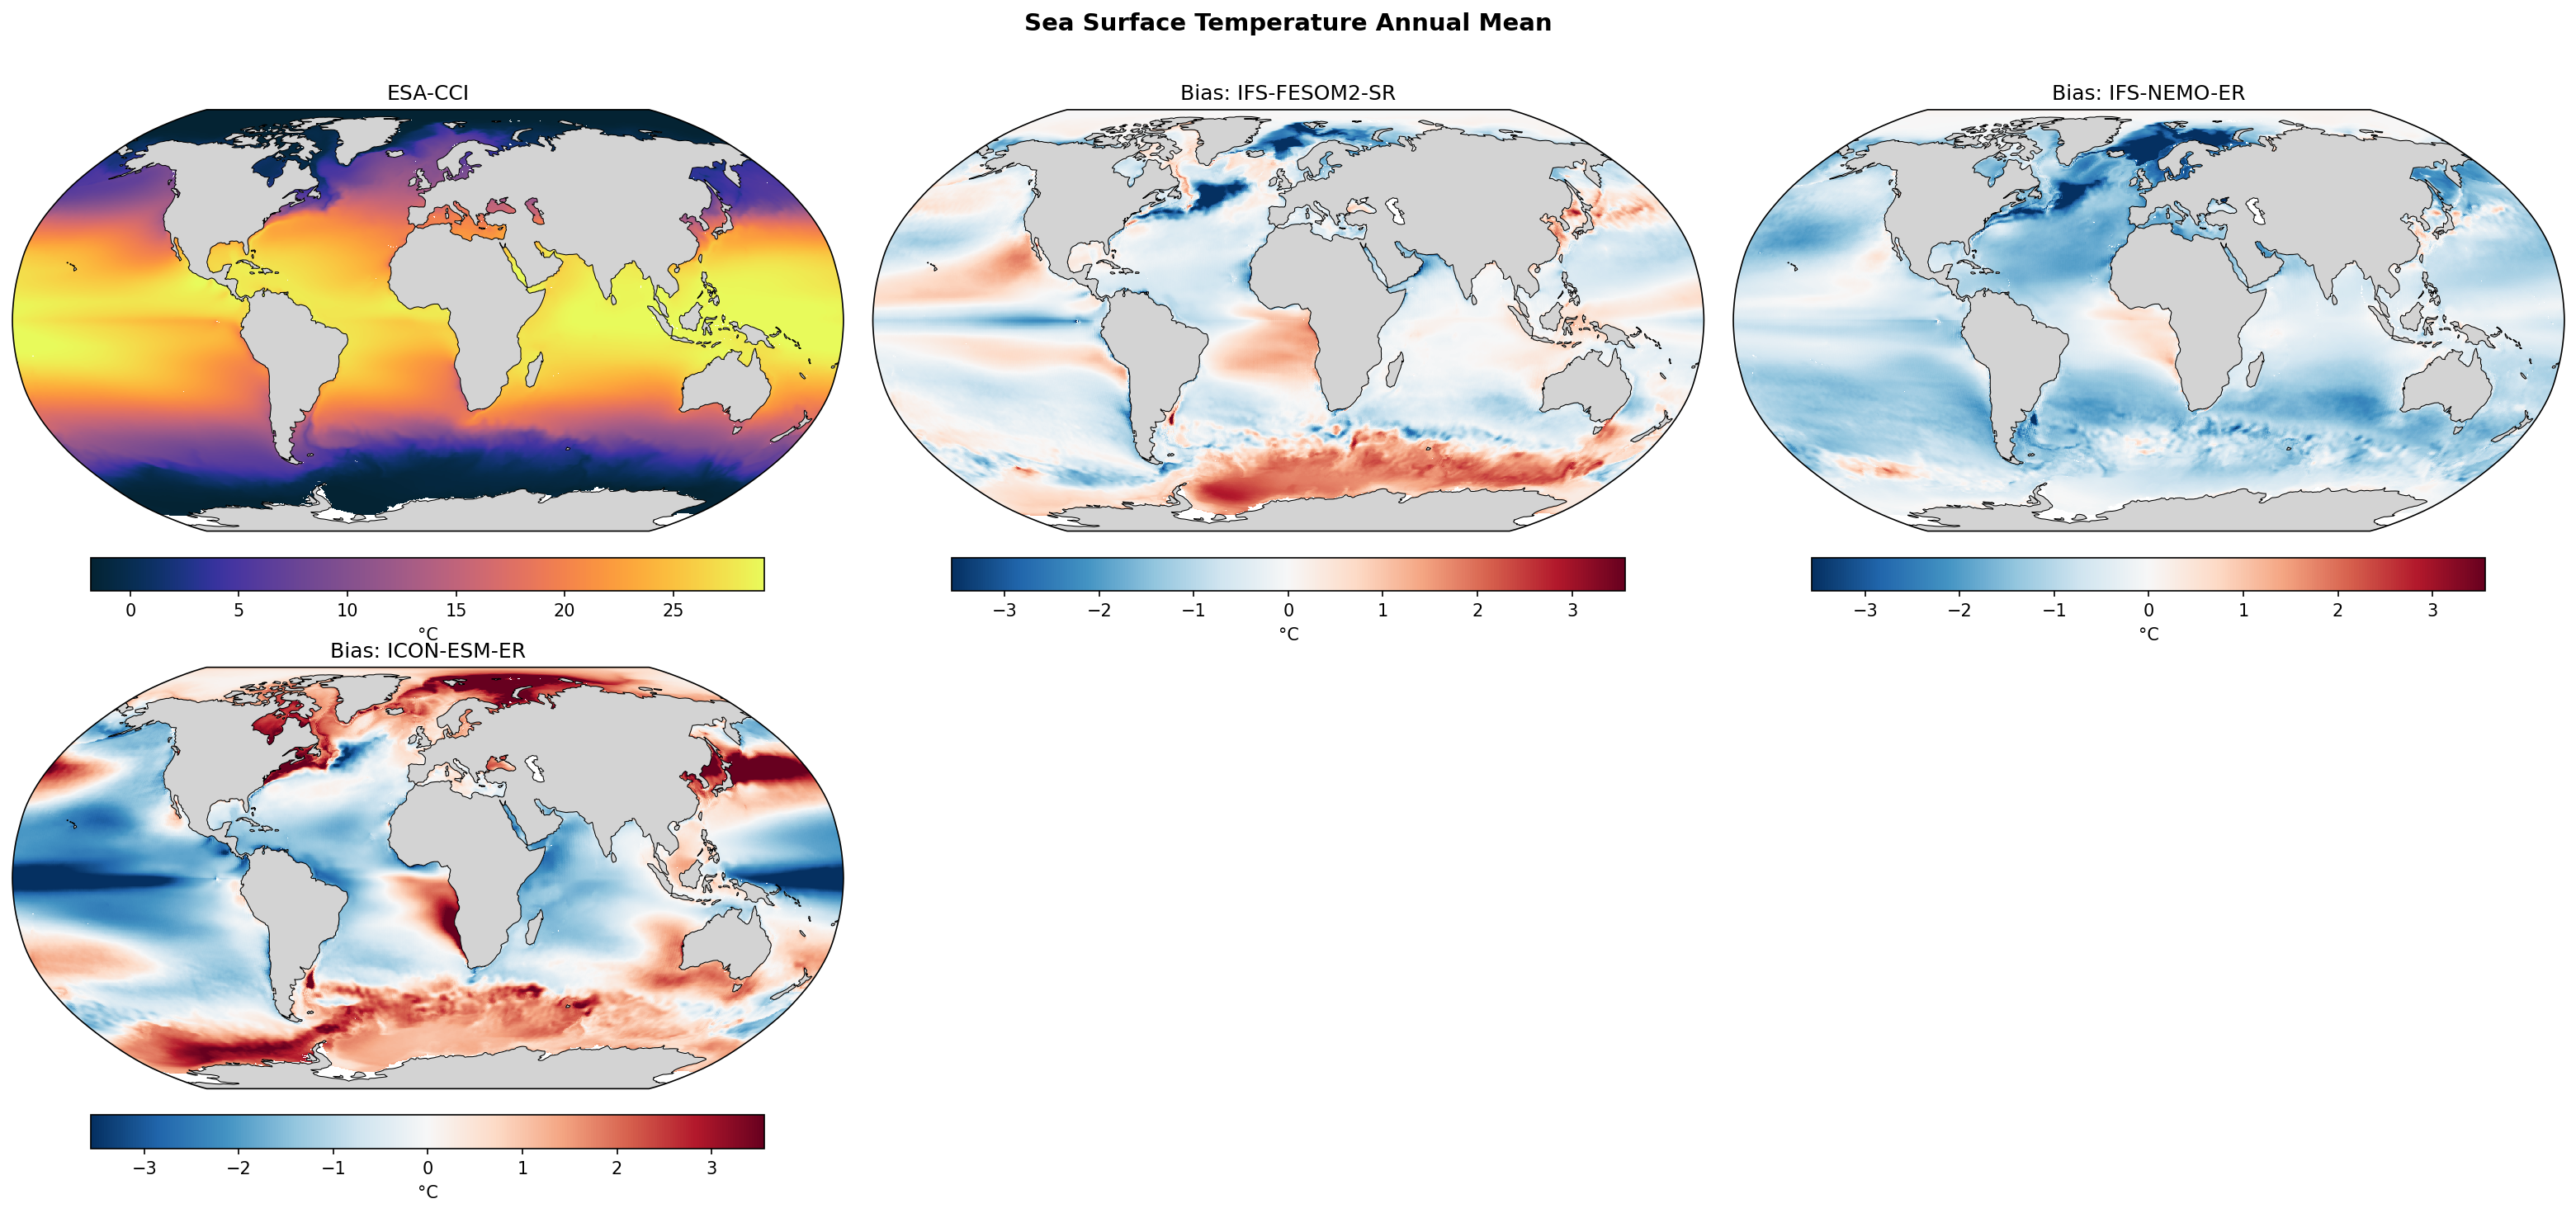
This figure evaluates Annual Mean Sea Surface Temperature (SST) biases in four high-resolution coupled models against ESA-CCI satellite observations (1980–2014). The models exhibit divergent mean states, ranging from a strong systematic cold bias in IFS-NEMO-ER to intense regional dipoles in ICON-ESM-ER.
Key Findings
- IFS-NEMO-ER is distinct outliers with a systematic global cold bias (mean -0.92 K) affecting all basins.
- ICON-ESM-ER shows the largest regional biases (RMSE 1.66 K), characterized by intense warm biases (>3 K) in Western Boundary Current extensions (Gulf Stream, Kuroshio) and eastern boundary upwelling zones (Benguela, Peru).
- IFS-FESOM2-SR and HadGEM3-GC5 achieve the lowest RMSE (~0.83–0.84 K), though HadGEM3-GC5 has a general warm bias (+0.45 K) while IFS-FESOM2-SR has a near-zero global mean bias (-0.06 K).
- A notable warm bias band in the Southern Ocean (~50°S–60°S) is present in IFS-FESOM2-SR, ICON-ESM-ER, and HadGEM3-GC5, contrasting with the cold bias in IFS-NEMO-ER.
Spatial Patterns
Biases are strongly regionally structured. In the North Atlantic, dipole patterns indicative of Gulf Stream separation errors are visible, particularly in ICON-ESM-ER (too zonal/warm extension) and HadGEM3-GC5. The 'North Atlantic warming hole' region (subpolar gyre) is consistently cold across most models. Eastern boundary upwelling regions (off Africa and South America) show classic warm biases in ICON-ESM-ER and HadGEM3-GC5, suggesting that even at ~10km ocean resolution, coastal upwelling processes or associated cloud feedbacks remain challenging.
Model Agreement
Inter-model agreement is low regarding the global mean state, with a >1.3 K spread between the coldest (IFS-NEMO-ER) and warmest (HadGEM3-GC5) models. However, models (excluding IFS-NEMO) agree on specific bias structures: warm Southern Ocean, cold subpolar North Atlantic, and warm biases in major upwelling zones.
Physical Interpretation
The intense dipoles in ICON-ESM-ER suggest misrepresentation of Western Boundary Current pathways (likely overshooting or failing to detach correctly) and insufficient cooling in upwelling zones. The systematic coldness in IFS-NEMO-ER points to a global energy imbalance or initialization drift rather than a specific regional dynamic failure. The Southern Ocean warm bias common to three models often stems from shortwave radiation errors (insufficient cloud reflection) or shallow mixed layer depths.
Caveats
- The strong mean cooling in IFS-NEMO-ER suggests a drift that might obscure regional dynamic biases.
- Biases in Western Boundary Currents are highly sensitive to the exact observation period and internal variability of eddy paths.
SST DJF Bias
| Variables | tos |
|---|---|
| Models | IFS-FESOM2-SR, IFS-NEMO-ER, ICON-ESM-ER, HadGEM3-GC5 |
| Reference Dataset | ESA-CCI L4 v3.0.1 |
| Units | K |
| Period | 1980–2014 |
| IFS-FESOM2-SR | Global Mean Bias: 0.06 · Rmse: 1.21 |
| IFS-NEMO-ER | Global Mean Bias: -0.94 · Rmse: 1.22 |
| ICON-ESM-ER | Global Mean Bias: -0.20 · Rmse: 2.00 |
| HadGEM3-GC5 | Global Mean Bias: 0.50 · Rmse: 0.89 |
Summary high
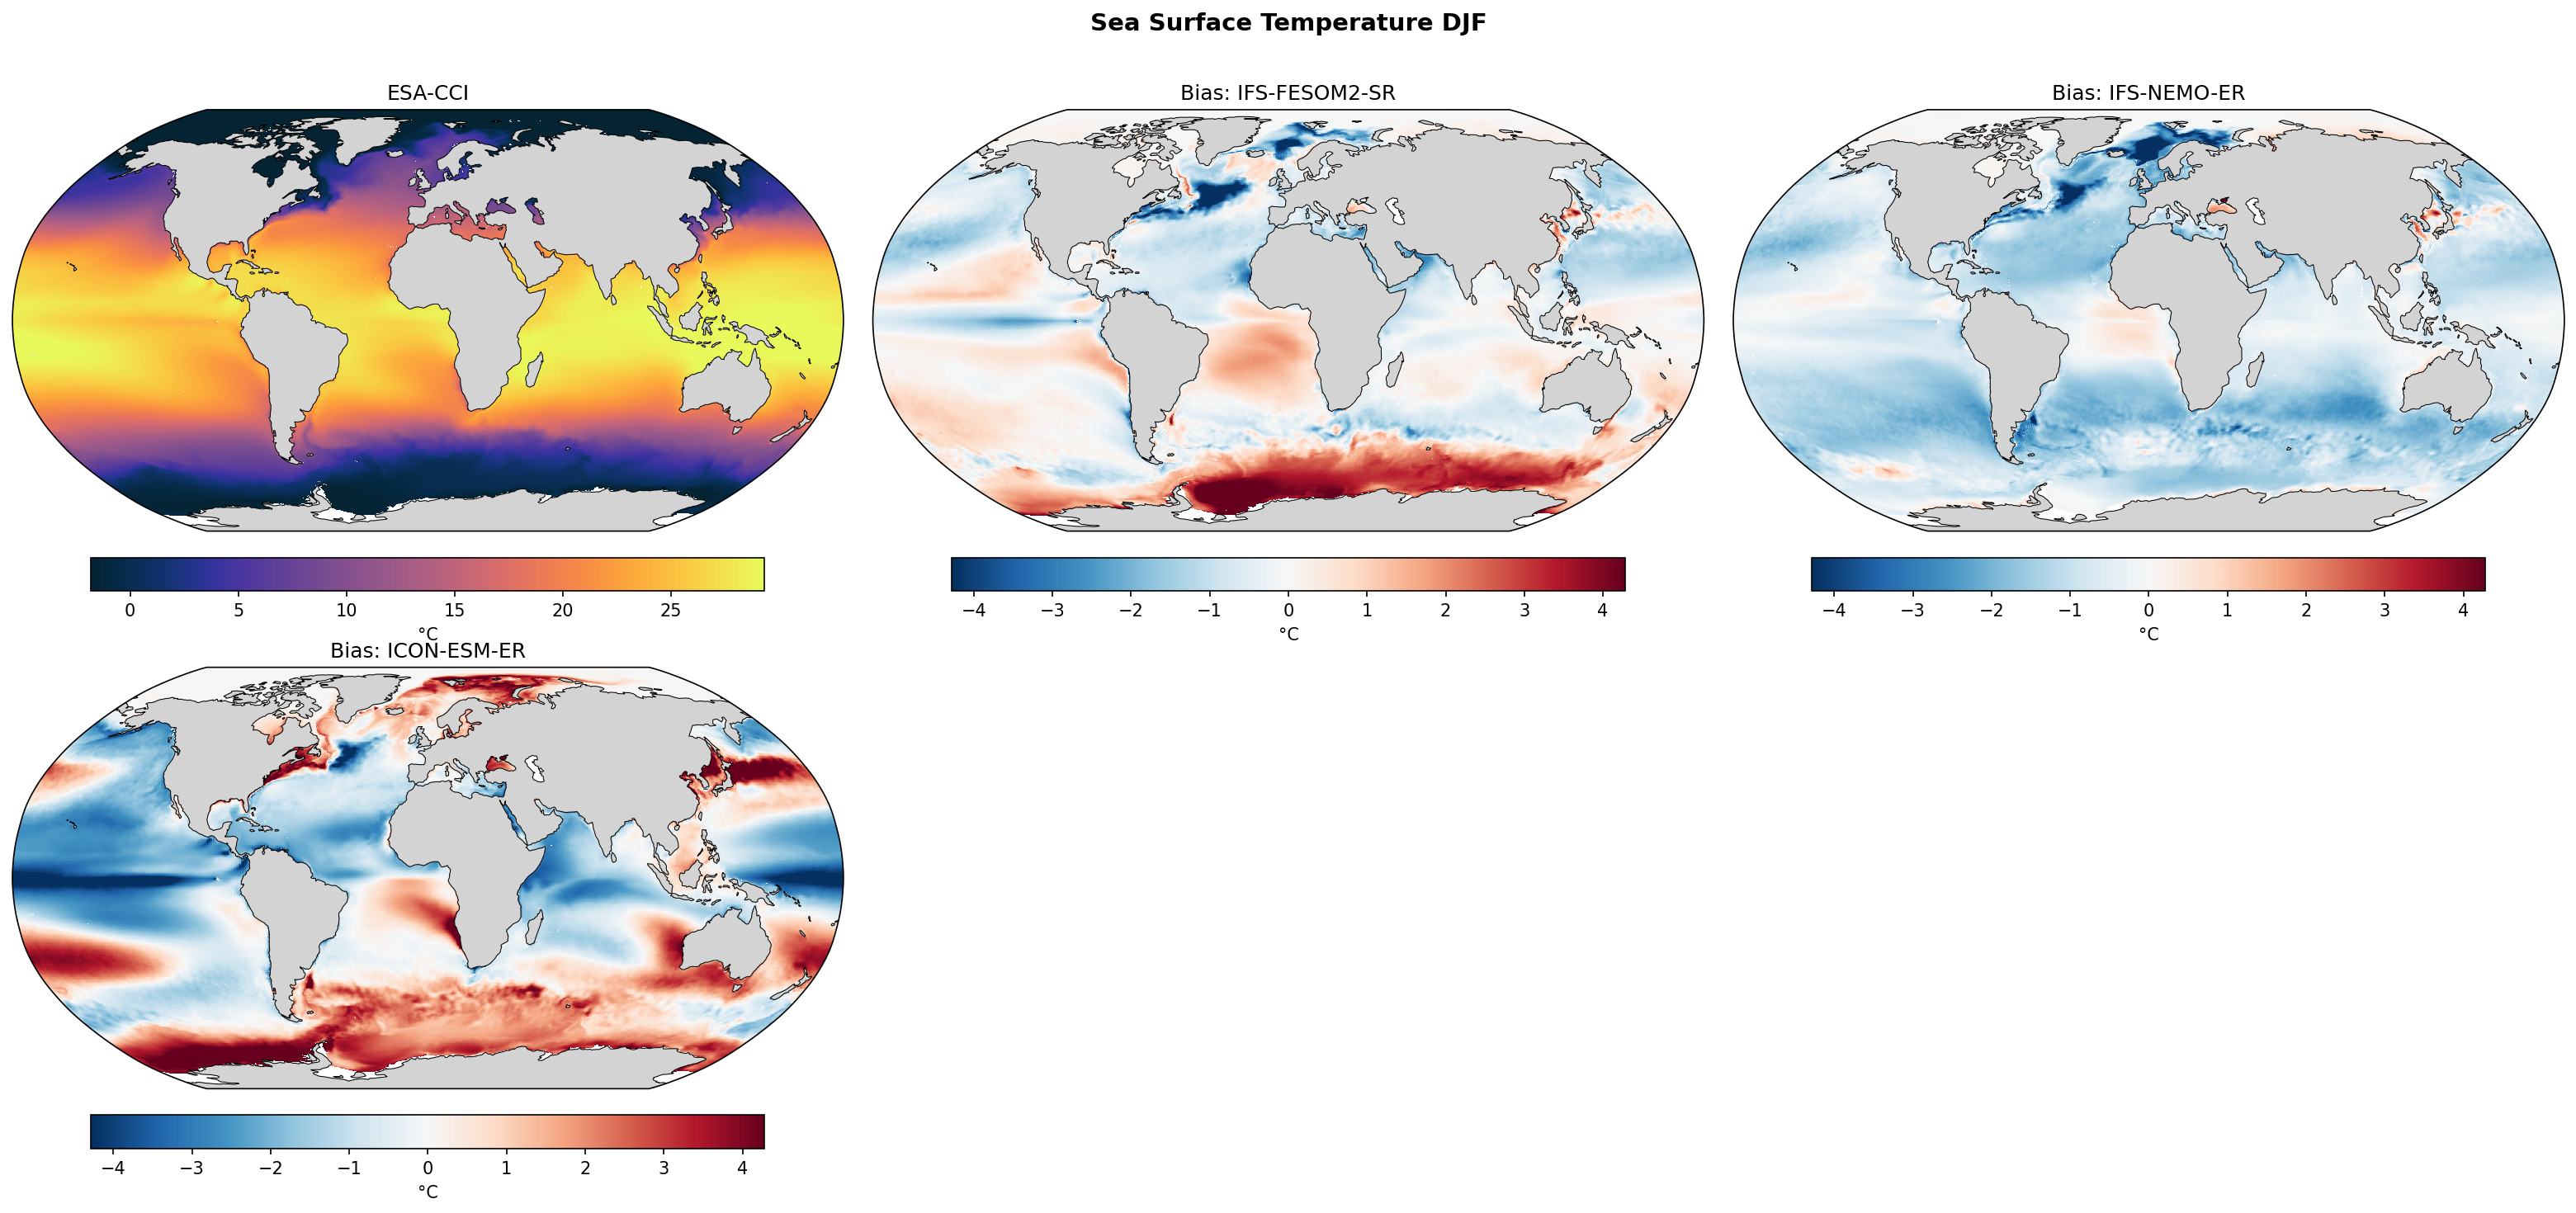
This figure evaluates DJF sea surface temperature (SST) biases in four high-resolution coupled climate models against ESA-CCI satellite climatology, highlighting significant inter-model spread in Western Boundary Current dynamics and Southern Ocean biases.
Key Findings
- HadGEM3-GC5 demonstrates the highest skill with the lowest global RMSE (0.89 K), avoiding the extreme regional anomalies seen in other models.
- ICON-ESM-ER exhibits the largest RMSE (2.00 K), driven by intense dipolar biases in the Gulf Stream and Kuroshio extension regions, suggesting latitudinal shifts in boundary current separation.
- A stark contrast exists in the Southern Ocean: IFS-FESOM2-SR and ICON-ESM-ER show strong warm biases (>2 K), whereas IFS-NEMO-ER is predominantly cold-biased in this region.
- IFS-NEMO-ER has a systematic global cold bias (-0.94 K), unlike the other models which tend towards regional warm biases or near-zero global means.
Spatial Patterns
The North Atlantic Subpolar Gyre is a region of consistent cold bias (the 'cold blob') across IFS and ICON variants, most pronounced in ICON. In the tropics, HadGEM3-GC5 and IFS-FESOM2-SR show typical warm biases in eastern boundary upwelling zones (e.g., Benguela, Peru). ICON displays extreme warm/cold dipoles associated with the Gulf Stream and Kuroshio, indicative of current path errors.
Model Agreement
Low agreement on global mean state (ranging from -0.94 K to +0.50 K). While IFS-FESOM2 and IFS-NEMO share the same atmospheric component, their diverging Southern Ocean biases highlight the critical role of the ocean model formulation (unstructured FESOM vs. structured NEMO) in determining high-latitude SSTs.
Physical Interpretation
The intense dipolar biases in ICON suggest issues with the separation latitude and extension of Western Boundary Currents, common even in high-resolution models. The Southern Ocean warm bias (IFS-FESOM, ICON) is likely driven by excessive shortwave radiation reaching the surface (cloud phase errors) or insufficient vertical mixing in the mixed layer during Austral summer. The North Atlantic cold bias suggests issues with the North Atlantic Current path or excessive freshwater capping preventing deep convection.
Caveats
- Analysis is restricted to DJF (Austral summer), which likely amplifies the Southern Ocean warm bias signals.
- The extreme magnitude of ICON's biases relative to peers might indicate tuning maturity issues or specific sensitivities in the coupling setup.
SST JJA Bias
| Variables | tos |
|---|---|
| Models | IFS-FESOM2-SR, IFS-NEMO-ER, ICON-ESM-ER, HadGEM3-GC5 |
| Reference Dataset | ESA-CCI L4 v3.0.1 |
| Units | K |
| Period | 1980–2014 |
| IFS-FESOM2-SR | Global Mean Bias: -0.16 · Rmse: 0.95 |
| IFS-NEMO-ER | Global Mean Bias: -0.92 · Rmse: 1.29 |
| ICON-ESM-ER | Global Mean Bias: -0.26 · Rmse: 1.83 |
| HadGEM3-GC5 | Global Mean Bias: 0.40 · Rmse: 0.97 |
Summary high
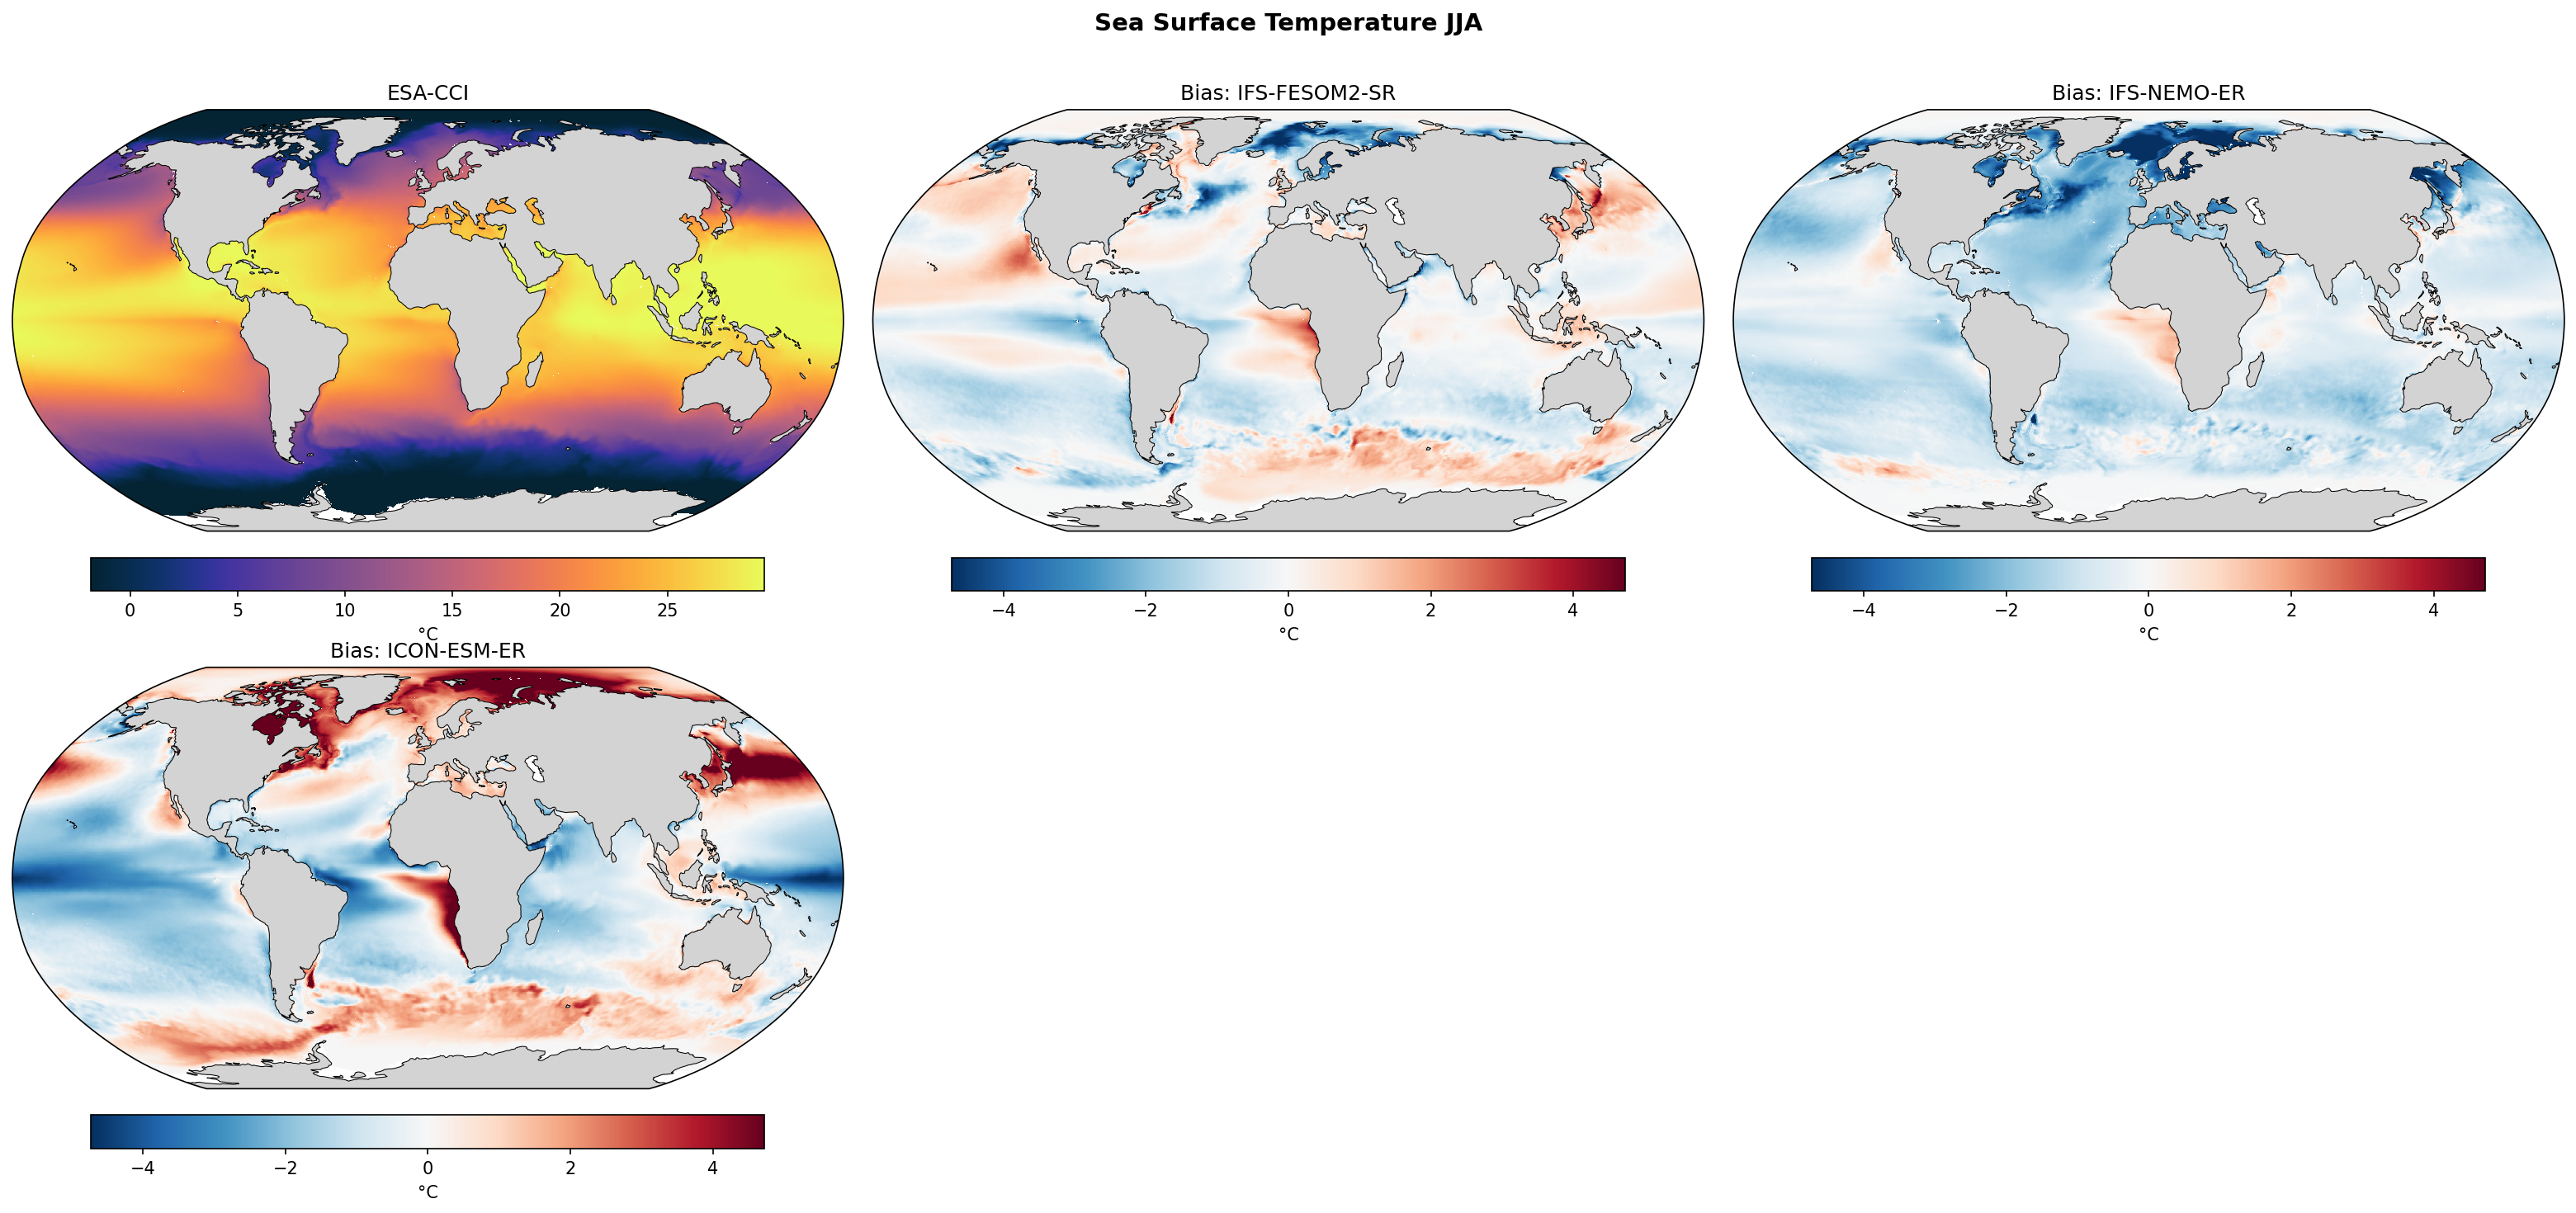
This figure displays JJA Sea Surface Temperature (SST) biases for four high-resolution coupled climate models relative to ESA-CCI satellite climatology (1980–2014). The models exhibit divergent bias structures, ranging from systematic global cooling (IFS-NEMO) to extreme latitudinal contrasts (ICON-ESM) and more moderate regional dipoles (IFS-FESOM2, HadGEM3).
Key Findings
- IFS-NEMO-ER shows a pervasive global cold bias (mean -0.92 K), most severe in the North Atlantic and North Pacific.
- ICON-ESM-ER has the highest RMSE (1.83 K) despite a small mean bias, driven by extreme warm biases (>4 K) in the high-latitude North Atlantic/Arctic and Southern Ocean, contrasted with broad tropical cooling.
- IFS-FESOM2-SR and HadGEM3-GC5 perform best statistically (RMSE ~0.95–0.97 K), though with opposite mean bias signs (-0.16 K vs +0.40 K).
- All models exhibit persistent warm biases in the Benguela upwelling system, indicating that eddy-rich resolutions alone do not fully resolve Eastern Boundary Upwelling System dynamics.
Spatial Patterns
The North Atlantic reveals striking disagreement: IFS-NEMO and IFS-FESOM2 show cold biases in the subpolar gyre (the 'cold blob' pattern), whereas ICON-ESM and HadGEM3 show strong warm biases in the same region. In the Southern Hemisphere (winter during JJA), ICON and HadGEM3 display a prominent zonal band of warm biases ('ring of fire') around 40°S–60°S. The Gulf Stream extension shows characteristic dipole biases (warm overshoot/cold separation) in IFS-FESOM2 and HadGEM3.
Model Agreement
There is low inter-model agreement regarding the sign of biases in the high-latitude oceans (North Atlantic and Southern Ocean). However, there is strong agreement on the location of structural errors, such as the warm bias in the Benguela upwelling region off southwestern Africa.
Physical Interpretation
The persistence of warm biases in upwelling zones (Benguela) suggests unresolved coastal wind stress curl or cloud-radiative feedback errors common to coupled models. The cold North Atlantic bias in IFS-FESOM2 and IFS-NEMO likely relates to AMOC strength or North Atlantic Current path fidelity. Conversely, ICON's extreme high-latitude warming suggests issues with sea-ice coupling or polar cloud feedbacks, while its tropical cooling implies overly strong trade winds or ocean vertical mixing.
Caveats
- JJA represents Northern Hemisphere summer and Southern Hemisphere winter; biases may shift seasonally.
- The extreme cold bias in IFS-NEMO-ER suggests a possible initialization shock or drift issue distinct from structural model physics.
SST Seasonal Cycle
| Variables | tos |
|---|---|
| Models | IFS-FESOM2-SR, IFS-NEMO-ER, ICON-ESM-ER, HadGEM3-GC5, ESA-CCI |
| Reference Dataset | ESA-CCI L4 v3.0.1 |
| Units | K |
| Period | 1980–2014 |
Summary high
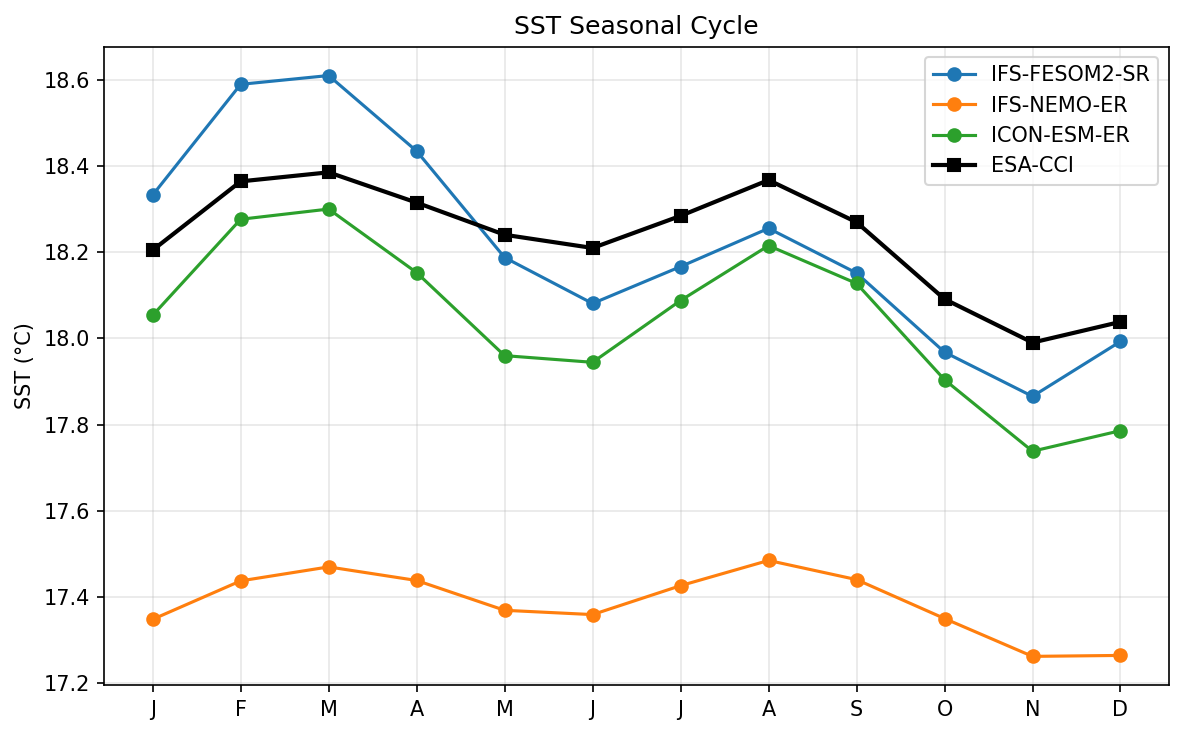
This figure illustrates the climatological seasonal cycle of global-mean Sea Surface Temperature (SST) for four models compared to ESA-CCI satellite observations. While most models capture the basic semi-annual phase structure driven by hemispheric asymmetry, there are substantial inter-model differences in mean state biases, ranging from approximately +0.5°C to -1.0°C.
Key Findings
- IFS-NEMO-ER exhibits a severe cold bias (~1.0°C) and a significantly dampened seasonal amplitude compared to observations.
- HadGEM3-GC5 shows a systematic warm bias of roughly 0.5°C year-round but correctly reproduces the double-peak phase (March/August) seen in observations.
- ICON-ESM-ER tracks the observational phase well with the correct semi-annual structure, maintaining a small, consistent cold bias of ~0.1–0.2°C.
- IFS-FESOM2-SR shows a seasonal bias drift: it is slightly warm in boreal winter/spring (JFM) but transitions to a cold bias by boreal autumn (SON), underestimating the magnitude of the secondary global peak in August.
Spatial Patterns
The observational record shows a characteristic semi-annual cycle with peaks in March and August, reflecting the interplay between the dominant Southern Hemisphere ocean area (peaking in March) and Northern Hemisphere summer warming (peaking in August). The annual minimum occurs in November (~18.0°C).
Model Agreement
There is poor agreement on the absolute global mean temperature, with a spread of nearly 1.5°C between the coldest (IFS-NEMO-ER) and warmest (HadGEM3-GC5) models. However, HadGEM3-GC5 and ICON-ESM-ER show good agreement with observations regarding the timing of seasonal maxima and minima.
Physical Interpretation
The global mean SST cycle is driven by the asymmetric distribution of land and ocean between hemispheres; the SH dominates the signal (warmest in JFM), but the NH summer creates a secondary peak in August. The severe cold bias in IFS-NEMO-ER suggests a fundamental issue with energy conservation, initialization, or vertical mixing/cloud radiative cooling processes. The difference between IFS-NEMO and IFS-FESOM (which share an atmospheric component) highlights the critical role of the ocean model component and coupling interfaces in determining the mean state.
Caveats
- Global means can mask significant regional compensating errors (e.g., a tropical cold tongue bias cancelling out a mid-latitude warm bias).
- The analysis does not distinguish between potential drifts in the deep ocean versus the surface mixed layer.
SST Global Mean Time Series
| Variables | tos |
|---|---|
| Models | IFS-FESOM2-SR, IFS-NEMO-ER, ICON-ESM-ER, HadGEM3-GC5, ESA-CCI |
| Reference Dataset | ESA-CCI L4 v3.0.1 |
| Units | K |
| Period | 1980–2014 |
Summary high
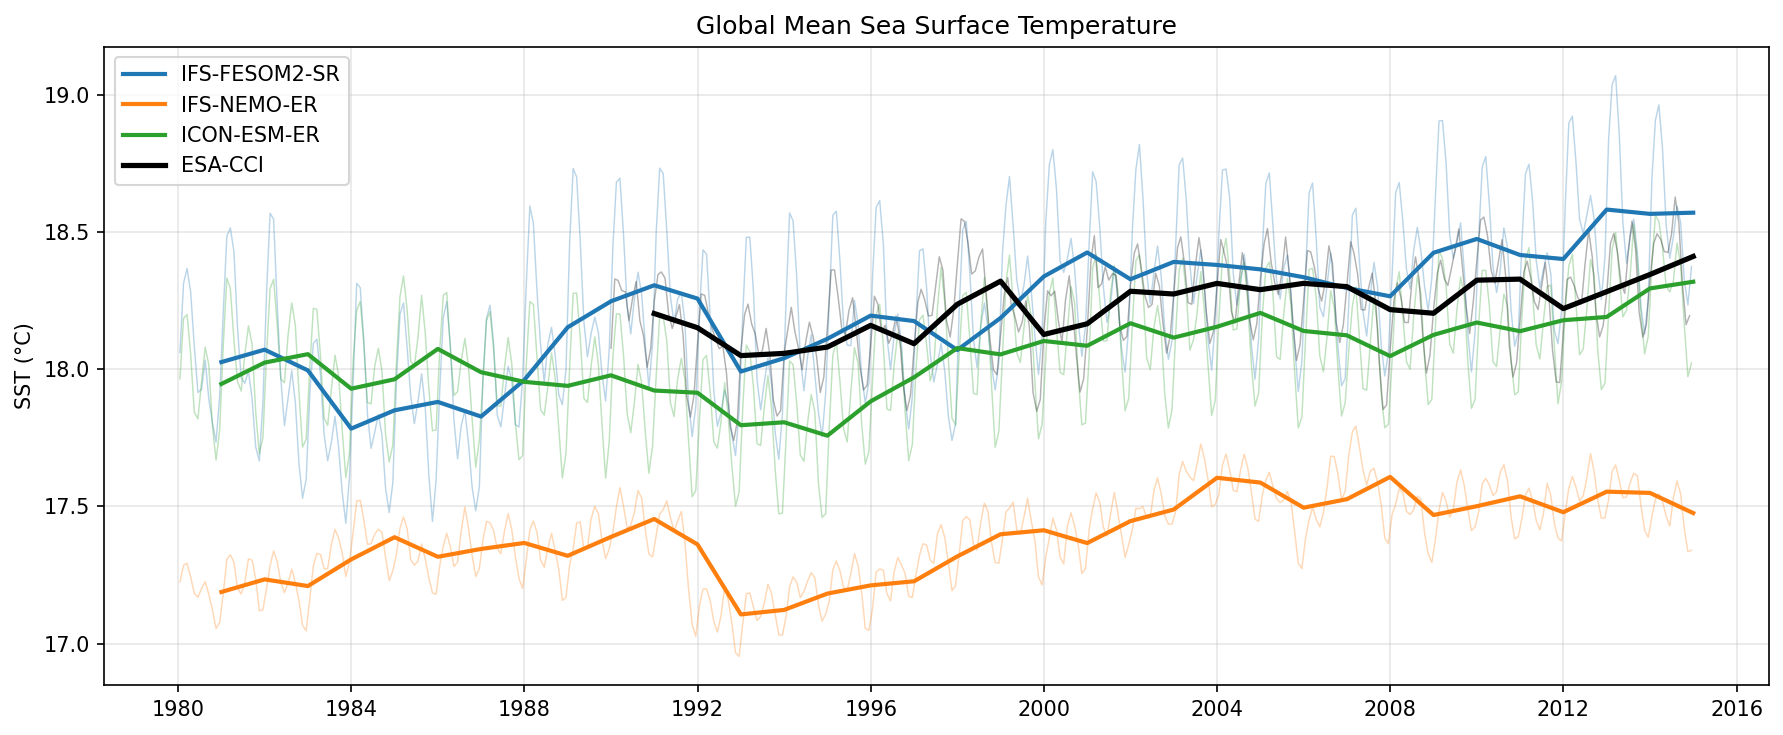
This time series figure compares the evolution of global mean sea surface temperature (SST) from 1980 to 2015 across four high-resolution coupled climate models against ESA-CCI satellite observations.
Key Findings
- Models exhibit a large spread in mean state (~1.5°C range), with HadGEM3-GC5 showing a significant warm bias (~+0.7°C) and IFS-NEMO-ER a substantial cold bias (~-0.8°C) relative to observations.
- IFS-FESOM2-SR and ICON-ESM-ER track the observational mean most closely, with biases generally within ±0.2°C.
- All models capture the multi-decadal anthropogenic warming trend and the distinct cooling event associated with the 1991 Mt. Pinatubo eruption.
Spatial Patterns
The temporal evolution shows a consistent seasonal cycle (thin lines) and interannual variability across models. The 1991–1993 period features a synchronised dip in global SST (~0.2–0.3°C) across all simulations and observations. Post-2000, IFS-FESOM2-SR tends to warm slightly faster than the observations and ICON-ESM-ER.
Model Agreement
While absolute values (biases) diverge significantly, the phase and magnitude of variability (trends and volcanic response) show high inter-model agreement. Notably, the two IFS-based models differ by >1°C, indicating that the choice of ocean model (NEMO vs FESOM2) strongly dictates the global mean thermal state.
Physical Interpretation
The global cooling in the early 1990s is physically driven by radiative forcing from Mt. Pinatubo stratospheric aerosols. The long-term upward trend reflects increasing greenhouse gas concentrations. The large offset between IFS-NEMO and IFS-FESOM2 (which share the same atmospheric component) suggests that ocean model formulation—likely differences in vertical mixing, numerics, or sea-ice coupling—dominates the setting of the equilibrium global mean SST.
Caveats
- ESA-CCI observational data is only shown from ~1991 onwards, precluding validation of the first decade of the simulations.
- Global averaging masks regional biases; a model with small global bias could still have large compensating regional errors.
SST Zonal Mean Profile
| Variables | tos |
|---|---|
| Models | IFS-FESOM2-SR, IFS-NEMO-ER, ICON-ESM-ER, HadGEM3-GC5, ESA-CCI |
| Reference Dataset | ESA-CCI L4 v3.0.1 |
| Units | K |
| Period | 1980–2014 |
Summary high
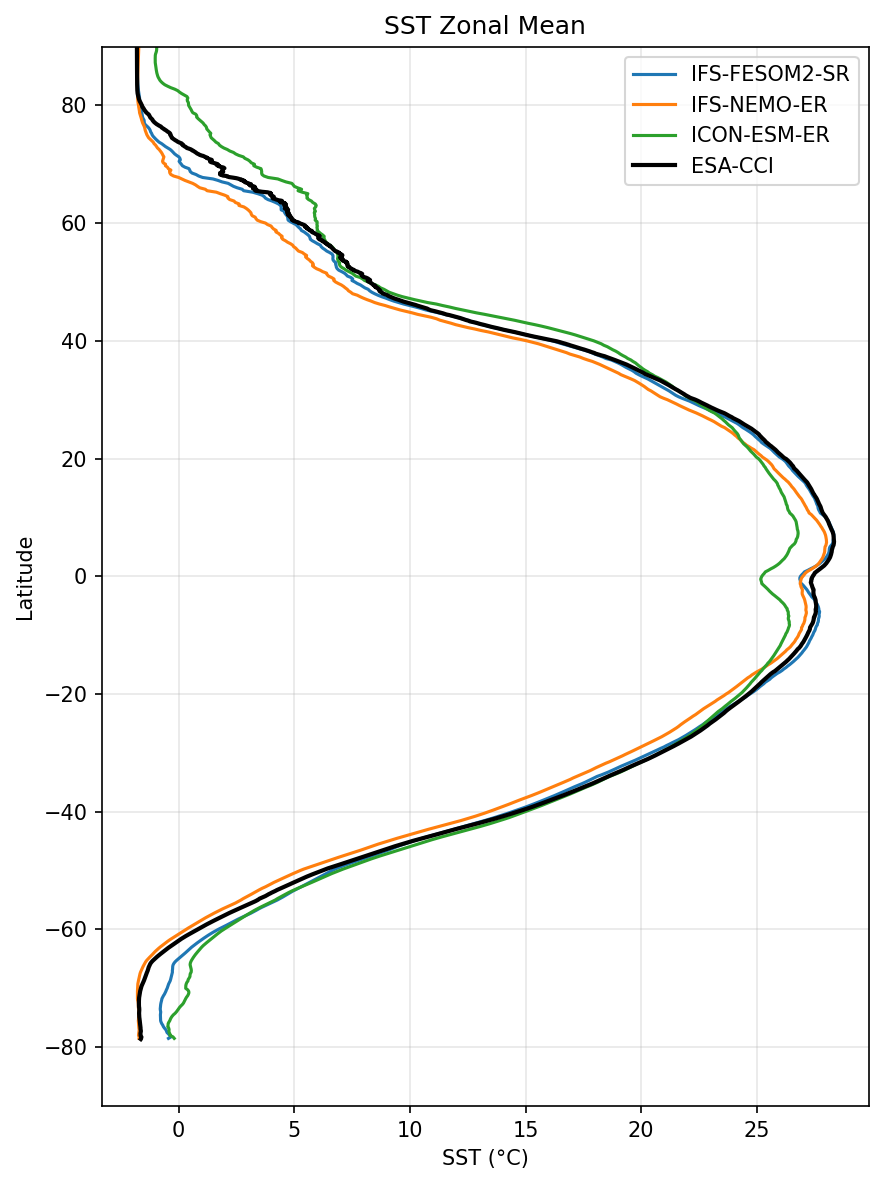
This figure compares the zonal mean Sea Surface Temperature (SST) climatology (1980–2014) of three high-resolution coupled models against ESA-CCI satellite observations.
Key Findings
- IFS-FESOM2-SR demonstrates the highest fidelity to observations, tracking the ESA-CCI profile very closely across all latitudes with minimal bias.
- ICON-ESM-ER exhibits a severe tropical cold bias (approx. 3°C too cold at the equator), indicative of an excessive equatorial cold tongue, and a substantial warm bias in the Northern Hemisphere mid-to-high latitudes (>45°N).
- IFS-NEMO-ER shows a hemispheric asymmetry: a distinct warm bias in the Southern Hemisphere (approx. 60°S to 10°S) and a cold bias in the Northern Hemisphere mid-latitudes (20°N to 60°N).
Spatial Patterns
The tropical peak (approx. 28°C in observations) is significantly underestimated by ICON-ESM-ER, which dips to ~25°C at the equator. In the extratropics, biases diverge: ICON is too warm in the NH north of 40°N, while IFS-NEMO is too cold in the same region. Conversely, in the SH, IFS-NEMO is consistently warmer than the other models and observations.
Model Agreement
Agreement is highest in the Southern Ocean (south of 60°S) where models converge near freezing, though IFS-NEMO remains slightly warmer. Divergence is largest in the tropics (due to ICON's cold tongue) and the Northern Hemisphere mid-latitudes (where ICON is warm and IFS-NEMO is cold). IFS-FESOM2-SR consistently lies between the diverging models, aligning well with the observational reference.
Physical Interpretation
ICON-ESM-ER's strong equatorial cold bias suggests issues with the parameterization of tropical upwelling or mixing (classic 'cold tongue bias'). Its NH warm bias may stem from AMOC strength or insufficient surface heat loss/sea-ice in the high latitudes. IFS-NEMO-ER's NH cold bias might reflect a weak North Atlantic Current or issues with western boundary current separation (e.g., 'cold blob'), while its SH warm bias is often associated with cloud radiative feedback errors (insufficient low cloud reflection).
Caveats
- Zonal averaging masks regional biases (e.g., Gulf Stream separation errors vs. broad basin biases).
- The figure represents an annual mean climatology, potentially hiding seasonal biases in SST evolution.