Evaluation Global Linear Trends CMIP6
CMIP6 Multi-Model Mean Context
Comparison with CMIP6 ensemble mean from 11 members.
Contributing models: ACCESS-ESM1-5, AWI-CM-1-1-MR, CNRM-CM6-1, CNRM-ESM2-1, EC-Earth3, FGOALS-g3, GISS-E2-1-G, INM-CM5-0, IPSL-CM6A-LR, MPI-ESM1-2-LR, MRI-ESM2-0
Synthesis
Related diagnostics
Total Cloud Cover Annual Linear Trend
| Variables | clt |
|---|---|
| Models | IFS-FESOM2-SR, IFS-NEMO-ER, ICON-ESM-ER, HadGEM3-GC5, CMIP6 MMM, MPI-ESM1-2-LR/r1i1p1f1, GISS-E2-1-G/r1i1p1f2, IPSL-CM6A-LR/r1i1p1f1, ACCESS-ESM1-5/r1i1p1f1, EC-Earth3/r1i1p1f1, CNRM-CM6-1/r1i1p1f2, AWI-CM-1-1-MR/r1i1p1f1, CNRM-ESM2-1/r1i1p1f2, FGOALS-g3/r1i1p1f1, INM-CM5-0/r1i1p1f1, MRI-ESM2-0/r1i1p1f1 |
| Reference Dataset | ERA5 |
| Units | %/decade |
| Period | 1980–2014 |
| IFS-FESOM2-SR | Global Mean Trend: -0.09 · Global Mean Trend Diff: -0.29 · Trend Rmse: 1.14 |
| IFS-NEMO-ER | Global Mean Trend: 0.02 · Global Mean Trend Diff: -0.18 · Trend Rmse: 1.05 |
| ICON-ESM-ER | Global Mean Trend: 0.04 · Global Mean Trend Diff: -0.15 · Trend Rmse: 1.15 |
| HadGEM3-GC5 | Global Mean Trend: -0.22 · Global Mean Trend Diff: -0.42 · Trend Rmse: 1.16 |
| CMIP6 MMM | Global Mean Trend Diff: -0.24 · Trend Rmse: 1.06 |
| MPI-ESM1-2-LR/r1i1p1f1 | Global Mean Trend Diff: -0.27 · Trend Rmse: 1.16 |
| GISS-E2-1-G/r1i1p1f2 | Global Mean Trend Diff: -0.10 · Trend Rmse: 1.13 |
| IPSL-CM6A-LR/r1i1p1f1 | Global Mean Trend Diff: -0.32 · Trend Rmse: 1.12 |
| ACCESS-ESM1-5/r1i1p1f1 | Global Mean Trend Diff: -0.44 · Trend Rmse: 1.39 |
| EC-Earth3/r1i1p1f1 | Global Mean Trend Diff: -0.32 · Trend Rmse: 1.19 |
| CNRM-CM6-1/r1i1p1f2 | Global Mean Trend Diff: -0.25 · Trend Rmse: 1.14 |
| AWI-CM-1-1-MR/r1i1p1f1 | Global Mean Trend Diff: -0.20 · Trend Rmse: 1.14 |
| CNRM-ESM2-1/r1i1p1f2 | Global Mean Trend Diff: -0.21 · Trend Rmse: 1.12 |
| FGOALS-g3/r1i1p1f1 | Global Mean Trend Diff: -0.10 · Trend Rmse: 1.16 |
| INM-CM5-0/r1i1p1f1 | Global Mean Trend Diff: -0.30 · Trend Rmse: 1.25 |
| MRI-ESM2-0/r1i1p1f1 | Global Mean Trend Diff: -0.15 · Trend Rmse: 1.13 |
Summary high
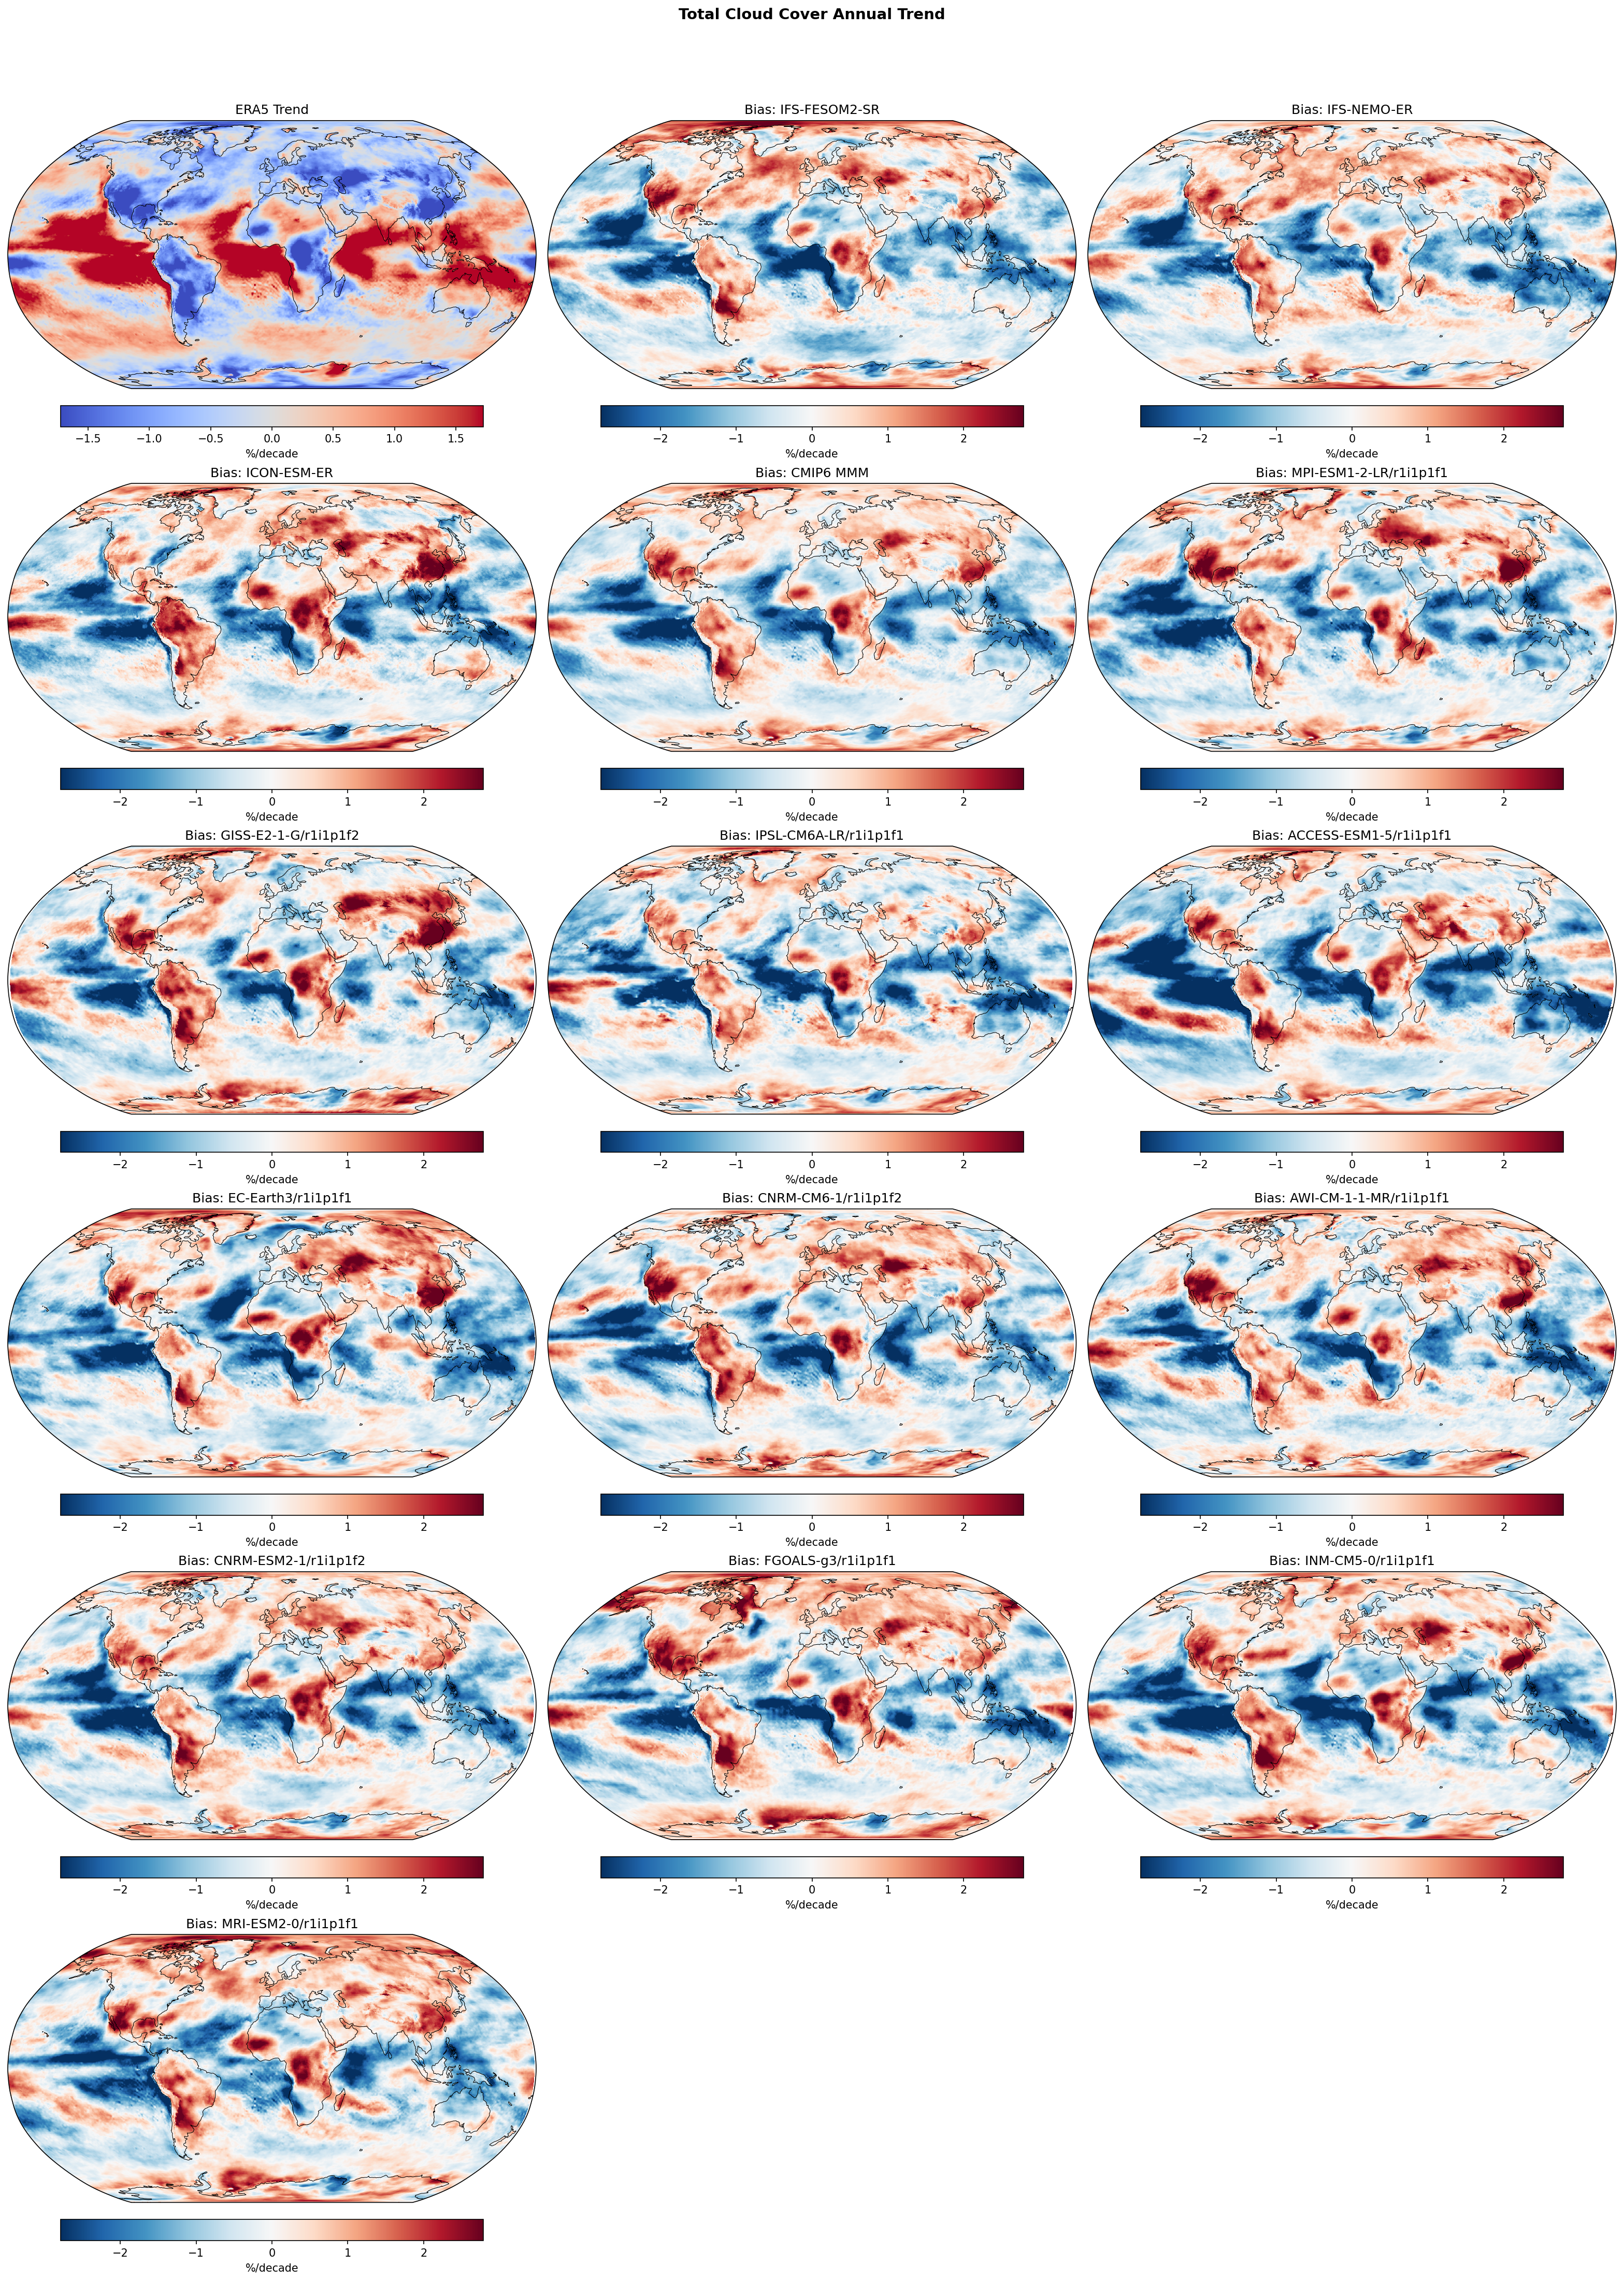
The figure evaluates annual linear trends in Total Cloud Cover (1980–2014), revealing that both high-resolution EERIE models and the CMIP6 ensemble fail to reproduce the observed spatial patterns, particularly the dipole trends in the tropical Pacific.
Key Findings
- Systematic mismatch in the Tropical Pacific: Models underestimate the strong increasing cloud trend observed in the Eastern Equatorial Pacific (blue bias) and overestimate trends in the Western Pacific (red bias).
- Continental bias: Models generally fail to capture the observed cloud cover decrease (clearing) over Europe and the Mediterranean, showing widespread positive trend biases (red) over Northern Hemisphere land masses.
- Global underestimation: All models show a negative global mean trend difference (approx -0.1 to -0.4 %/decade) relative to ERA5, indicating they simulate a globally decreasing or less positive cloud trend than the reanalysis.
- IFS-NEMO-ER and CMIP6 MMM exhibit the lowest trend RMSE (~1.05 %/decade), while HadGEM3-GC5 and ACCESS-ESM1-5 show larger discrepancies.
Spatial Patterns
ERA5 shows a distinct pattern of increasing cloud cover in the Eastern Equatorial Pacific and Maritime Continent, with clearing trends over mid-latitude land (Europe/Asia) and the subtropical Pacific. Model bias maps are dominated by a 'La Niña-like' error structure: negative biases in the Eastern Pacific and positive biases in the Western/Central Pacific and Southern Ocean. ICON-ESM-ER shows particularly strong positive trend biases over high-latitude land regions (Siberia, North America).
Model Agreement
There is high agreement across all models (EERIE high-res and CMIP6 standard-res) regarding the sign of the biases. The trend errors in the Pacific and over Eurasia are robust features present in almost every panel, suggesting these are common systemic issues in coupled climate modelling rather than resolution-dependent features.
Physical Interpretation
The discrepancies likely stem from the 'pattern effect' and internal variability. The 1980–2014 period was characterized by a strengthening Pacific Walker Circulation (negative IPO phase) which models do not spontaneously reproduce in historical simulations. Consequently, models miss the associated dynamic uplift and cloud increase in the East Pacific. Similarly, the disagreement over land suggests models do not capture observed circulation changes or land-atmosphere feedbacks driving mid-latitude clearing.
Caveats
- ERA5 cloud trends may contain spurious artifacts due to changes in the satellite observing system over the 1980–2014 period.
- Since these are free-running coupled simulations, they are not expected to phase-match internal climate variability modes (like the PDO/IPO) which significantly influenced observed trends during this specific 35-year window.
Total Cloud Cover DJF Linear Trend
| Variables | clt |
|---|---|
| Models | IFS-FESOM2-SR, IFS-NEMO-ER, ICON-ESM-ER, HadGEM3-GC5, CMIP6 MMM, MPI-ESM1-2-LR/r1i1p1f1, GISS-E2-1-G/r1i1p1f2, IPSL-CM6A-LR/r1i1p1f1, ACCESS-ESM1-5/r1i1p1f1, EC-Earth3/r1i1p1f1, CNRM-CM6-1/r1i1p1f2, AWI-CM-1-1-MR/r1i1p1f1, CNRM-ESM2-1/r1i1p1f2, FGOALS-g3/r1i1p1f1, INM-CM5-0/r1i1p1f1, MRI-ESM2-0/r1i1p1f1 |
| Reference Dataset | ERA5 |
| Units | %/decade |
| Period | 1980–2014 |
| CMIP6 MMM | Global Mean Trend Diff: -0.24 · Trend Rmse: None |
| MPI-ESM1-2-LR/r1i1p1f1 | Global Mean Trend Diff: -0.33 · Trend Rmse: None |
| GISS-E2-1-G/r1i1p1f2 | Global Mean Trend Diff: -0.01 · Trend Rmse: None |
| IPSL-CM6A-LR/r1i1p1f1 | Global Mean Trend Diff: -0.25 · Trend Rmse: None |
| ACCESS-ESM1-5/r1i1p1f1 | Global Mean Trend Diff: -0.38 · Trend Rmse: None |
| EC-Earth3/r1i1p1f1 | Global Mean Trend Diff: -0.24 · Trend Rmse: None |
| CNRM-CM6-1/r1i1p1f2 | Global Mean Trend Diff: -0.23 · Trend Rmse: None |
| AWI-CM-1-1-MR/r1i1p1f1 | Global Mean Trend Diff: -0.23 · Trend Rmse: None |
| CNRM-ESM2-1/r1i1p1f2 | Global Mean Trend Diff: -0.31 · Trend Rmse: None |
| FGOALS-g3/r1i1p1f1 | Global Mean Trend Diff: -0.22 · Trend Rmse: None |
| INM-CM5-0/r1i1p1f1 | Global Mean Trend Diff: -0.31 · Trend Rmse: None |
| MRI-ESM2-0/r1i1p1f1 | Global Mean Trend Diff: -0.14 · Trend Rmse: None |
Summary high
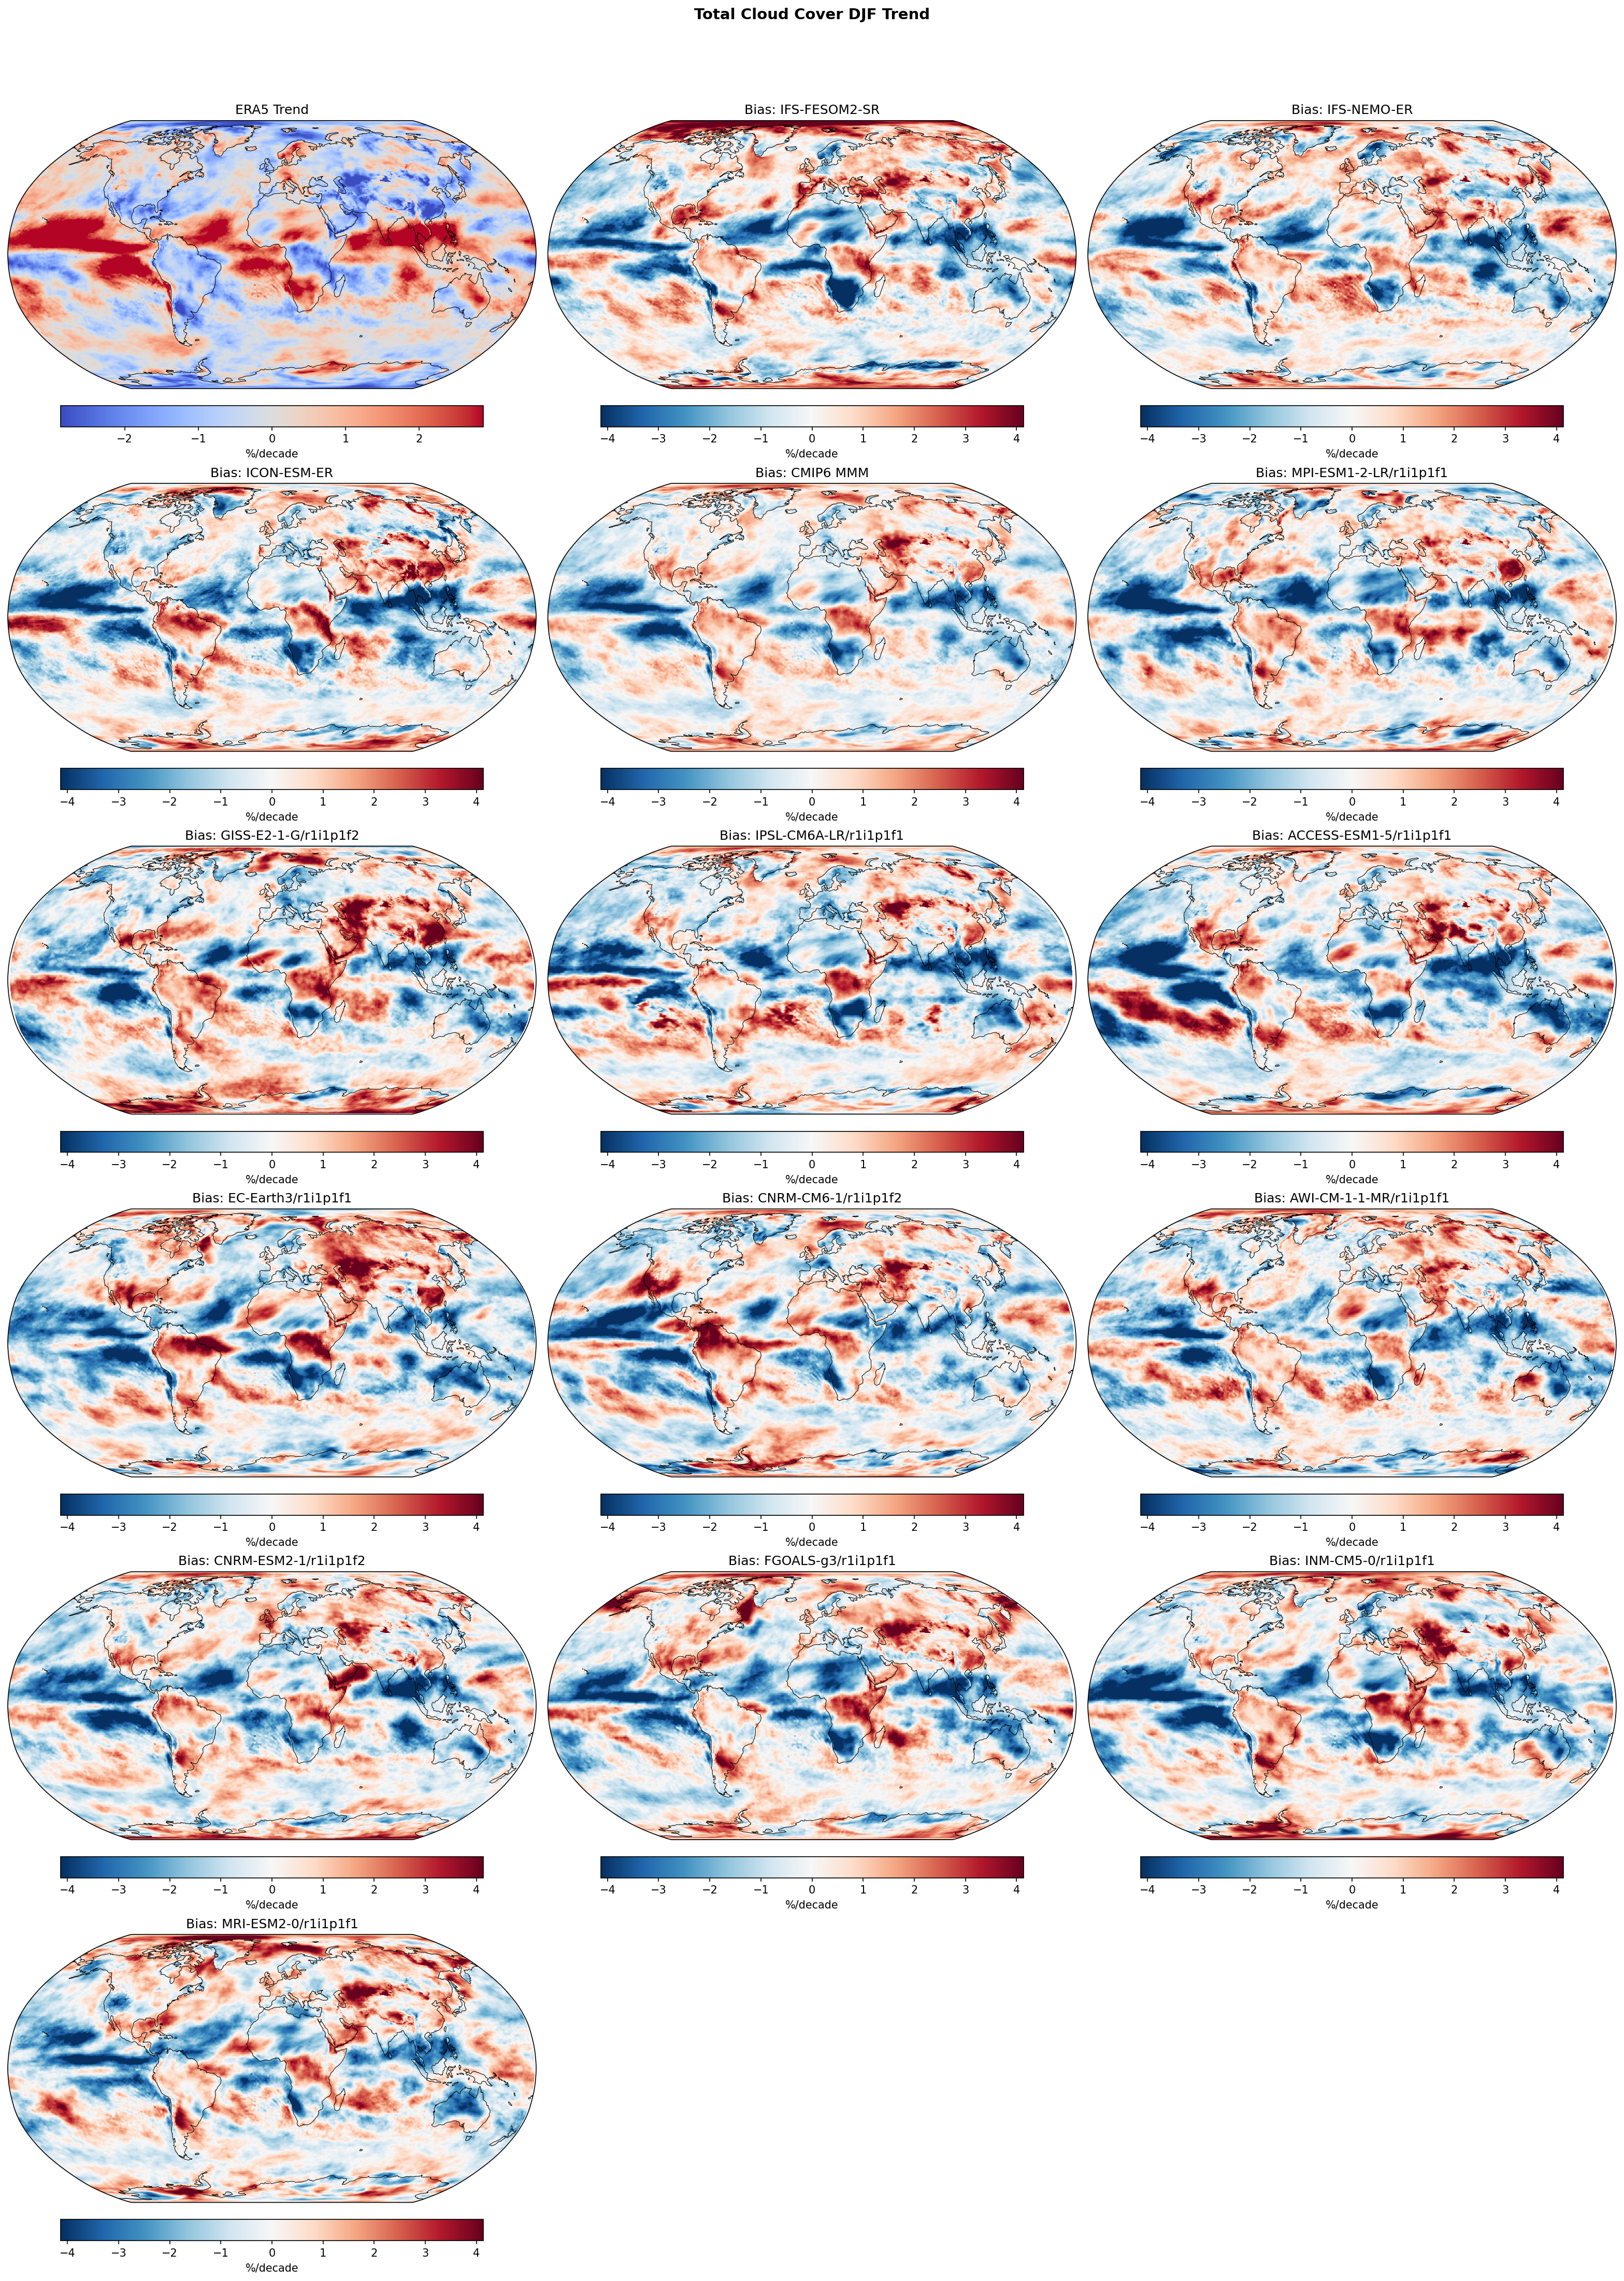
This figure evaluates linear trends in DJF Total Cloud Cover (1980–2014) by comparing ERA5 observations against high-resolution EERIE models and the CMIP6 ensemble. The analysis reveals a systematic, model-wide discrepancy in the tropical Pacific, where models fail to capture the observed zonal gradient in cloud cover trends.
Key Findings
- Systematic Pacific Bias: Nearly all models (EERIE and CMIP6) exhibit a 'dipole' error pattern in the tropical Pacific, characterized by a strong negative trend bias (blue) in the central/eastern Pacific and a positive trend bias (red) in the western Pacific, opposing the ERA5 observed trend.
- No Resolution Benefit: The high-resolution IFS and ICON models display the same Pacific trend biases as the standard-resolution CMIP6 models, indicating that km-scale resolution does not inherently correct this discrepancy.
- ICON Specifics: ICON-ESM-ER shows distinct positive trend biases (overestimation of cloud increase) over the Indian Ocean and Northern Hemisphere continents (Eurasia, North America) compared to the IFS models.
- High-Latitude Overestimation: Most models show positive trend biases over the Arctic and Southern Ocean, implying they simulate a stronger increase in polar cloud cover than observed in ERA5.
Spatial Patterns
The observational panel (ERA5) shows a notable increase in cloud cover (red) in the eastern tropical Pacific and decrease (blue) in the west. The model bias panels consistently show the inverse (blue in the east, red in the west), indicating the models predict a strengthening Walker-like cloud trend (or La Niña-like trend) that contrasts with the ERA5 dataset for this specific period.
Model Agreement
There is strong inter-model agreement regarding the sign of the error in the tropical Pacific. Differences arise in magnitude and regional specifics, such as ICON-ESM-ER showing stronger positive biases over land compared to IFS-NEMO-ER.
Physical Interpretation
The 1980–2014 period is relatively short and subject to strong internal decadal variability (e.g., IPO/PDO). Free-running coupled models generate their own internal variability phases which are not synchronized with the real world. The consistent mismatch suggests the observed trend was heavily influenced by a specific realization of internal variability (e.g., El Niño/La Niña frequency or IPO phase) that the models, averaging towards a forced response or different internal phase, do not reproduce.
Caveats
- Internal Variability: Comparing 35-year trends from free-running coupled models to observations is confounded by unforced internal variability; mismatches may be due to random phase differences rather than model physics errors.
- Reanalysis Stability: ERA5 cloud trends may contain artifacts from changes in the satellite observing system over the 1980–2014 period.
Total Cloud Cover JJA Linear Trend
| Variables | clt |
|---|---|
| Models | IFS-FESOM2-SR, IFS-NEMO-ER, ICON-ESM-ER, HadGEM3-GC5, CMIP6 MMM, MPI-ESM1-2-LR/r1i1p1f1, GISS-E2-1-G/r1i1p1f2, IPSL-CM6A-LR/r1i1p1f1, ACCESS-ESM1-5/r1i1p1f1, EC-Earth3/r1i1p1f1, CNRM-CM6-1/r1i1p1f2, AWI-CM-1-1-MR/r1i1p1f1, CNRM-ESM2-1/r1i1p1f2, FGOALS-g3/r1i1p1f1, INM-CM5-0/r1i1p1f1, MRI-ESM2-0/r1i1p1f1 |
| Reference Dataset | ERA5 |
| Units | %/decade |
| Period | 1980–2014 |
| CMIP6 MMM | Global Mean Trend Diff: -0.33 · Trend Rmse: None |
| MPI-ESM1-2-LR/r1i1p1f1 | Global Mean Trend Diff: -0.32 · Trend Rmse: None |
| GISS-E2-1-G/r1i1p1f2 | Global Mean Trend Diff: -0.25 · Trend Rmse: None |
| IPSL-CM6A-LR/r1i1p1f1 | Global Mean Trend Diff: -0.43 · Trend Rmse: None |
| ACCESS-ESM1-5/r1i1p1f1 | Global Mean Trend Diff: -0.51 · Trend Rmse: None |
| EC-Earth3/r1i1p1f1 | Global Mean Trend Diff: -0.46 · Trend Rmse: None |
| CNRM-CM6-1/r1i1p1f2 | Global Mean Trend Diff: -0.30 · Trend Rmse: None |
| AWI-CM-1-1-MR/r1i1p1f1 | Global Mean Trend Diff: -0.34 · Trend Rmse: None |
| CNRM-ESM2-1/r1i1p1f2 | Global Mean Trend Diff: -0.28 · Trend Rmse: None |
| FGOALS-g3/r1i1p1f1 | Global Mean Trend Diff: -0.18 · Trend Rmse: None |
| INM-CM5-0/r1i1p1f1 | Global Mean Trend Diff: -0.36 · Trend Rmse: None |
| MRI-ESM2-0/r1i1p1f1 | Global Mean Trend Diff: -0.19 · Trend Rmse: None |
Summary high
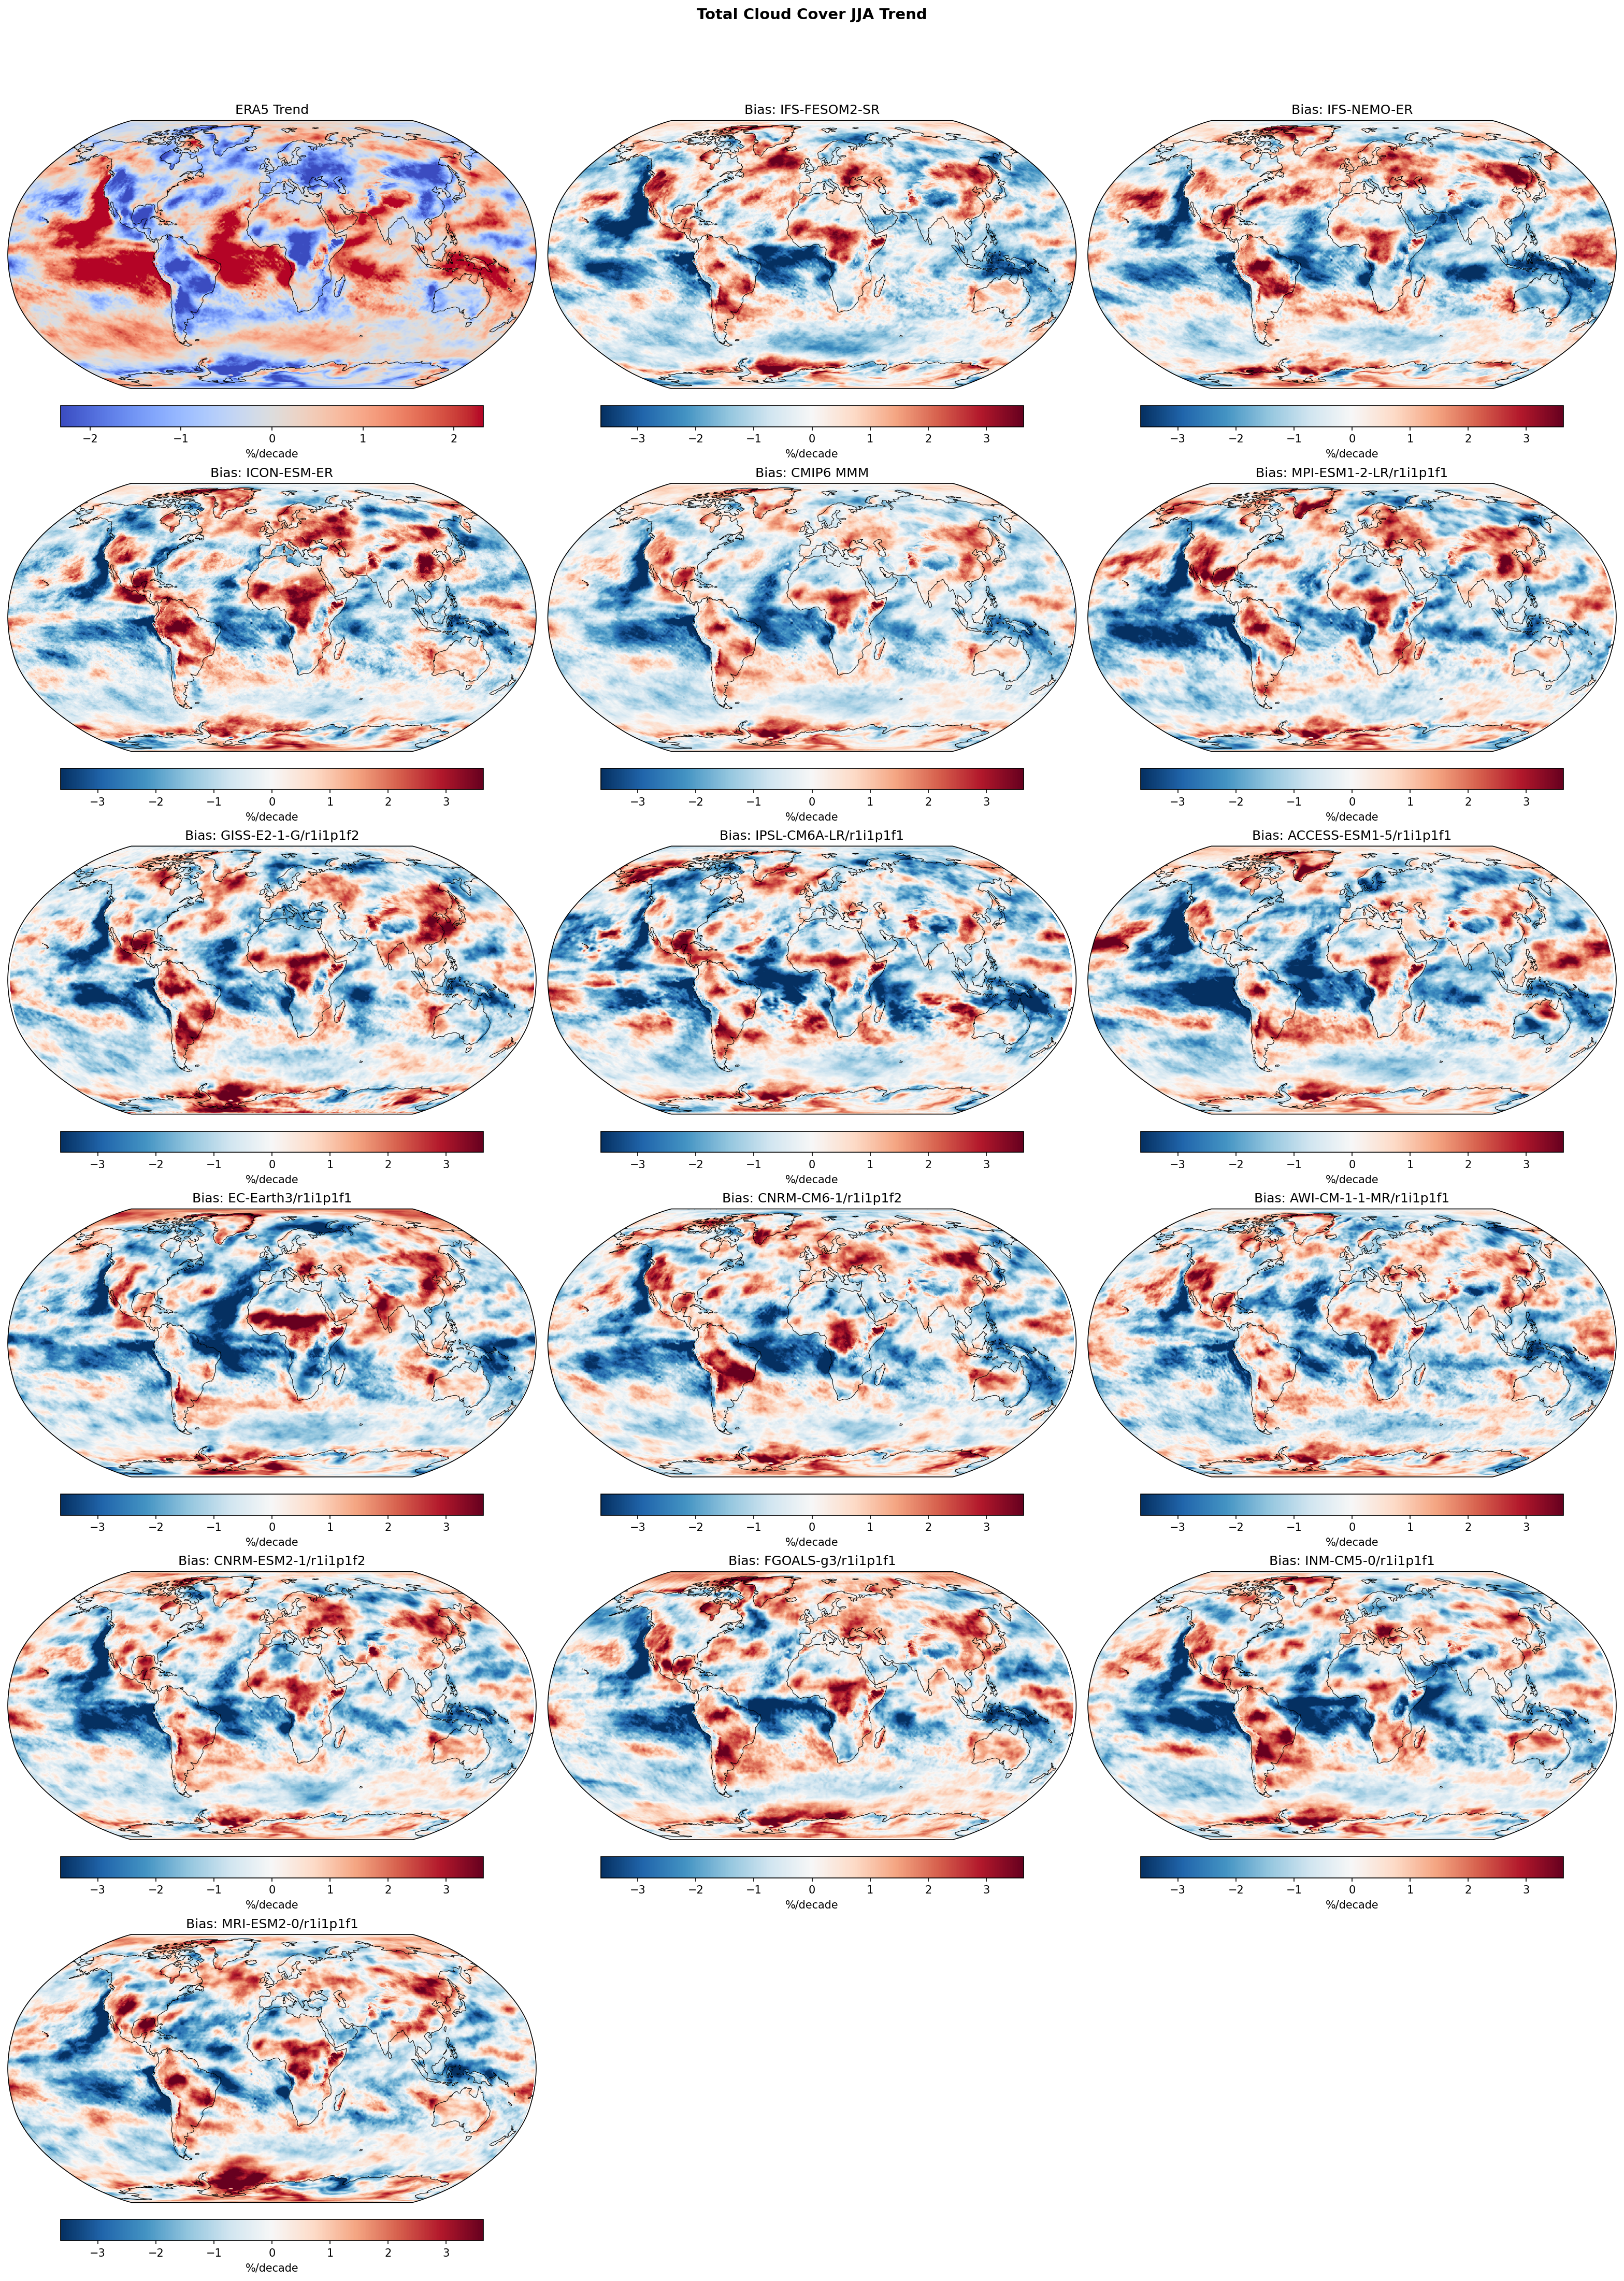
This diagnostic compares JJA linear trends in total cloud cover (1980–2014) between ERA5 reanalysis and high-resolution EERIE simulations (plus CMIP6 context). The results reveal broad systematic discrepancies, where coupled models fail to reproduce the observed regional patterns of cloud cover change, particularly in the tropical Pacific and Southern Ocean.
Key Findings
- Models systematically fail to capture the observed tropical Pacific trend pattern: ERA5 shows increasing cloud cover in the central/eastern equatorial Pacific and decreases over the Maritime Continent, while models display the opposite trend (or lack thereof), resulting in a bias pattern that spatially anti-correlates with observations.
- A pervasive negative trend bias exists in the Southern Ocean (40°S–60°S), where models significantly underestimate the strong positive cloud cover trend observed in ERA5.
- Global mean trend differences are consistently negative (approx. -0.2 to -0.5 %/decade) across all models, indicating that the simulations generally produce a drying or less cloudy trend relative to the ERA5 reanalysis over this period.
Spatial Patterns
The 'Bias' maps (model minus observation trends) strongly resemble the inverse of the 'ERA5 Trend' map, particularly in the tropics. Where ERA5 shows wetting (red, e.g., Eq. Pacific, S. Ocean), models show dry biases (blue); where ERA5 shows drying (blue, e.g., Maritime Continent, Europe), models often show wet biases (red). Notable regional biases include strong negative trend errors over the Southern Ocean and eastern Pacific, and positive trend errors over the Maritime Continent and parts of the Arctic.
Model Agreement
There is high inter-model agreement on the spatial structure of the trend errors. The high-resolution EERIE models (IFS-FESOM2-SR, IFS-NEMO-ER, ICON-ESM-ER, HadGEM3-GC5) exhibit error patterns remarkably similar to the CMIP6 Multi-Model Mean, suggesting that increased horizontal resolution does not automatically correct the representation of multi-decadal trends in cloud cover.
Physical Interpretation
The discrepancies likely stem from the models' inability to capture the specific phase of internal decadal variability (e.g., IPO/PDO) and the associated strengthening of the Walker circulation observed during 1980–2014. Because these are free-running coupled simulations (uninitialized), they do not synchronise with the observed timing of natural variability modes, leading to large trend differences in dynamically driven regions like the Pacific. The Southern Ocean bias may relate to errors in the poleward shift of the jet stream or cloud feedbacks to sea-surface warming.
Caveats
- Trends over a 35-year period are strongly influenced by internal variability; uninitialized coupled models are not expected to reproduce the specific historical phase of these modes.
- ERA5 cloud cover trends may contain spurious artifacts due to changes in the satellite observing system (e.g., the introduction of different sensors) over the reanalysis period.
Surface Latent Heat Flux Annual Linear Trend
| Variables | hfls |
|---|---|
| Models | IFS-FESOM2-SR, IFS-NEMO-ER, ICON-ESM-ER |
| Reference Dataset | ERA5 |
| Units | W/m2/decade |
| Period | 1980–2014 |
| IFS-FESOM2-SR | Global Mean Trend: 0.41 · Global Mean Trend Diff: -1.53 · Trend Rmse: 3.30 |
| IFS-NEMO-ER | Global Mean Trend: 0.19 · Global Mean Trend Diff: -1.74 · Trend Rmse: 3.28 |
| ICON-ESM-ER | Global Mean Trend: 0.25 · Global Mean Trend Diff: -1.68 · Trend Rmse: 3.44 |
Summary medium
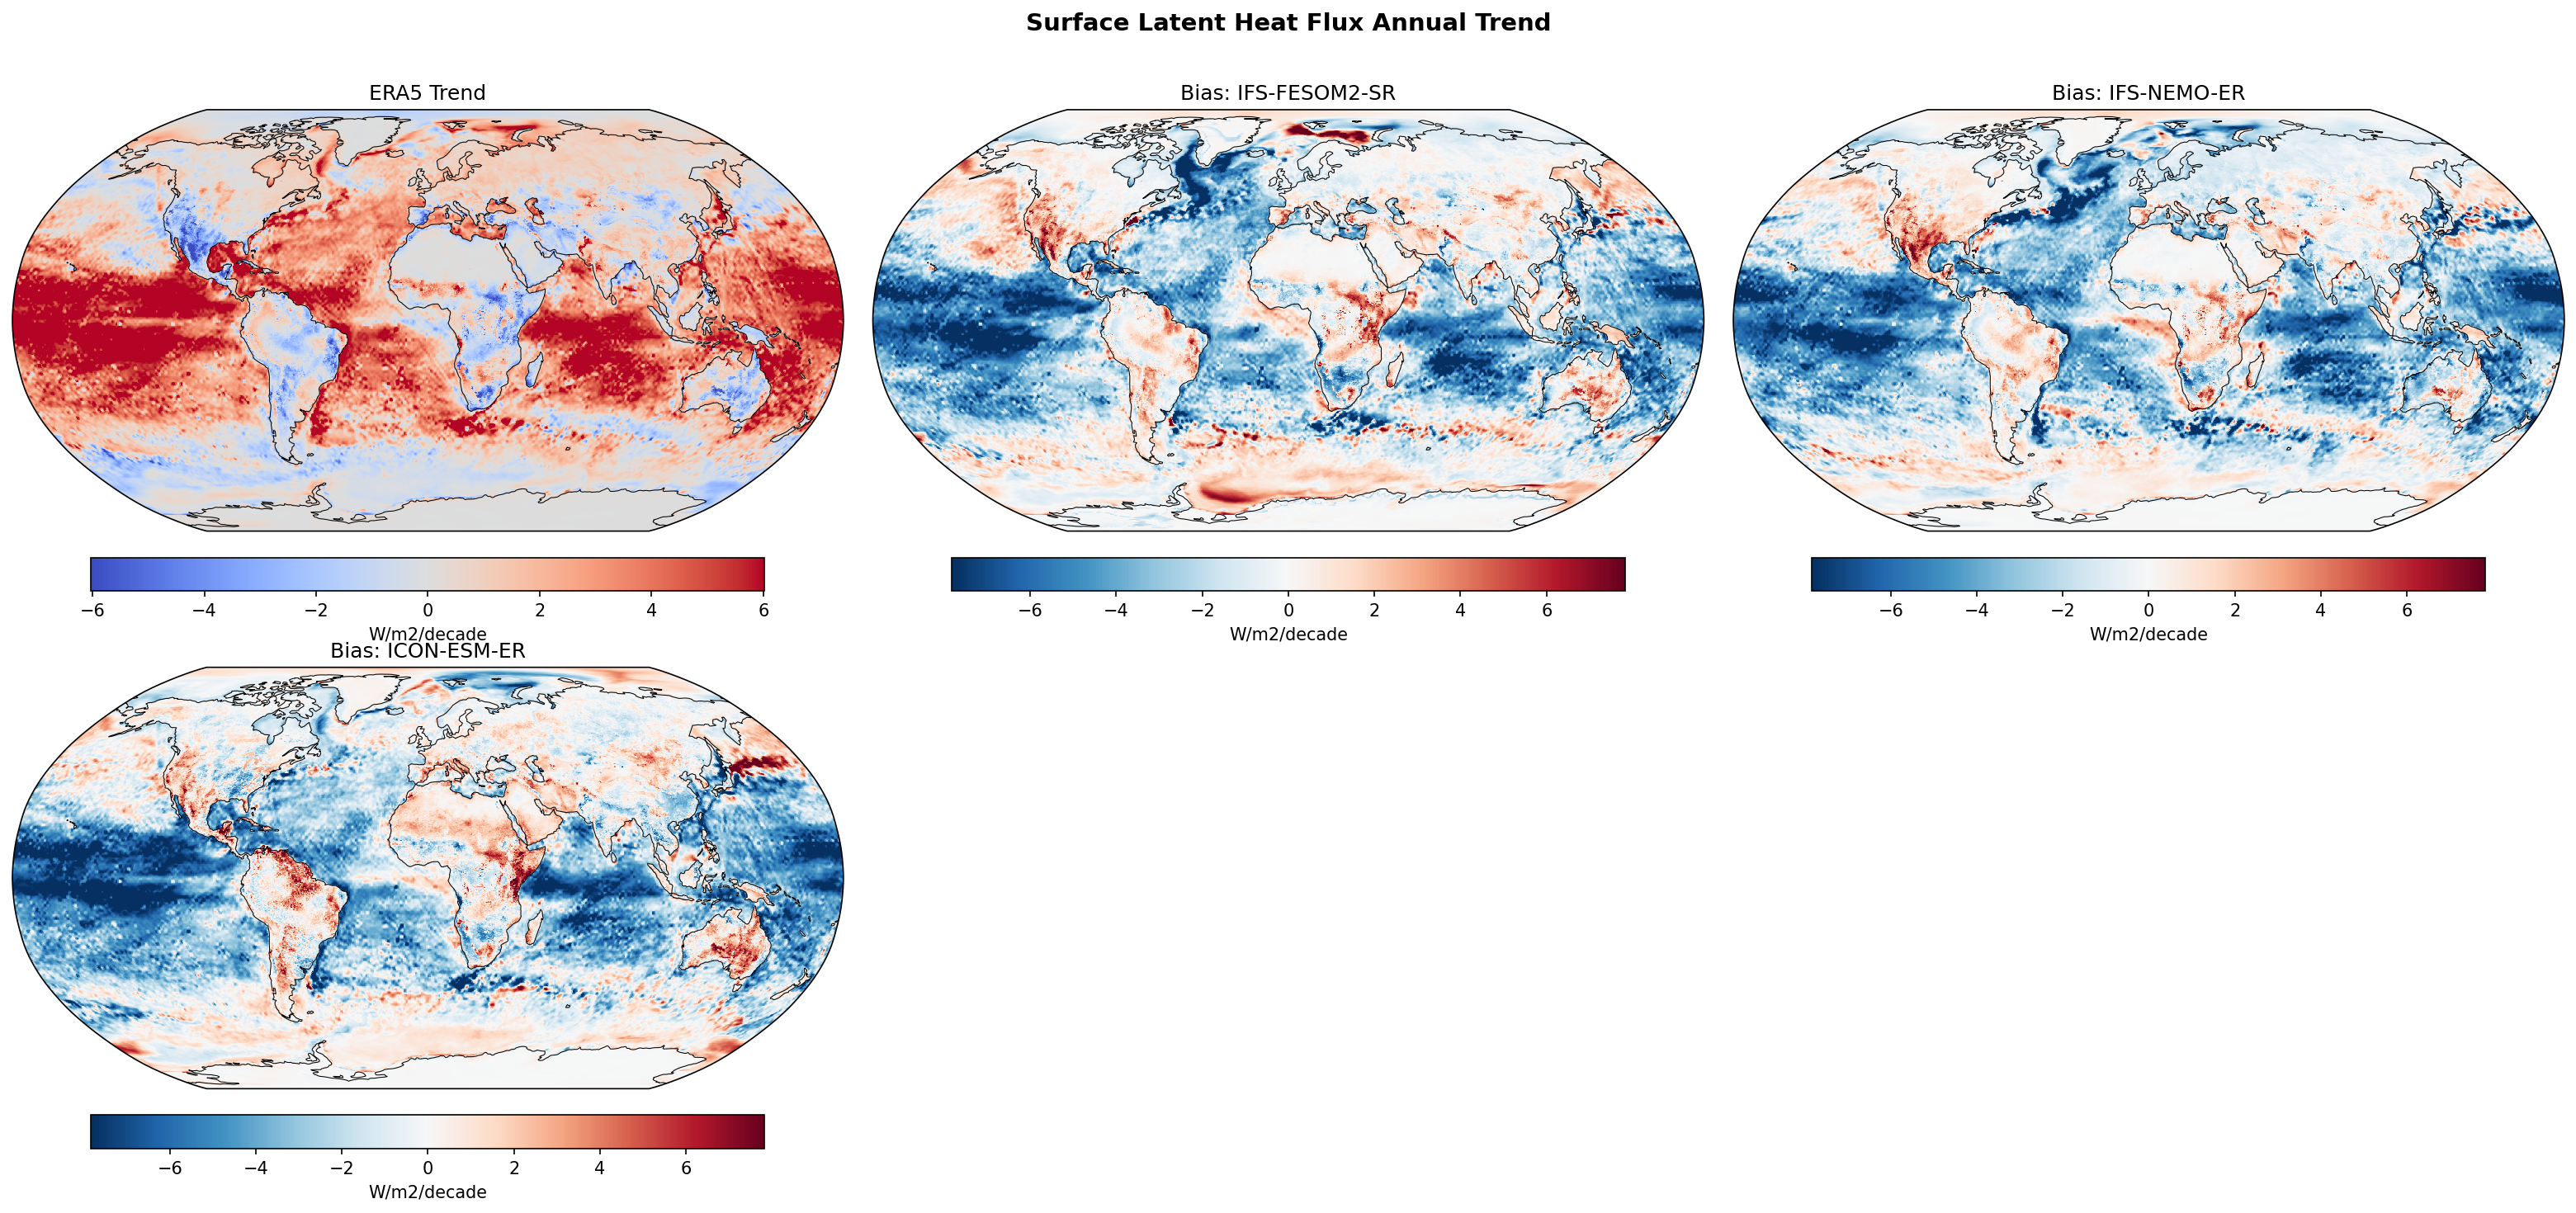
This figure compares annual linear trends in Surface Latent Heat Flux (1980–2014) from ERA5 reanalysis against three high-resolution coupled models. While ERA5 shows strong positive trends (increasing evaporation) across most tropical oceans, all models systematically underestimate these trends, resulting in widespread negative biases.
Key Findings
- ERA5 exhibits robust positive latent heat flux trends (>4 W/m²/decade) across the tropical Pacific, Indian, and Atlantic oceans, consistent with surface warming.
- All three models (IFS-FESOM2-SR, IFS-NEMO-ER, ICON-ESM-ER) strongly underestimate this increase, showing global mean trend differences of -1.5 to -1.7 W/m²/decade relative to ERA5.
- The spatial bias pattern is highly coherent across models, characterized by large negative values (blue) throughout the tropics and subtropics.
- Localized positive biases (model trend > obs trend) appear in the Gulf Stream extension (particularly IFS-NEMO-ER) and parts of the Southern Ocean.
Spatial Patterns
ERA5 shows a dominant 'red' pattern of increasing latent heat flux in the tropics. The model bias maps are inversely 'blue', indicating a failure to capture the magnitude of this increase. Specifically, the tropical Pacific and Indian Oceans show the largest trend deficits. In contrast, the North Atlantic shows complex bias structures with regions of overestimation near western boundary currents in the IFS models.
Model Agreement
There is high inter-model agreement regarding the sign and spatial distribution of the bias. The two IFS-based models (FESOM and NEMO) show very similar patterns, suggesting the atmospheric component or common forcing drives the response. ICON-ESM-ER exhibits a slightly more intense and uniform negative bias in the tropical Pacific.
Physical Interpretation
Latent heat flux is driven by wind speed and the vertical humidity gradient (controlled largely by SST). The models' failure to match the strong positive trend in ERA5 suggests they simulate either weaker surface warming, weaker increases in trade wind strength, or different boundary layer humidity adjustments than the reanalysis. The widespread nature suggests a global thermodynamic constraint or forcing response difference rather than just internal variability mismatch.
Caveats
- ERA5 trends may be influenced by changes in the observing system (e.g., satellite data assimilation) over the 1980–2014 period, potentially exaggerating the 'true' observational trend.
- Free-running coupled models are not phased with historical internal variability (e.g., ENSO, PDO), which significantly influences decadal trends in specific basins.
Surface Latent Heat Flux DJF Linear Trend
| Variables | hfls |
|---|---|
| Models | IFS-FESOM2-SR, IFS-NEMO-ER, ICON-ESM-ER |
| Reference Dataset | ERA5 |
| Units | W/m2/decade |
| Period | 1980–2014 |
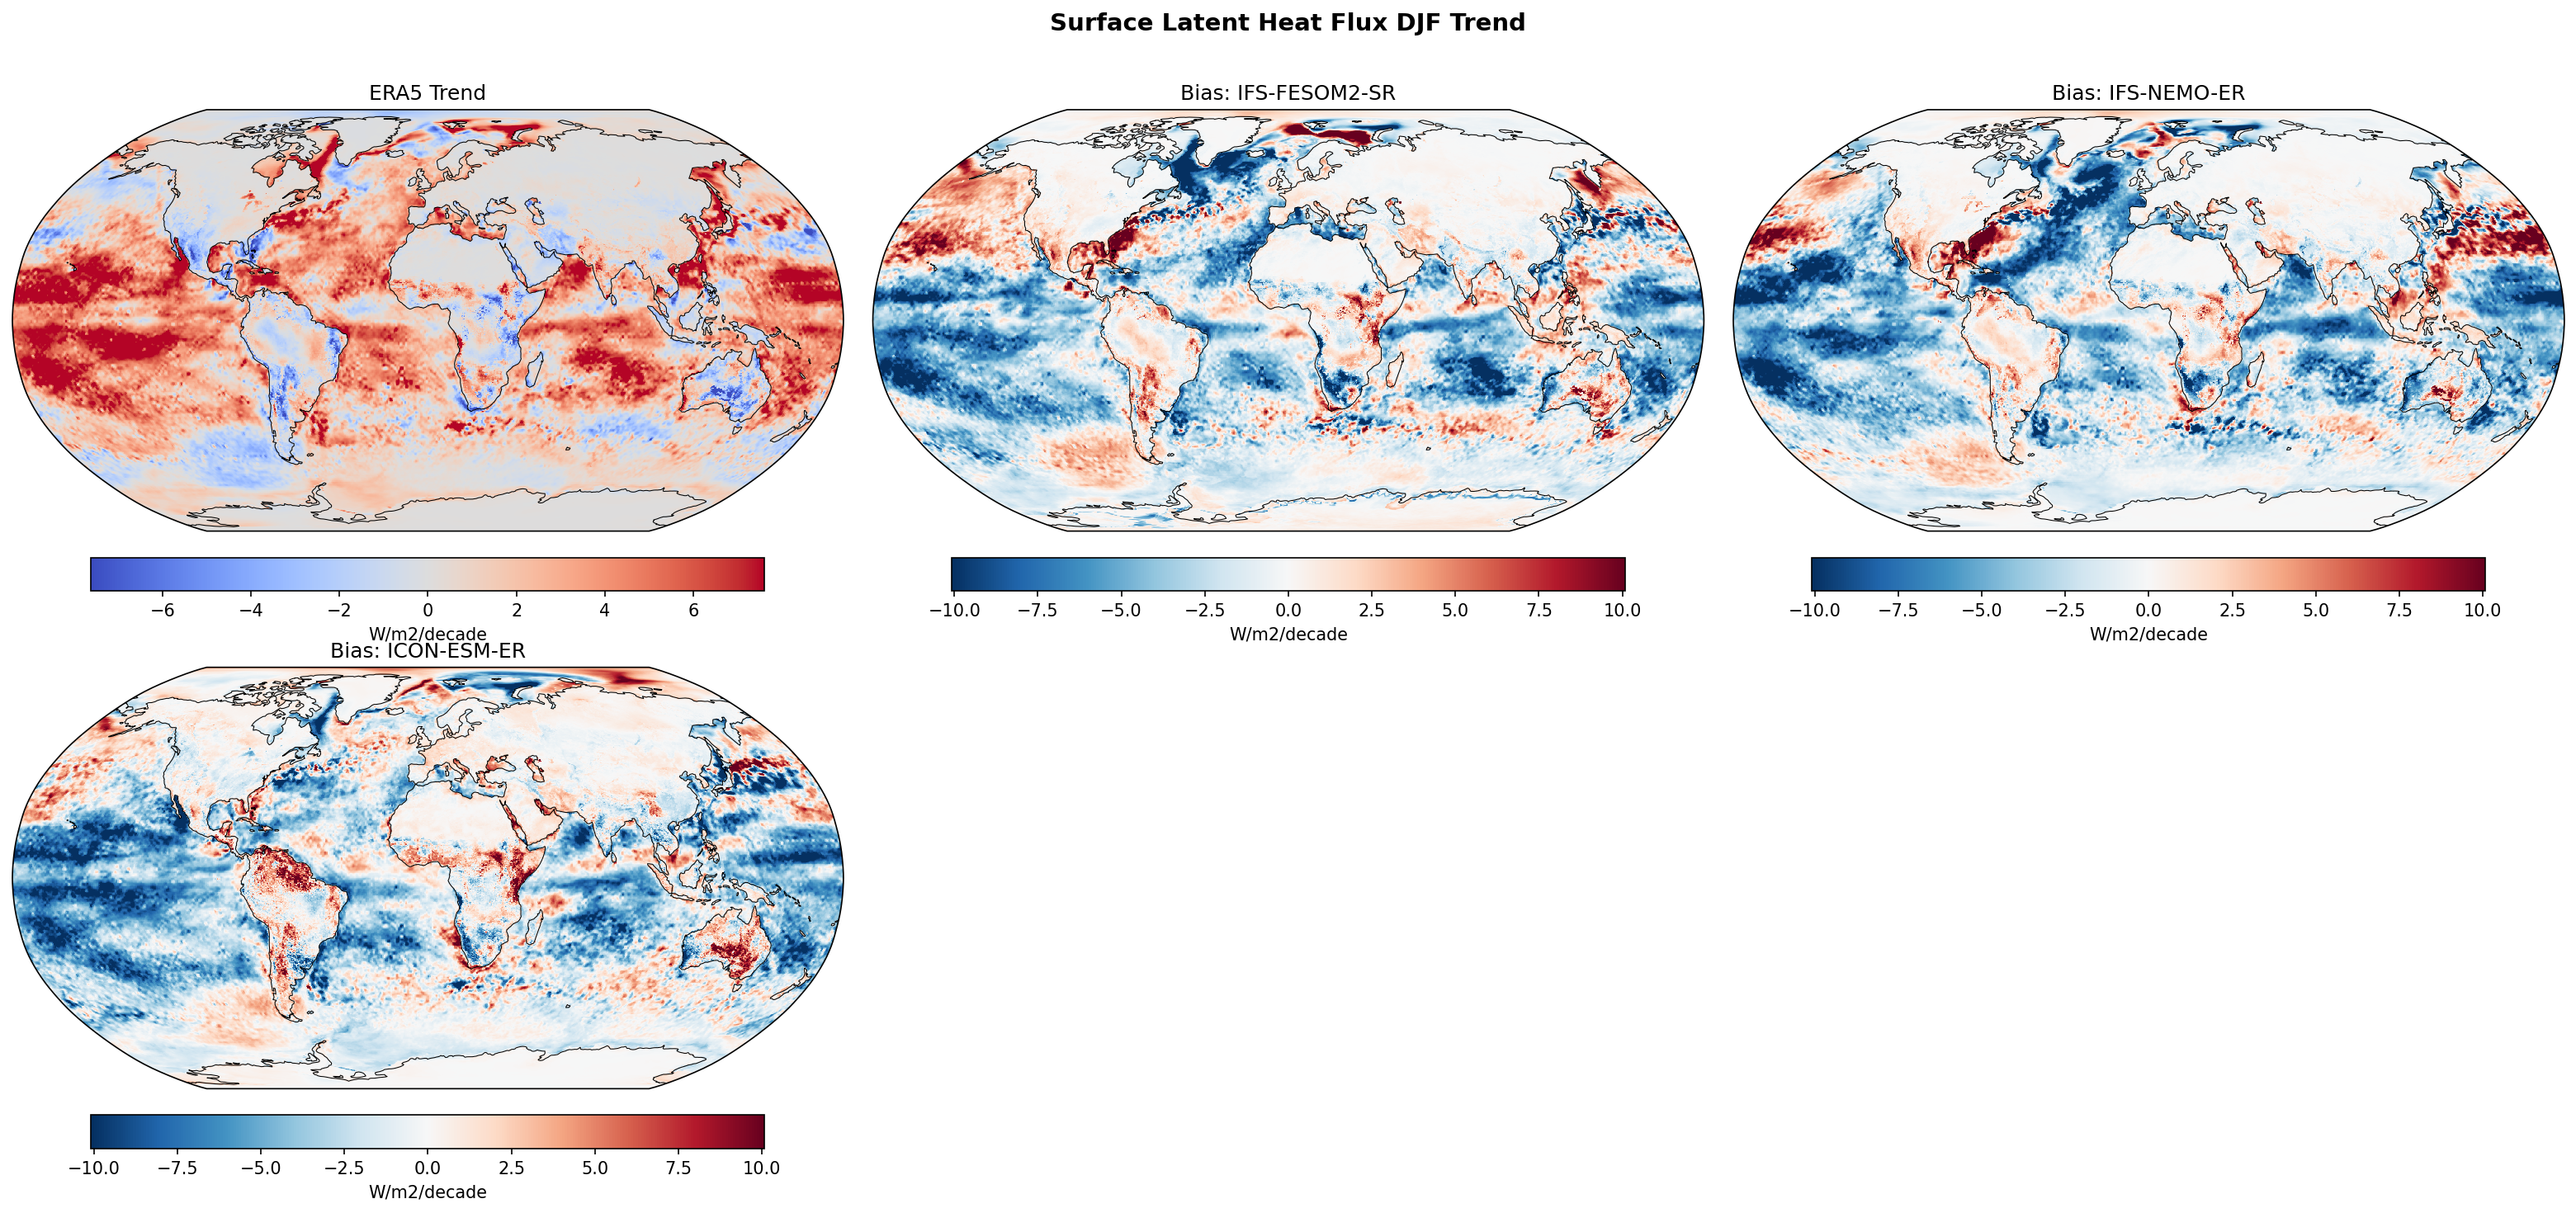
Summary high
This figure evaluates the 1980–2014 linear trends in DJF Surface Latent Heat Flux (SLHF) for three high-resolution coupled models against ERA5 reanalysis. While ERA5 shows strong flux increases over Western Boundary Currents and the Tropical Pacific, the models exhibit large discrepancies, notably failing to reproduce the magnitude of flux increases in the tropics and showing structural mismatches in the North Atlantic.
Key Findings
- ERA5 shows positive SLHF trends (up to +6 W/m²/decade) in the Gulf Stream, Kuroshio Extension, and Tropical West Pacific, consistent with wintertime surface warming and intensified evaporation.
- All three models exhibit a strong negative trend bias (blue, ~-5 to -10 W/m²/decade) across the Tropical Pacific, indicating they underestimate the observed increase in latent heat release in this region.
- The IFS-based models (IFS-FESOM2-SR and IFS-NEMO-ER) display a distinct dipole bias in the North Atlantic—positive trend bias near the US coast and negative bias in the open subpolar gyre—suggesting errors in the decadal evolution of the Gulf Stream separation and extension.
- ICON-ESM-ER shows the most widespread negative trend biases, particularly strong in the tropical Pacific, South Atlantic, and Indian Ocean.
Spatial Patterns
The observational trend is dominated by warming-induced flux increases in the Northern Hemisphere western boundary currents and the Indo-Pacific warm pool. The bias maps reveal that model errors are often larger in magnitude than the observed trends (bias scale ±10 vs obs scale ±6 W/m²/decade). The biases are spatially coherent, with dipole structures in the North Atlantic (IFS models) and basin-wide underestimations in the tropics (all models).
Model Agreement
There is strong qualitative agreement between all models in underestimating the Tropical Pacific SLHF trend. The two IFS models show very similar spatial bias patterns in the North Atlantic and North Pacific, likely due to their shared atmospheric component. ICON-ESM-ER differs by showing more widespread negative biases in the Southern Hemisphere.
Physical Interpretation
Latent heat flux is primarily driven by wind speed and the sea-air humidity gradient (related to SST). The failure to capture the strong positive trend in the Tropical Pacific likely reflects the common model difficulty in reproducing the observed strengthening of the Walker circulation and trade winds during this period. The North Atlantic biases likely stem from discrepancies in the position or warming rate of the Gulf Stream; if the model's current does not shift or warm as observed, the strong air-sea interaction signal in DJF will be misplaced, creating dipole error patterns.
Caveats
- The analysis period (1980–2014) is short and dominated by internal decadal variability (e.g., IPO, AMO). Free-running coupled models are not expected to reproduce the specific phase of internal variability seen in observations, leading to expected trend differences.
- The bias color scale range (±10) is larger than the observation scale range (±6), highlighting that model-observation discrepancies are significant relative to the signal.
Surface Latent Heat Flux JJA Linear Trend
| Variables | hfls |
|---|---|
| Models | IFS-FESOM2-SR, IFS-NEMO-ER, ICON-ESM-ER |
| Reference Dataset | ERA5 |
| Units | W/m2/decade |
| Period | 1980–2014 |
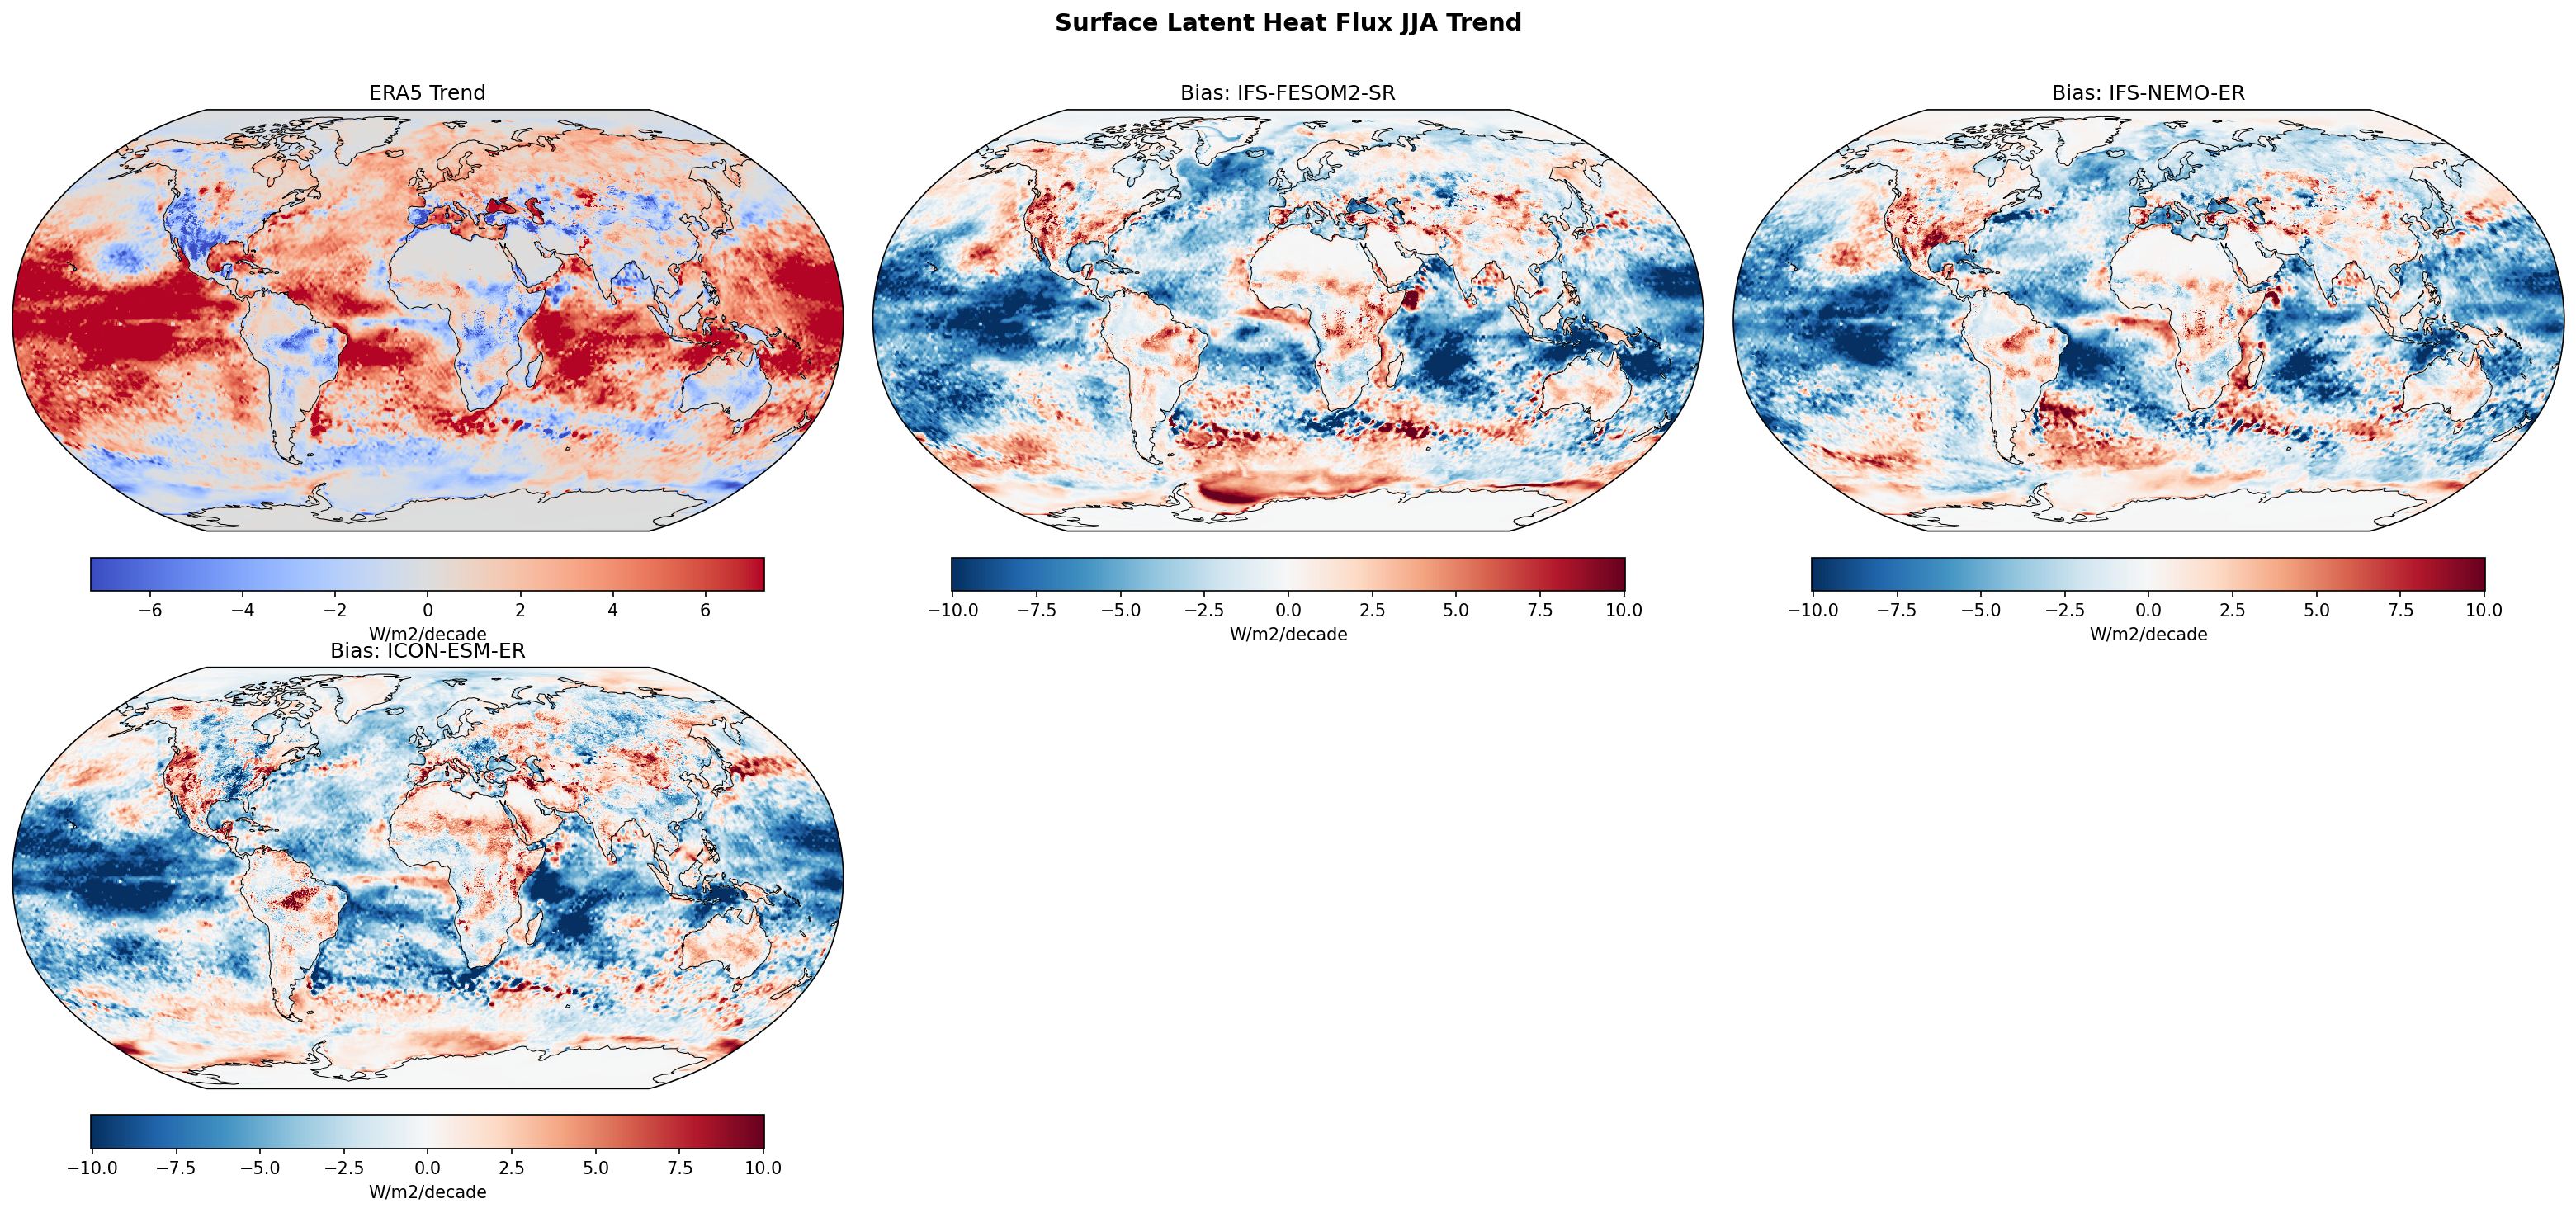
Summary high
This diagnostic evaluates linear trends in JJA Surface Latent Heat Flux (1980–2014) for three high-resolution coupled models against ERA5 reanalysis. While ERA5 shows widespread increases in oceanic latent heat release, all three models exhibit strong negative trend biases over the tropical oceans and positive trend biases over tropical land.
Key Findings
- ERA5 displays broad positive trends (increased evaporation, red) over the tropical and subtropical oceans, reaching 4–6 W/m²/decade.
- All three models (IFS-FESOM2-SR, IFS-NEMO-ER, ICON-ESM-ER) show strong negative biases (blue) throughout the tropical Pacific, Atlantic, and Indian Oceans, indicating they simulate much weaker or negative trends compared to ERA5.
- Conversely, over tropical land regions like the Amazon and Central Africa, models generally show positive biases (red), implying they simulate a stronger increase in evapotranspiration than the reanalysis.
- Bias magnitudes in the tropics often exceed ±5 W/m²/decade, which is comparable to or larger than the signal seen in the observational baseline.
Spatial Patterns
The dominant pattern is a land-sea contrast in bias: systematic underestimation of latent heat flux trends over the tropical oceans (blue bias) and overestimation over tropical rainforest regions (red bias). In the Northern Hemisphere extratropics, biases are more mixed and regional, with notable negative biases in the western US and parts of the North Atlantic.
Model Agreement
There is striking agreement across all three models regarding the large-scale bias patterns. IFS-FESOM2, IFS-NEMO, and ICON-ESM all exhibit the same tropical ocean underestimation and tropical land overestimation, suggesting this discrepancy is robust across these model formulations and resolutions.
Physical Interpretation
Latent heat flux is driven by surface wind speed and the specific humidity gradient (SST vs. air temperature). The widespread negative oceanic bias suggests the models may have weaker trends in surface winds or slower SST warming rates compared to the reanalysis. Alternatively, the positive trend in ERA5 might be driven by changes in the observing system (e.g., satellite era transitions) that the free-running models do not replicate. The positive land bias suggests the models are simulating a more intense acceleration of the hydrological cycle (drying/evaporating) over land than ERA5 captures.
Caveats
- ERA5 surface fluxes are derived products, not direct observations, and their decadal trends can be influenced by inhomogeneities in the assimilated observing system.
- The analysis period (1980–2014) is relatively short, meaning trends are strongly influenced by internal variability (e.g., ENSO phases) which free-running models are not expected to synchronize with observations.
Surface Sensible Heat Flux Annual Linear Trend
| Variables | hfss |
|---|---|
| Models | IFS-FESOM2-SR, IFS-NEMO-ER, ICON-ESM-ER |
| Reference Dataset | ERA5 |
| Units | W/m2/decade |
| Period | 1980–2014 |
| IFS-FESOM2-SR | Global Mean Trend: -0.14 · Global Mean Trend Diff: -0.34 · Trend Rmse: 1.39 |
| IFS-NEMO-ER | Global Mean Trend: -0.08 · Global Mean Trend Diff: -0.28 · Trend Rmse: 1.20 |
| ICON-ESM-ER | Global Mean Trend: -0.10 · Global Mean Trend Diff: -0.29 · Trend Rmse: 1.32 |
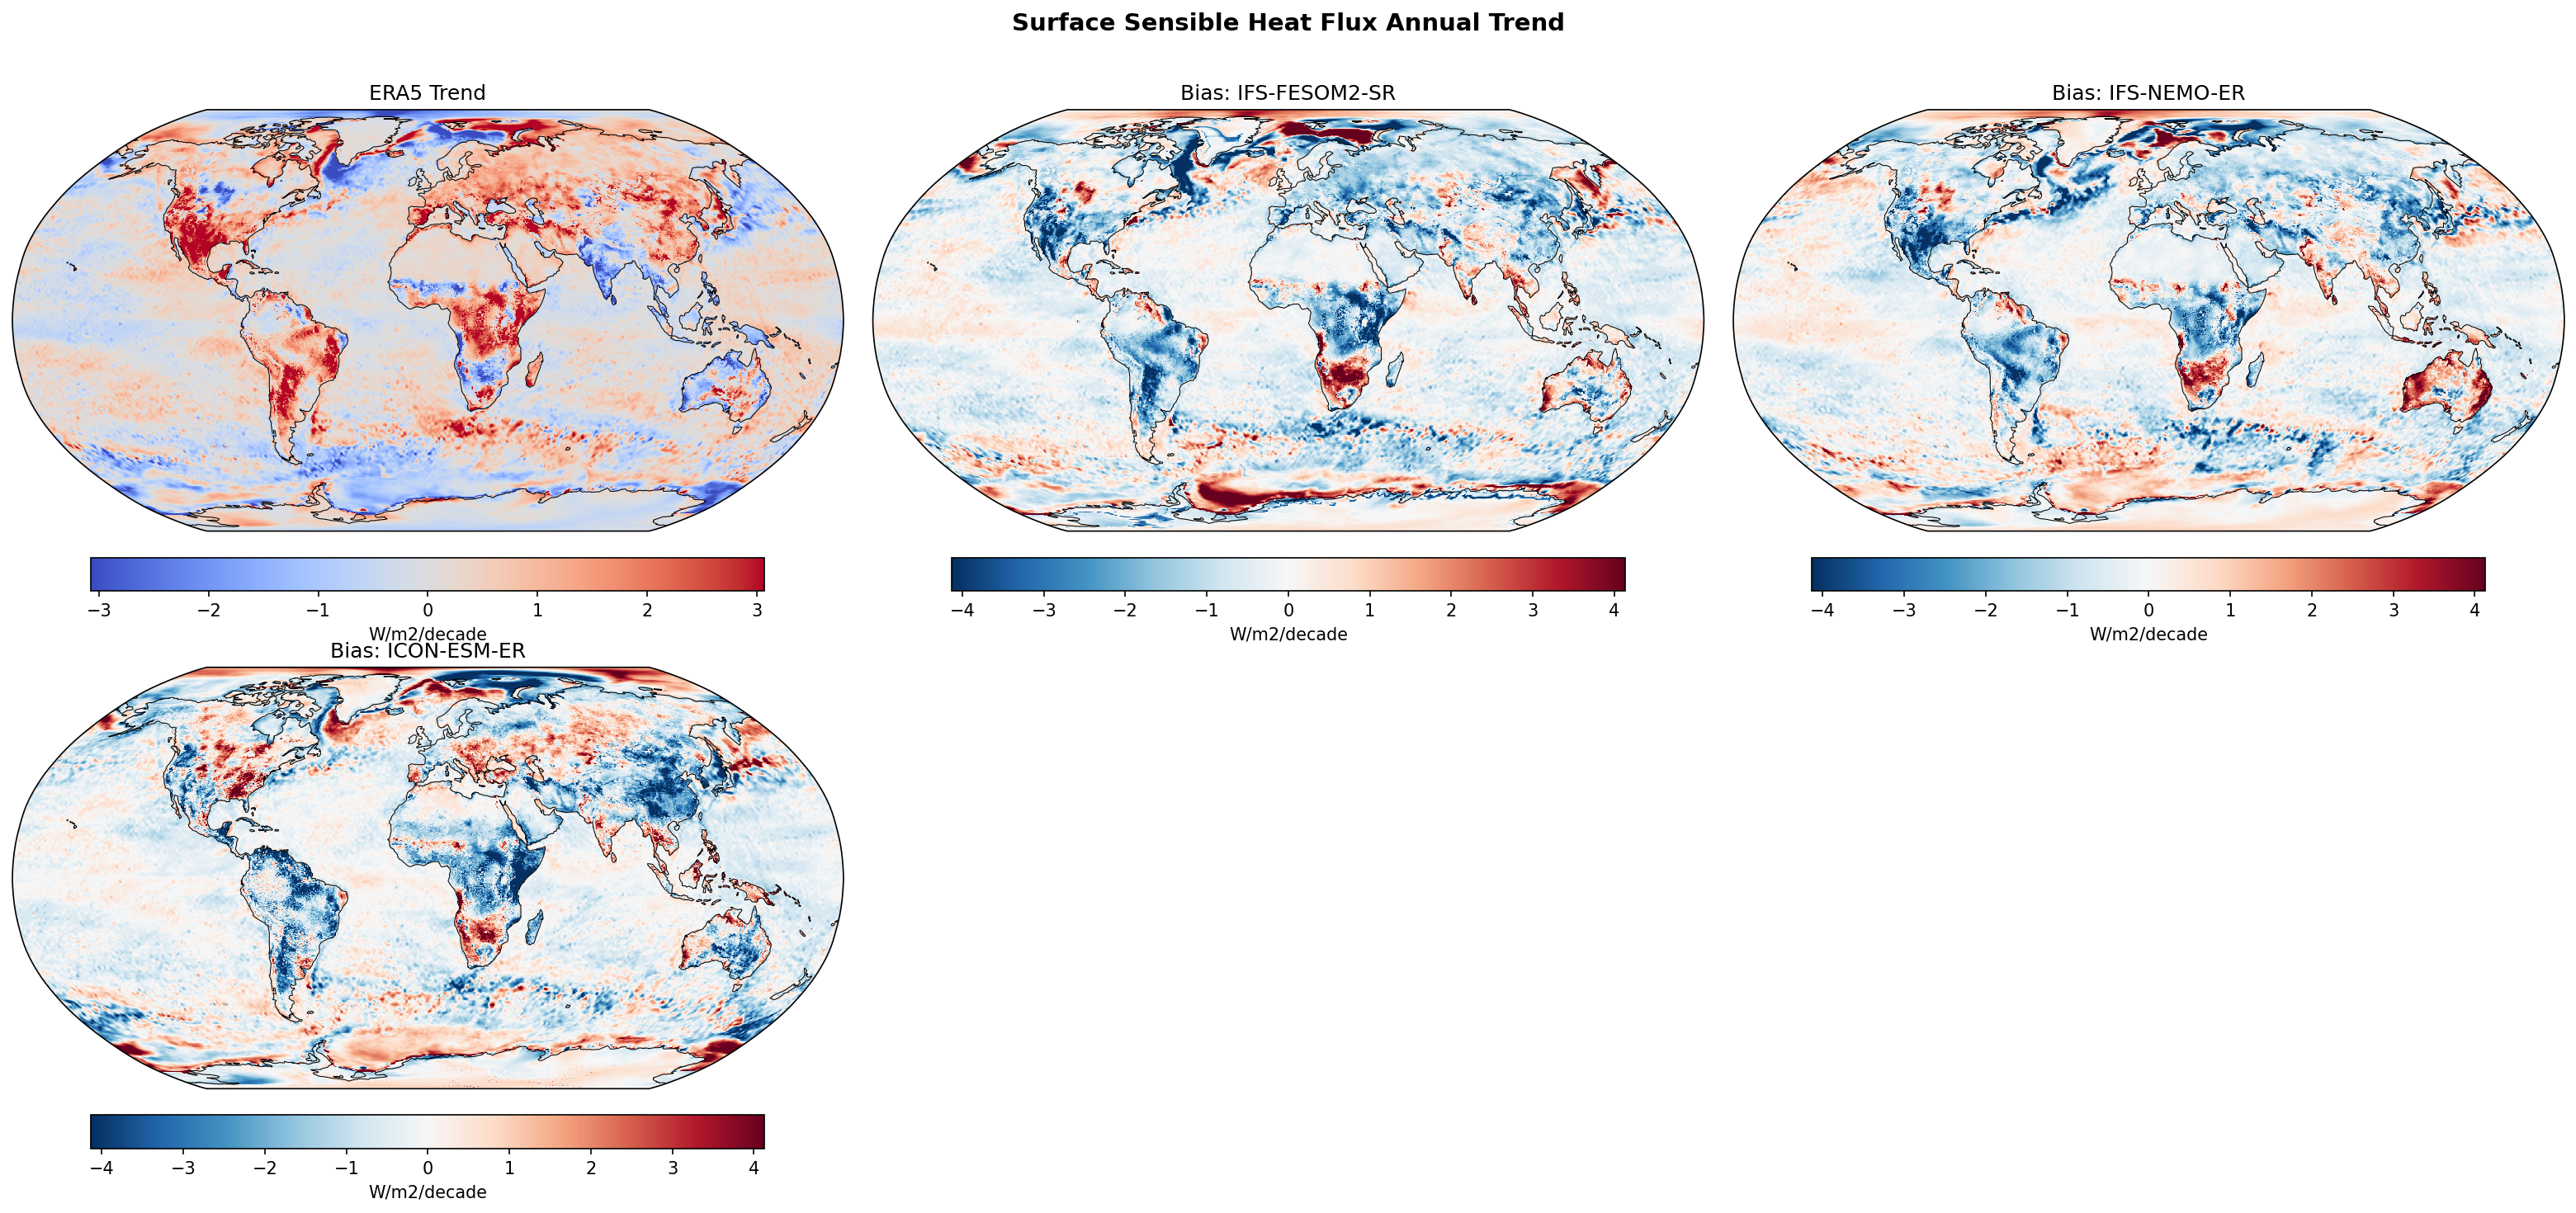
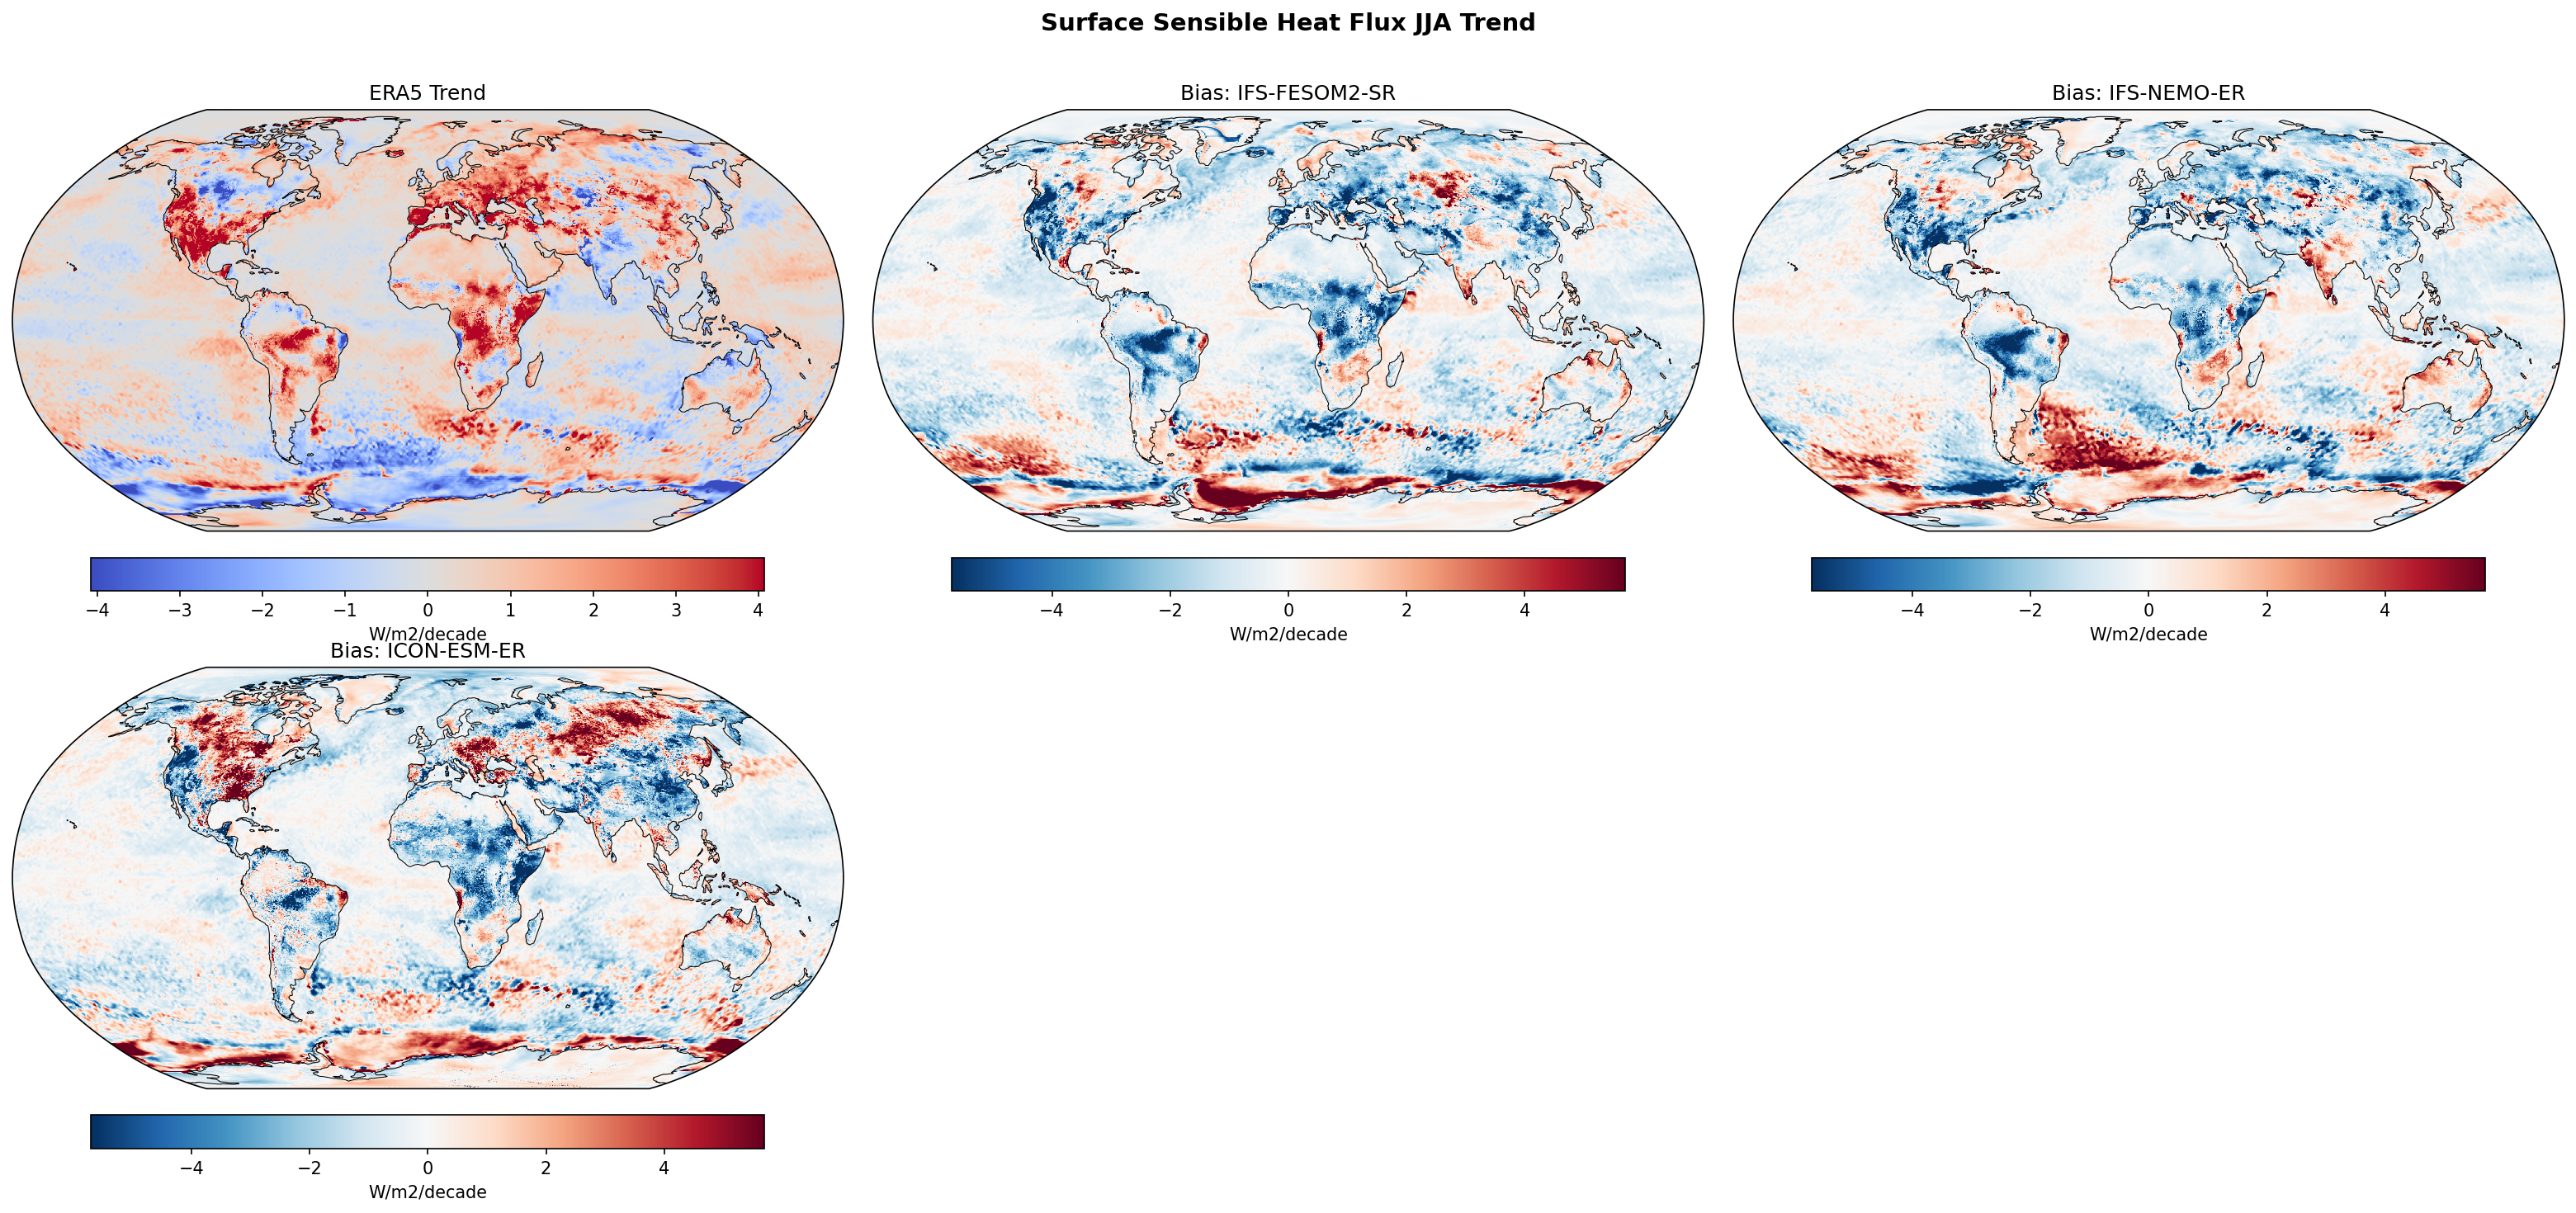
Summary high
This figure evaluates annual linear trends in surface sensible heat flux (1980–2014) from ERA5 and the corresponding trend biases (model minus observation) for three high-resolution coupled models: IFS-FESOM2-SR, IFS-NEMO-ER, and ICON-ESM-ER.
Key Findings
- ERA5 shows significant positive trends (increased heat flux to atmosphere) over tropical land masses (Amazon, Southern Africa) and Western Boundary Currents (Gulf Stream, Kuroshio).
- All three models exhibit widespread negative trend biases (blue regions) over these key areas, indicating they underestimate the observed increase in sensible heat flux.
- IFS-NEMO-ER performs best statistically with the lowest RMSE (1.20 W/m²/decade) and the smallest global mean trend difference, although the spatial pattern of bias is consistent across all models.
- Strong local biases appear in the Southern Ocean and polar regions, likely associated with differences in sea ice retreat trends.
Spatial Patterns
The observation (ERA5) is characterized by positive trends over the Amazon, Central/Southern Africa, and major ocean currents. In contrast, the bias maps for all models are dominated by negative values in these regions. Specifically, the Amazon and Congo basins show deep blue biases, meaning models fail to capture the magnitude of increasing sensible heat flux seen in reanalysis. Similarly, the North Atlantic Gulf Stream region shows a negative bias, implying model trends in ocean heat loss are weaker than observed. High-latitude biases (e.g., Weddell Sea) are dipolar, reflecting shifts in sea ice edges.
Model Agreement
There is high inter-model consistency regarding the sign and spatial distribution of the biases. All three models struggle to reproduce the positive trends over tropical continents and Western Boundary Currents. IFS-NEMO-ER shows slightly weaker biases (lighter blue) compared to IFS-FESOM2-SR and ICON-ESM-ER, but the underlying error structures are very similar.
Physical Interpretation
The positive trend in ERA5 sensible heat flux over tropical land likely reflects a combination of surface warming and potentially drying (shifting the Bowen ratio toward sensible heat). The models' negative bias suggests they may not simulate this drying/warming rate as strongly, possibly retaining more soil moisture or partitioning more energy into latent heat. Over the oceans, the underestimation of trends in Western Boundary Currents suggests the models may not be capturing the full extent of SST warming or the intensification of air-sea heat exchange in these eddy-rich regions over the 1980-2014 period.
Caveats
- ERA5 trends over land can be influenced by changes in the observing system and assimilation, so the 'true' trend is subject to uncertainty.
- The analysis period (1980-2014) captures a phase of rapid warming; trends may differ if extended to the present day.
Surface Sensible Heat Flux DJF Linear Trend
| Variables | hfss |
|---|---|
| Models | IFS-FESOM2-SR, IFS-NEMO-ER, ICON-ESM-ER |
| Reference Dataset | ERA5 |
| Units | W/m2/decade |
| Period | 1980–2014 |
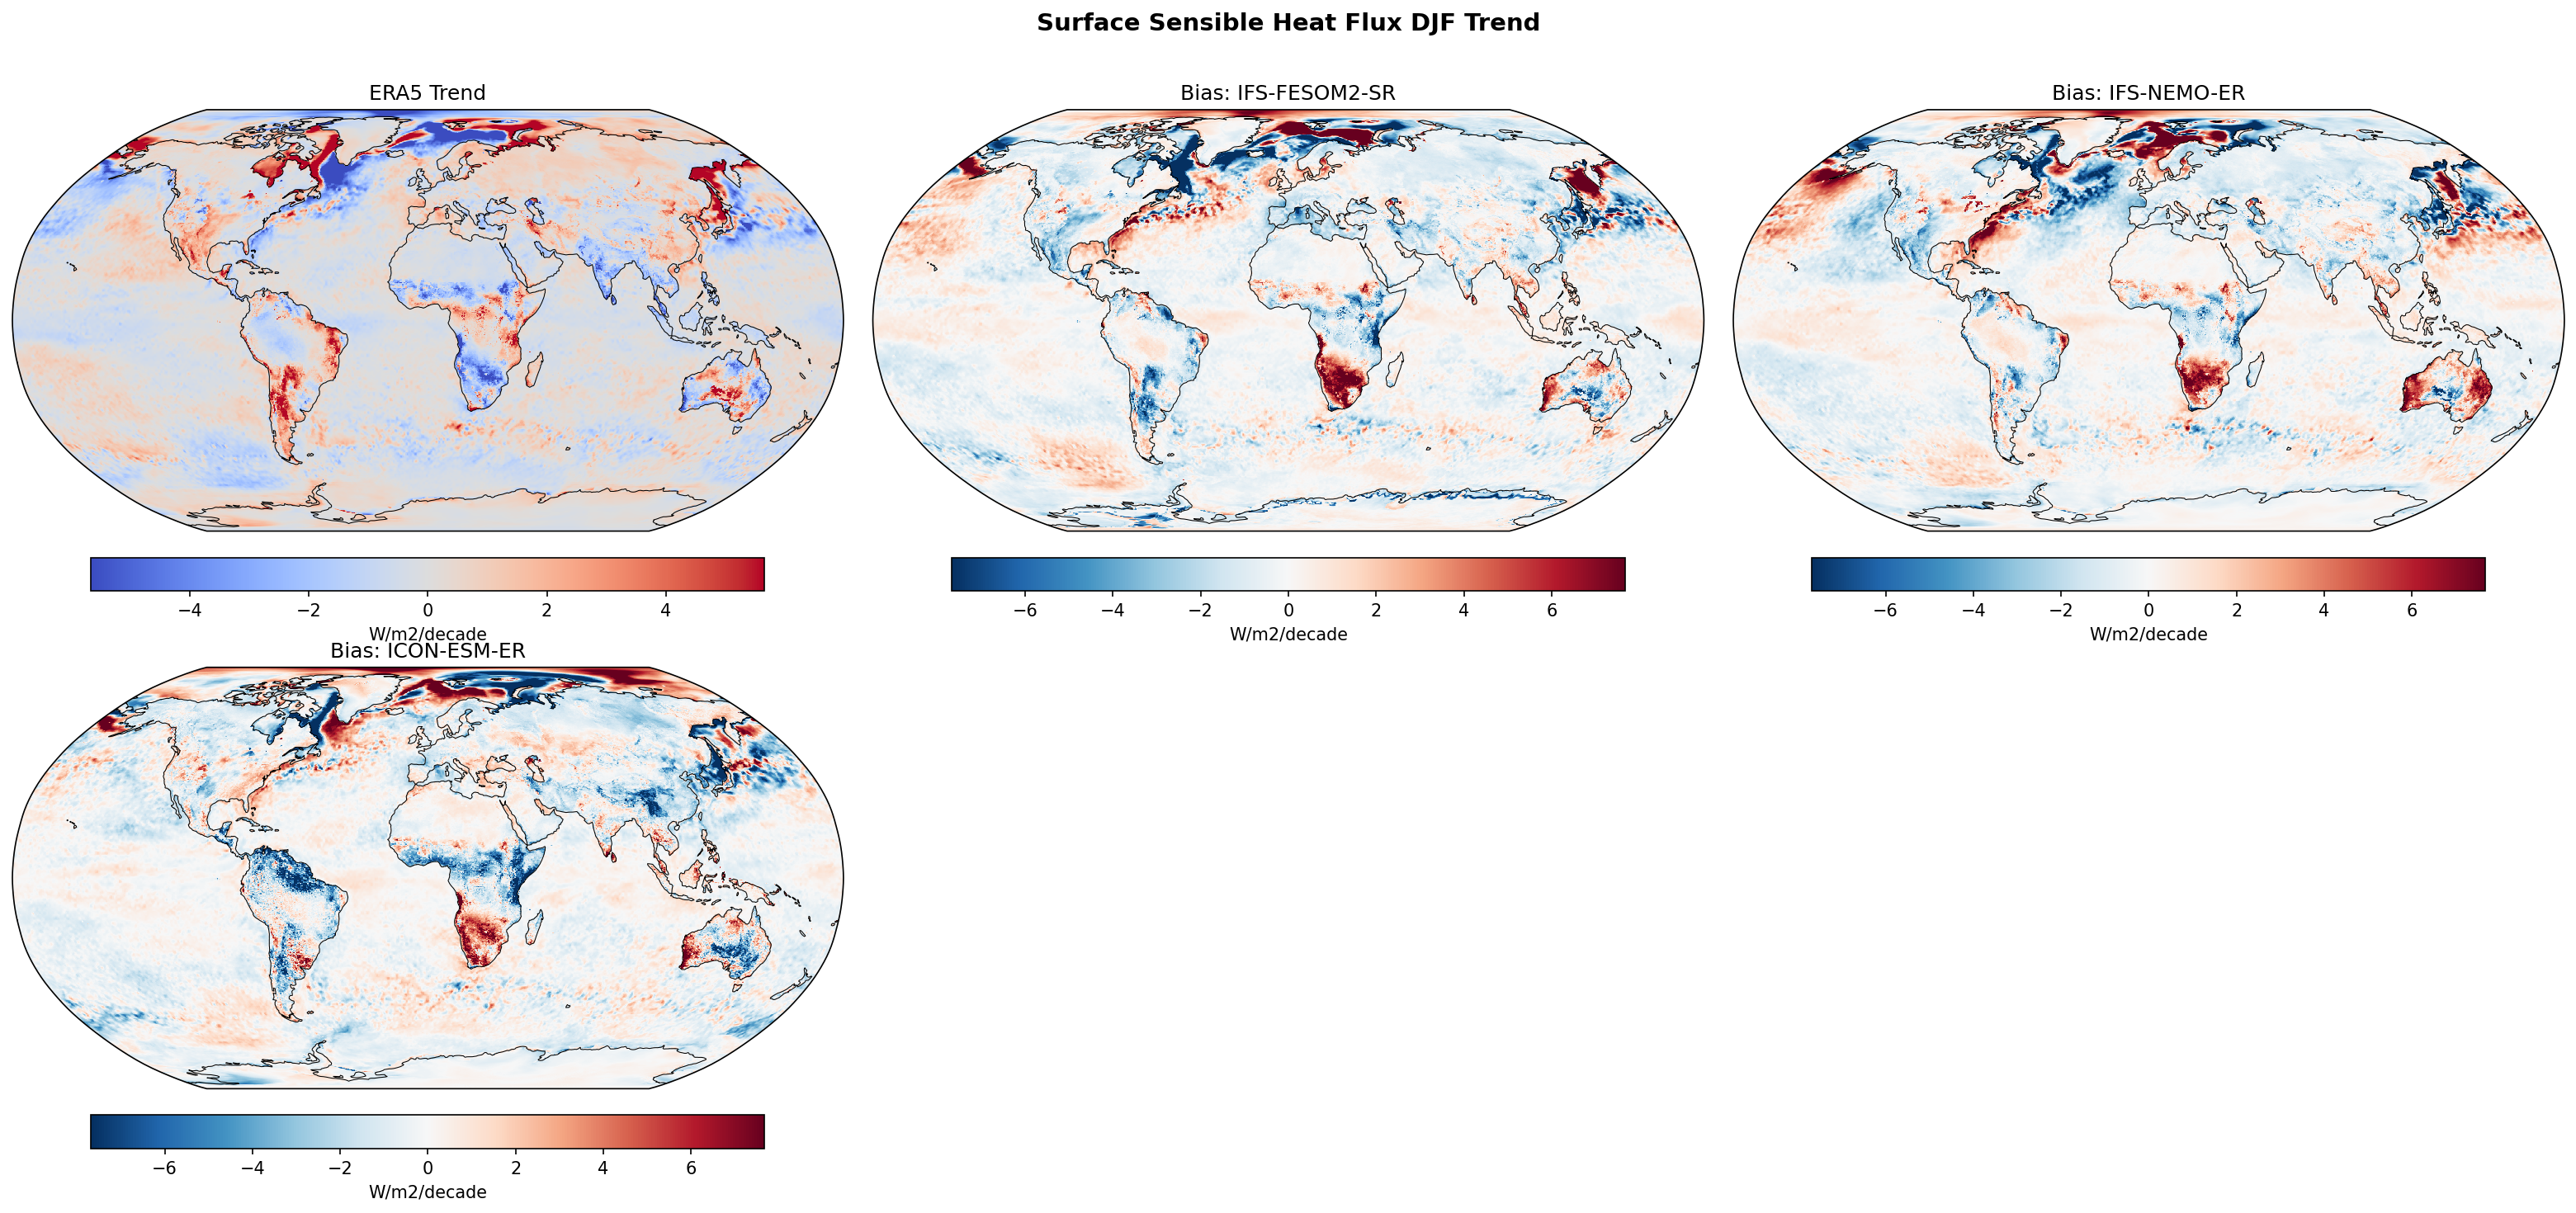
Summary high
This figure evaluates 1980–2014 linear trends in DJF Surface Sensible Heat Flux (SHF) against ERA5, revealing that while models capture broad global features, they significantly underestimate Arctic trends and struggle with North Atlantic circulation patterns.
Key Findings
- Arctic Sea Ice Feedback: ERA5 shows strong positive SHF trends (>4 W/m²/decade) in the Barents-Kara region due to sea ice retreat exposing warm water; all models exhibit strong negative biases here, indicating an underestimation of this sea-ice driven flux increase.
- North Atlantic Bias: Models display a systematic positive trend bias in the subpolar North Atlantic (south of Greenland), failing to reproduce the observed cooling trend (negative SHF trend) associated with the 'warming hole' or AMOC variability.
- Tropical Land Divergence: ICON-ESM-ER shows strong negative trend biases over the Amazon and Central Africa, whereas IFS-based models show weaker or mixed biases, suggesting distinct differences in land-surface coupling or hydrological cycle trends between the model families.
Spatial Patterns
Observations show distinct dipoles in the North Atlantic and North Pacific (western boundary currents) and strong signals at the sea ice edge. Model biases are spatially coherent: widespread negative biases in the Barents-Kara Sea, positive biases in the subpolar North Atlantic, and strong regional biases over Southern Africa (positive) and South America (mixed).
Model Agreement
IFS-FESOM2-SR and IFS-NEMO-ER show very similar bias patterns, implying the atmospheric component (IFS) or common forcing dominates the trend response. ICON-ESM-ER diverges significantly over land, particularly with intense negative biases in the tropical rainforest regions.
Physical Interpretation
In the Arctic, the negative bias suggests models have less winter sea ice loss or a dampened turbulent flux response to open water compared to ERA5. The North Atlantic biases likely result from a mismatch in the phasing of multi-decadal internal variability (e.g., AMOC, NAO) which coupled models are not constrained to match. Land biases reflect differences in soil moisture trends regulating the Bowen ratio.
Caveats
- As these are free-running coupled simulations, they are not expected to reproduce the exact phase of internal climate variability (e.g., specific decades of Atlantic Multidecadal Variability) observed in the historical record.
- Biases in trends over 35 years can be dominated by start/end point conditions.
Surface Sensible Heat Flux JJA Linear Trend
| Variables | hfss |
|---|---|
| Models | IFS-FESOM2-SR, IFS-NEMO-ER, ICON-ESM-ER |
| Reference Dataset | ERA5 |
| Units | W/m2/decade |
| Period | 1980–2014 |
Summary high
The figure illustrates linear trends in JJA surface sensible heat flux (1980–2014) for ERA5 and the trend biases (model minus ERA5) for IFS-FESOM2, IFS-NEMO, and ICON-ESM. ERA5 exhibits strong positive trends (increasing sensible heat) over Northern Hemisphere land masses, which IFS models generally underestimate, whereas ICON-ESM tends to overestimate them at high latitudes.
Key Findings
- ERA5 shows significant positive sensible heat flux trends (>2-3 W/m²/decade) over Western North America, Europe, and Western Russia, consistent with summer warming and land surface drying.
- Both IFS-based models (IFS-FESOM2-SR and IFS-NEMO-ER) display widespread negative trend biases (blue) over major land masses, particularly Western North America, the Amazon, and Central Africa, indicating they underestimate the observed increase in sensible heat flux.
- ICON-ESM-ER exhibits a distinct positive trend bias (red) over high-latitude land regions, specifically Northern Canada and Siberia, suggesting an overestimation of the sensible heat flux increase in these boreal zones compared to ERA5.
- IFS-FESOM2 and IFS-NEMO show high agreement in their atmospheric bias patterns, confirming that the atmospheric model component (IFS) dominates the surface flux response over land.
- Southern Ocean biases are prominent and dipolar in all models, likely reflecting discrepancies in sea ice edge migration and associated air-sea flux trends.
Spatial Patterns
The observational signal is dominated by land intensification of sensible heat in the summer hemisphere (NH). Biases are spatially coherent: IFS models show large-scale negative biases over tropical and mid-latitude continents, while ICON shows positive biases in high-latitude continental interiors. Oceanic trends are weaker, except near the Southern Ocean ice edge.
Model Agreement
There is strong agreement between the two IFS configurations (FESOM vs NEMO), indicating that ocean resolution/formulation has limited impact on these short-term continental flux trends. ICON-ESM diverges significantly from the IFS models in high latitudes, showing opposite sign biases (overestimation vs underestimation).
Physical Interpretation
Increases in sensible heat flux over land are typically driven by surface warming and soil moisture drying (shifting the Bowen ratio). The negative biases in IFS models suggest they may not capture the full extent of recent surface warming or the drying trends (limiting the shift from latent to sensible heat) seen in ERA5. Conversely, ICON's positive biases in boreal regions suggest excessive surface warming or drying in the model's high-latitude land surface scheme.
Caveats
- Trends are calculated over a relatively short period (1980-2014), making them susceptible to decadal internal variability.
- ERA5 is a reanalysis product; while it assimilates observations, surface fluxes are derived quantities and carry their own model uncertainties.
Total Precipitation Rate Annual Linear Trend
| Variables | pr |
|---|---|
| Models | IFS-FESOM2-SR, IFS-NEMO-ER, ICON-ESM-ER, HadGEM3-GC5, CMIP6 MMM, MPI-ESM1-2-LR/r1i1p1f1, GISS-E2-1-G/r1i1p1f2, IPSL-CM6A-LR/r1i1p1f1, ACCESS-ESM1-5/r1i1p1f1, EC-Earth3/r1i1p1f1, CNRM-CM6-1/r1i1p1f2, AWI-CM-1-1-MR/r1i1p1f1, CNRM-ESM2-1/r1i1p1f2, FGOALS-g3/r1i1p1f1, INM-CM5-0/r1i1p1f1, MRI-ESM2-0/r1i1p1f1 |
| Reference Dataset | ERA5 |
| Units | kg/m2/s/decade |
| Period | 1980–2014 |
| IFS-FESOM2-SR | Global Mean Trend: 0.00 · Global Mean Trend Diff: -0.00 · Trend Rmse: 0.00 |
| IFS-NEMO-ER | Global Mean Trend: 0.00 · Global Mean Trend Diff: -0.00 · Trend Rmse: 0.00 |
| ICON-ESM-ER | Global Mean Trend: 0.00 · Global Mean Trend Diff: -0.00 · Trend Rmse: 0.00 |
| HadGEM3-GC5 | Global Mean Trend: 0.00 · Global Mean Trend Diff: -0.00 · Trend Rmse: 0.00 |
| CMIP6 MMM | Global Mean Trend Diff: -0.00 · Trend Rmse: 0.00 |
| MPI-ESM1-2-LR/r1i1p1f1 | Global Mean Trend Diff: -0.00 · Trend Rmse: 0.00 |
| GISS-E2-1-G/r1i1p1f2 | Global Mean Trend Diff: -0.00 · Trend Rmse: 0.00 |
| IPSL-CM6A-LR/r1i1p1f1 | Global Mean Trend Diff: -0.00 · Trend Rmse: 0.00 |
| ACCESS-ESM1-5/r1i1p1f1 | Global Mean Trend Diff: -0.00 · Trend Rmse: 0.00 |
| EC-Earth3/r1i1p1f1 | Global Mean Trend Diff: -0.00 · Trend Rmse: 0.00 |
| CNRM-CM6-1/r1i1p1f2 | Global Mean Trend Diff: -0.00 · Trend Rmse: 0.00 |
| AWI-CM-1-1-MR/r1i1p1f1 | Global Mean Trend Diff: -0.00 · Trend Rmse: 0.00 |
| CNRM-ESM2-1/r1i1p1f2 | Global Mean Trend Diff: -0.00 · Trend Rmse: 0.00 |
| FGOALS-g3/r1i1p1f1 | Global Mean Trend Diff: -0.00 · Trend Rmse: 0.00 |
| INM-CM5-0/r1i1p1f1 | Global Mean Trend Diff: -0.00 · Trend Rmse: 0.00 |
| MRI-ESM2-0/r1i1p1f1 | Global Mean Trend Diff: -0.00 · Trend Rmse: 0.00 |
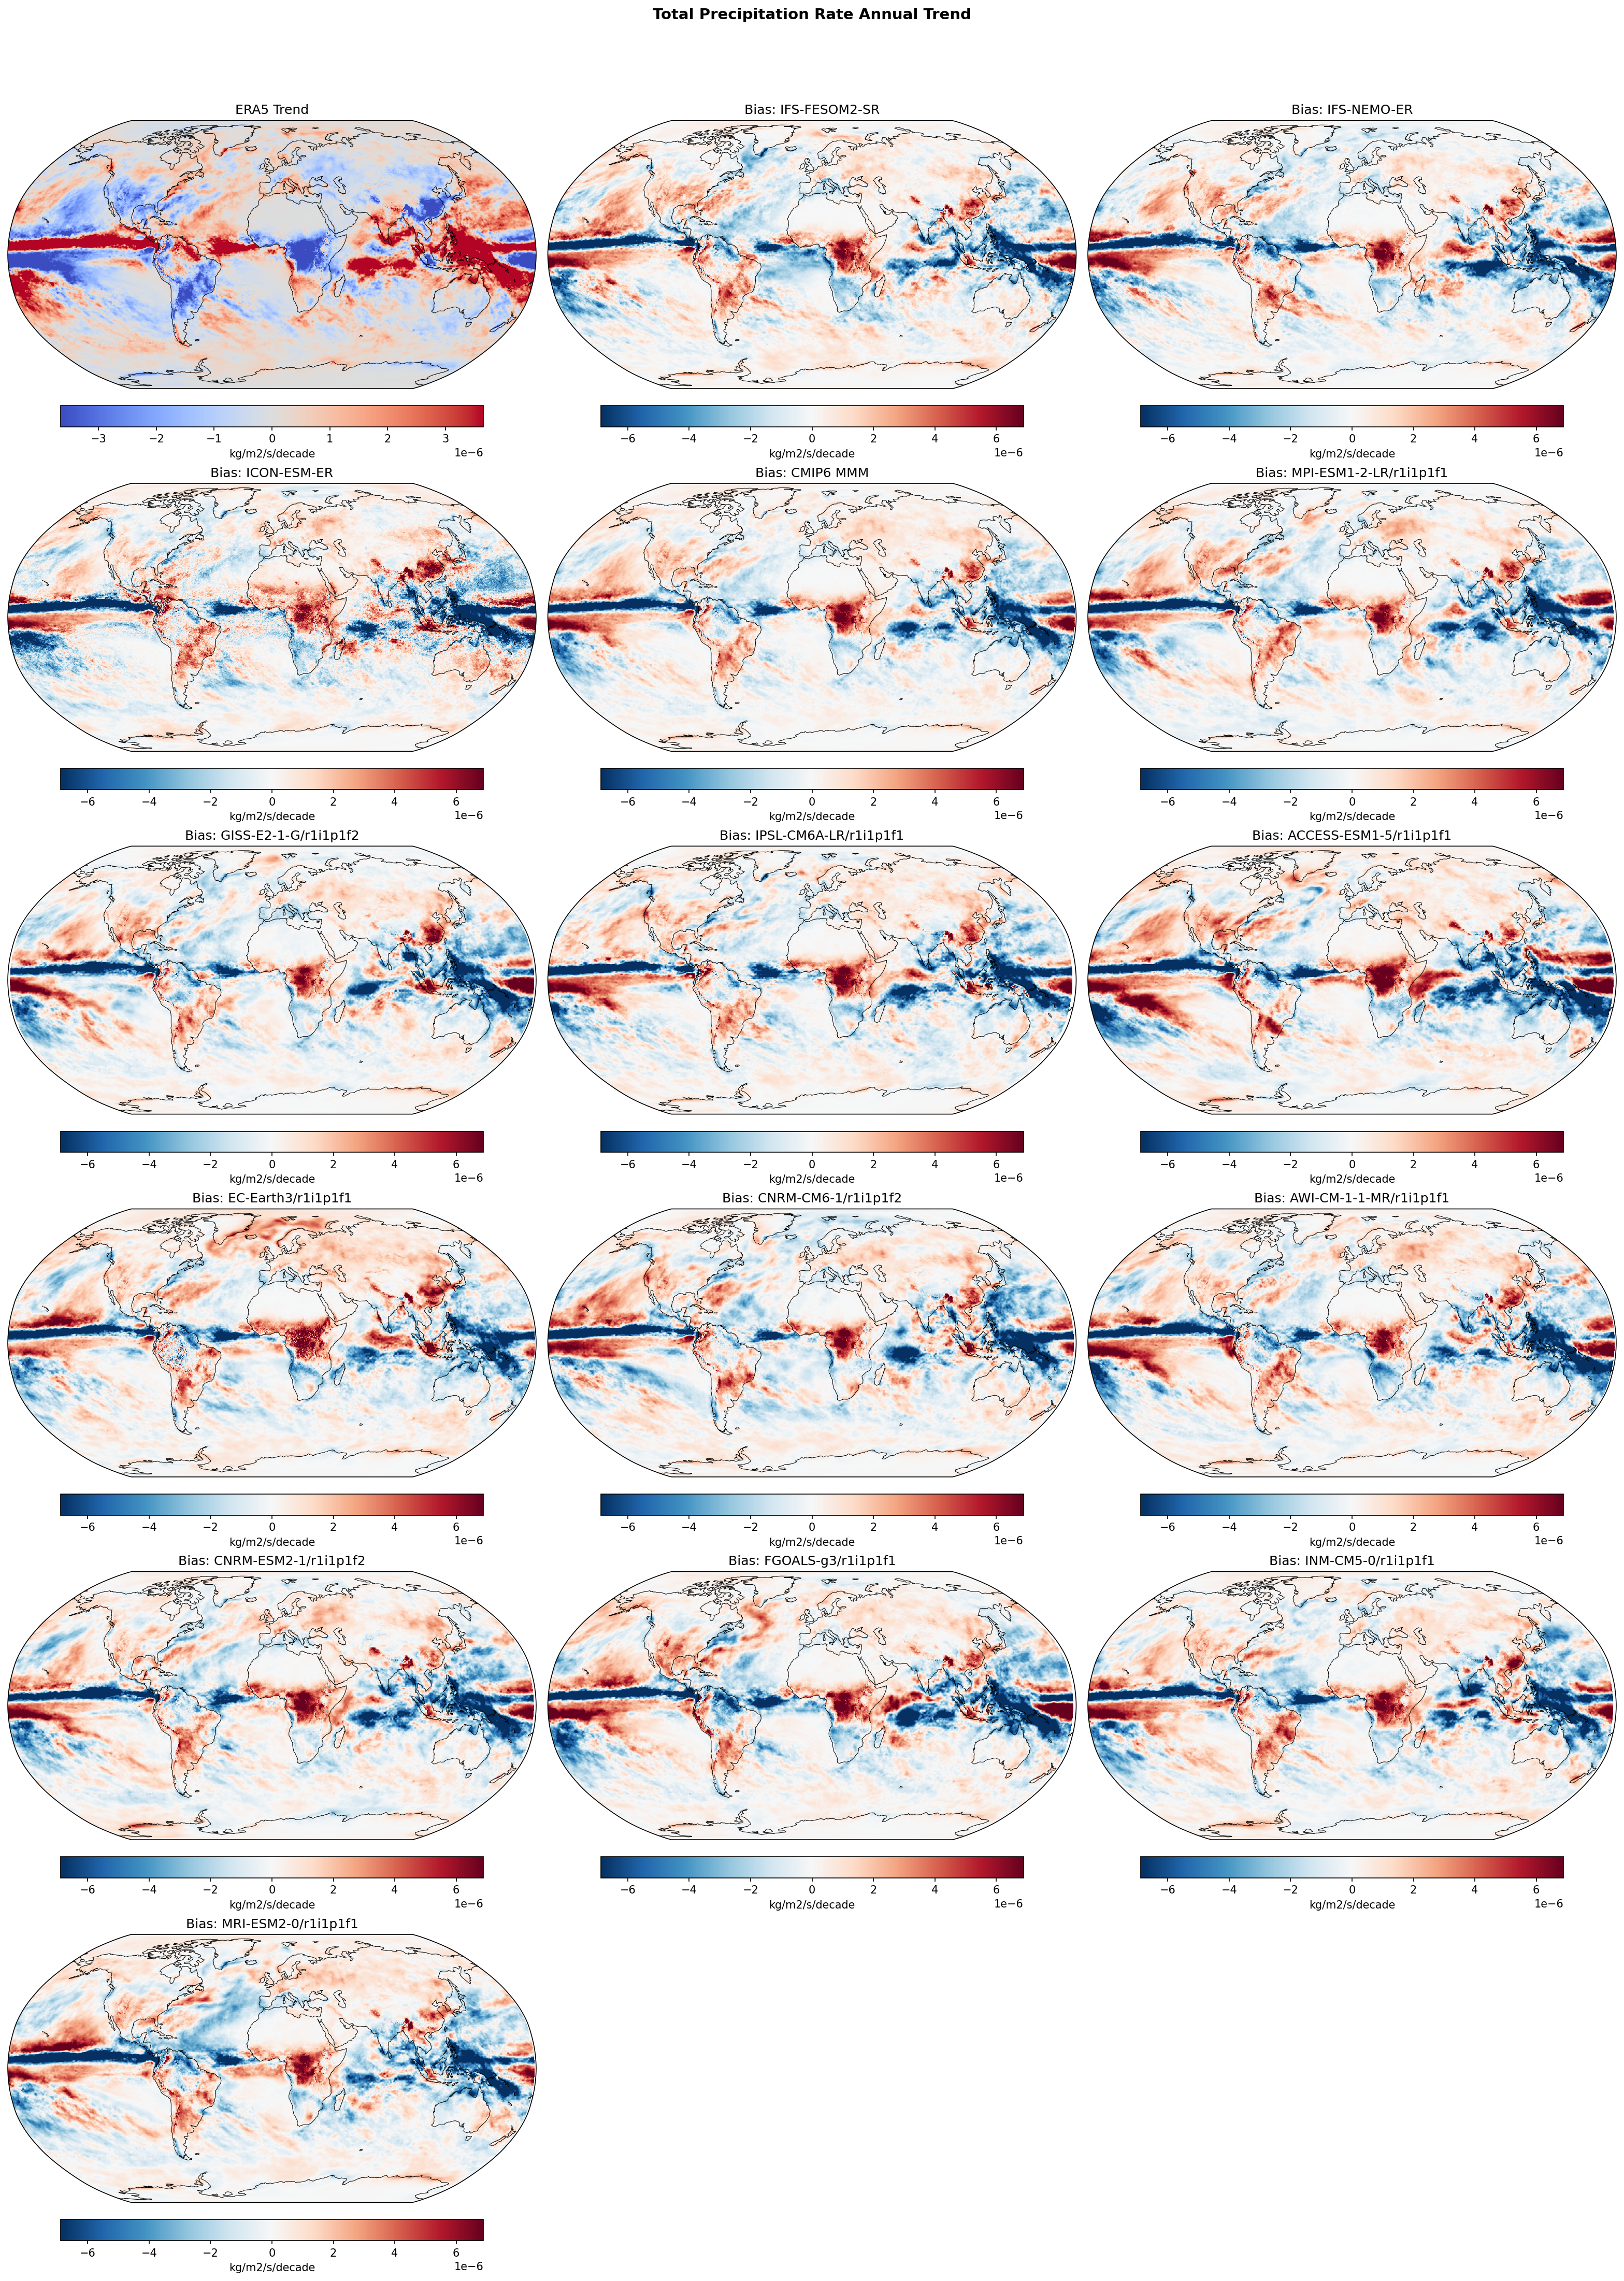
Summary high
This diagnostic evaluates annual precipitation trends (1980–2014) against ERA5, revealing a systematic failure across all models—regardless of resolution—to capture the observed intensification of the hydrological cycle in the tropical Pacific. While ERA5 shows strong wetting in the Maritime Continent and drying in the central/eastern Pacific, models consistently exhibit the opposite trend bias, leading to large-scale zonal errors in the tropics.
Key Findings
- All models display a prominent 'dipole' bias in the tropical Pacific trend: they underestimate the observed wetting in the west (negative difference) and overestimate wetting/underestimate drying in the central/east (positive difference).
- High-resolution models (IFS-FESOM2-SR, IFS-NEMO-ER, ICON-ESM-ER, HadGEM3-GC5) show no significant improvement over the standard-resolution CMIP6 Multi-Model Mean in capturing these decadal trends, with RMSE values generally comparable or slightly higher than the MMM (~2.4e-6 kg/m²/s/decade).
- Secondary bias patterns include a tendency for models to overestimate wetting trends in the western Indian Ocean and parts of the tropical Atlantic relative to ERA5.
Spatial Patterns
The dominant spatial feature in the bias plots is a zonal wavenumber-1 structure in the tropical Pacific. ERA5 trends show a 'La Niña-like' pattern (enhanced Walker circulation) with intense wetting over the Indo-Pacific warm pool and drying over the central Pacific. The difference maps (Model minus Obs) are dominated by a negative bias in the west and positive bias in the east, indicating models simulate a weakening or less-strengthened Walker circulation than observed.
Model Agreement
There is exceptionally high inter-model agreement regarding the sign and spatial structure of the trend bias in the tropical Pacific. The bias pattern in the eddy-rich models (e.g., IFS-FESOM2-SR, HadGEM3-GC5) is virtually indistinguishable from the coarse CMIP6 ensemble structure, suggesting the error stems from fundamental coupled feedbacks or forcing responses rather than spatial resolution.
Physical Interpretation
The pervasive bias reflects the 'SST trend pattern paradox,' where climate models historically simulate a warming eastern equatorial Pacific (El Niño-like trend) in response to greenhouse forcing, whereas observations from 1980–2014 show cooling/drying in the east and enhanced warming/wetting in the west. Because tropical precipitation is tightly coupled to SST convergence zones, the models' failure to capture the observed SST gradient strengthening translates directly into the misplaced precipitation trends (weakened Walker circulation signal) seen here.
Caveats
- The 1980–2014 period is short enough to be heavily influenced by internal climate variability (e.g., IPO phases); uninitialized coupled models are not expected to phase-match this variability, though the systematic nature of the mismatch across all models is concerning.
- Precipitation trends in ERA5 over the ocean are derived from reanalysis and have higher uncertainty than land station data, though the broad zonal pattern is consistent with satellite products like GPCP.
Total Precipitation Rate DJF Linear Trend
| Variables | pr |
|---|---|
| Models | IFS-FESOM2-SR, IFS-NEMO-ER, ICON-ESM-ER, HadGEM3-GC5, CMIP6 MMM, MPI-ESM1-2-LR/r1i1p1f1, GISS-E2-1-G/r1i1p1f2, IPSL-CM6A-LR/r1i1p1f1, ACCESS-ESM1-5/r1i1p1f1, EC-Earth3/r1i1p1f1, CNRM-CM6-1/r1i1p1f2, AWI-CM-1-1-MR/r1i1p1f1, CNRM-ESM2-1/r1i1p1f2, FGOALS-g3/r1i1p1f1, INM-CM5-0/r1i1p1f1, MRI-ESM2-0/r1i1p1f1 |
| Reference Dataset | ERA5 |
| Units | kg/m2/s/decade |
| Period | 1980–2014 |
| CMIP6 MMM | Global Mean Trend Diff: -0.00 · Trend Rmse: None |
| MPI-ESM1-2-LR/r1i1p1f1 | Global Mean Trend Diff: -0.00 · Trend Rmse: None |
| GISS-E2-1-G/r1i1p1f2 | Global Mean Trend Diff: -0.00 · Trend Rmse: None |
| IPSL-CM6A-LR/r1i1p1f1 | Global Mean Trend Diff: -0.00 · Trend Rmse: None |
| ACCESS-ESM1-5/r1i1p1f1 | Global Mean Trend Diff: -0.00 · Trend Rmse: None |
| EC-Earth3/r1i1p1f1 | Global Mean Trend Diff: -0.00 · Trend Rmse: None |
| CNRM-CM6-1/r1i1p1f2 | Global Mean Trend Diff: -0.00 · Trend Rmse: None |
| AWI-CM-1-1-MR/r1i1p1f1 | Global Mean Trend Diff: -0.00 · Trend Rmse: None |
| CNRM-ESM2-1/r1i1p1f2 | Global Mean Trend Diff: -0.00 · Trend Rmse: None |
| FGOALS-g3/r1i1p1f1 | Global Mean Trend Diff: -0.00 · Trend Rmse: None |
| INM-CM5-0/r1i1p1f1 | Global Mean Trend Diff: -0.00 · Trend Rmse: None |
| MRI-ESM2-0/r1i1p1f1 | Global Mean Trend Diff: -0.00 · Trend Rmse: None |
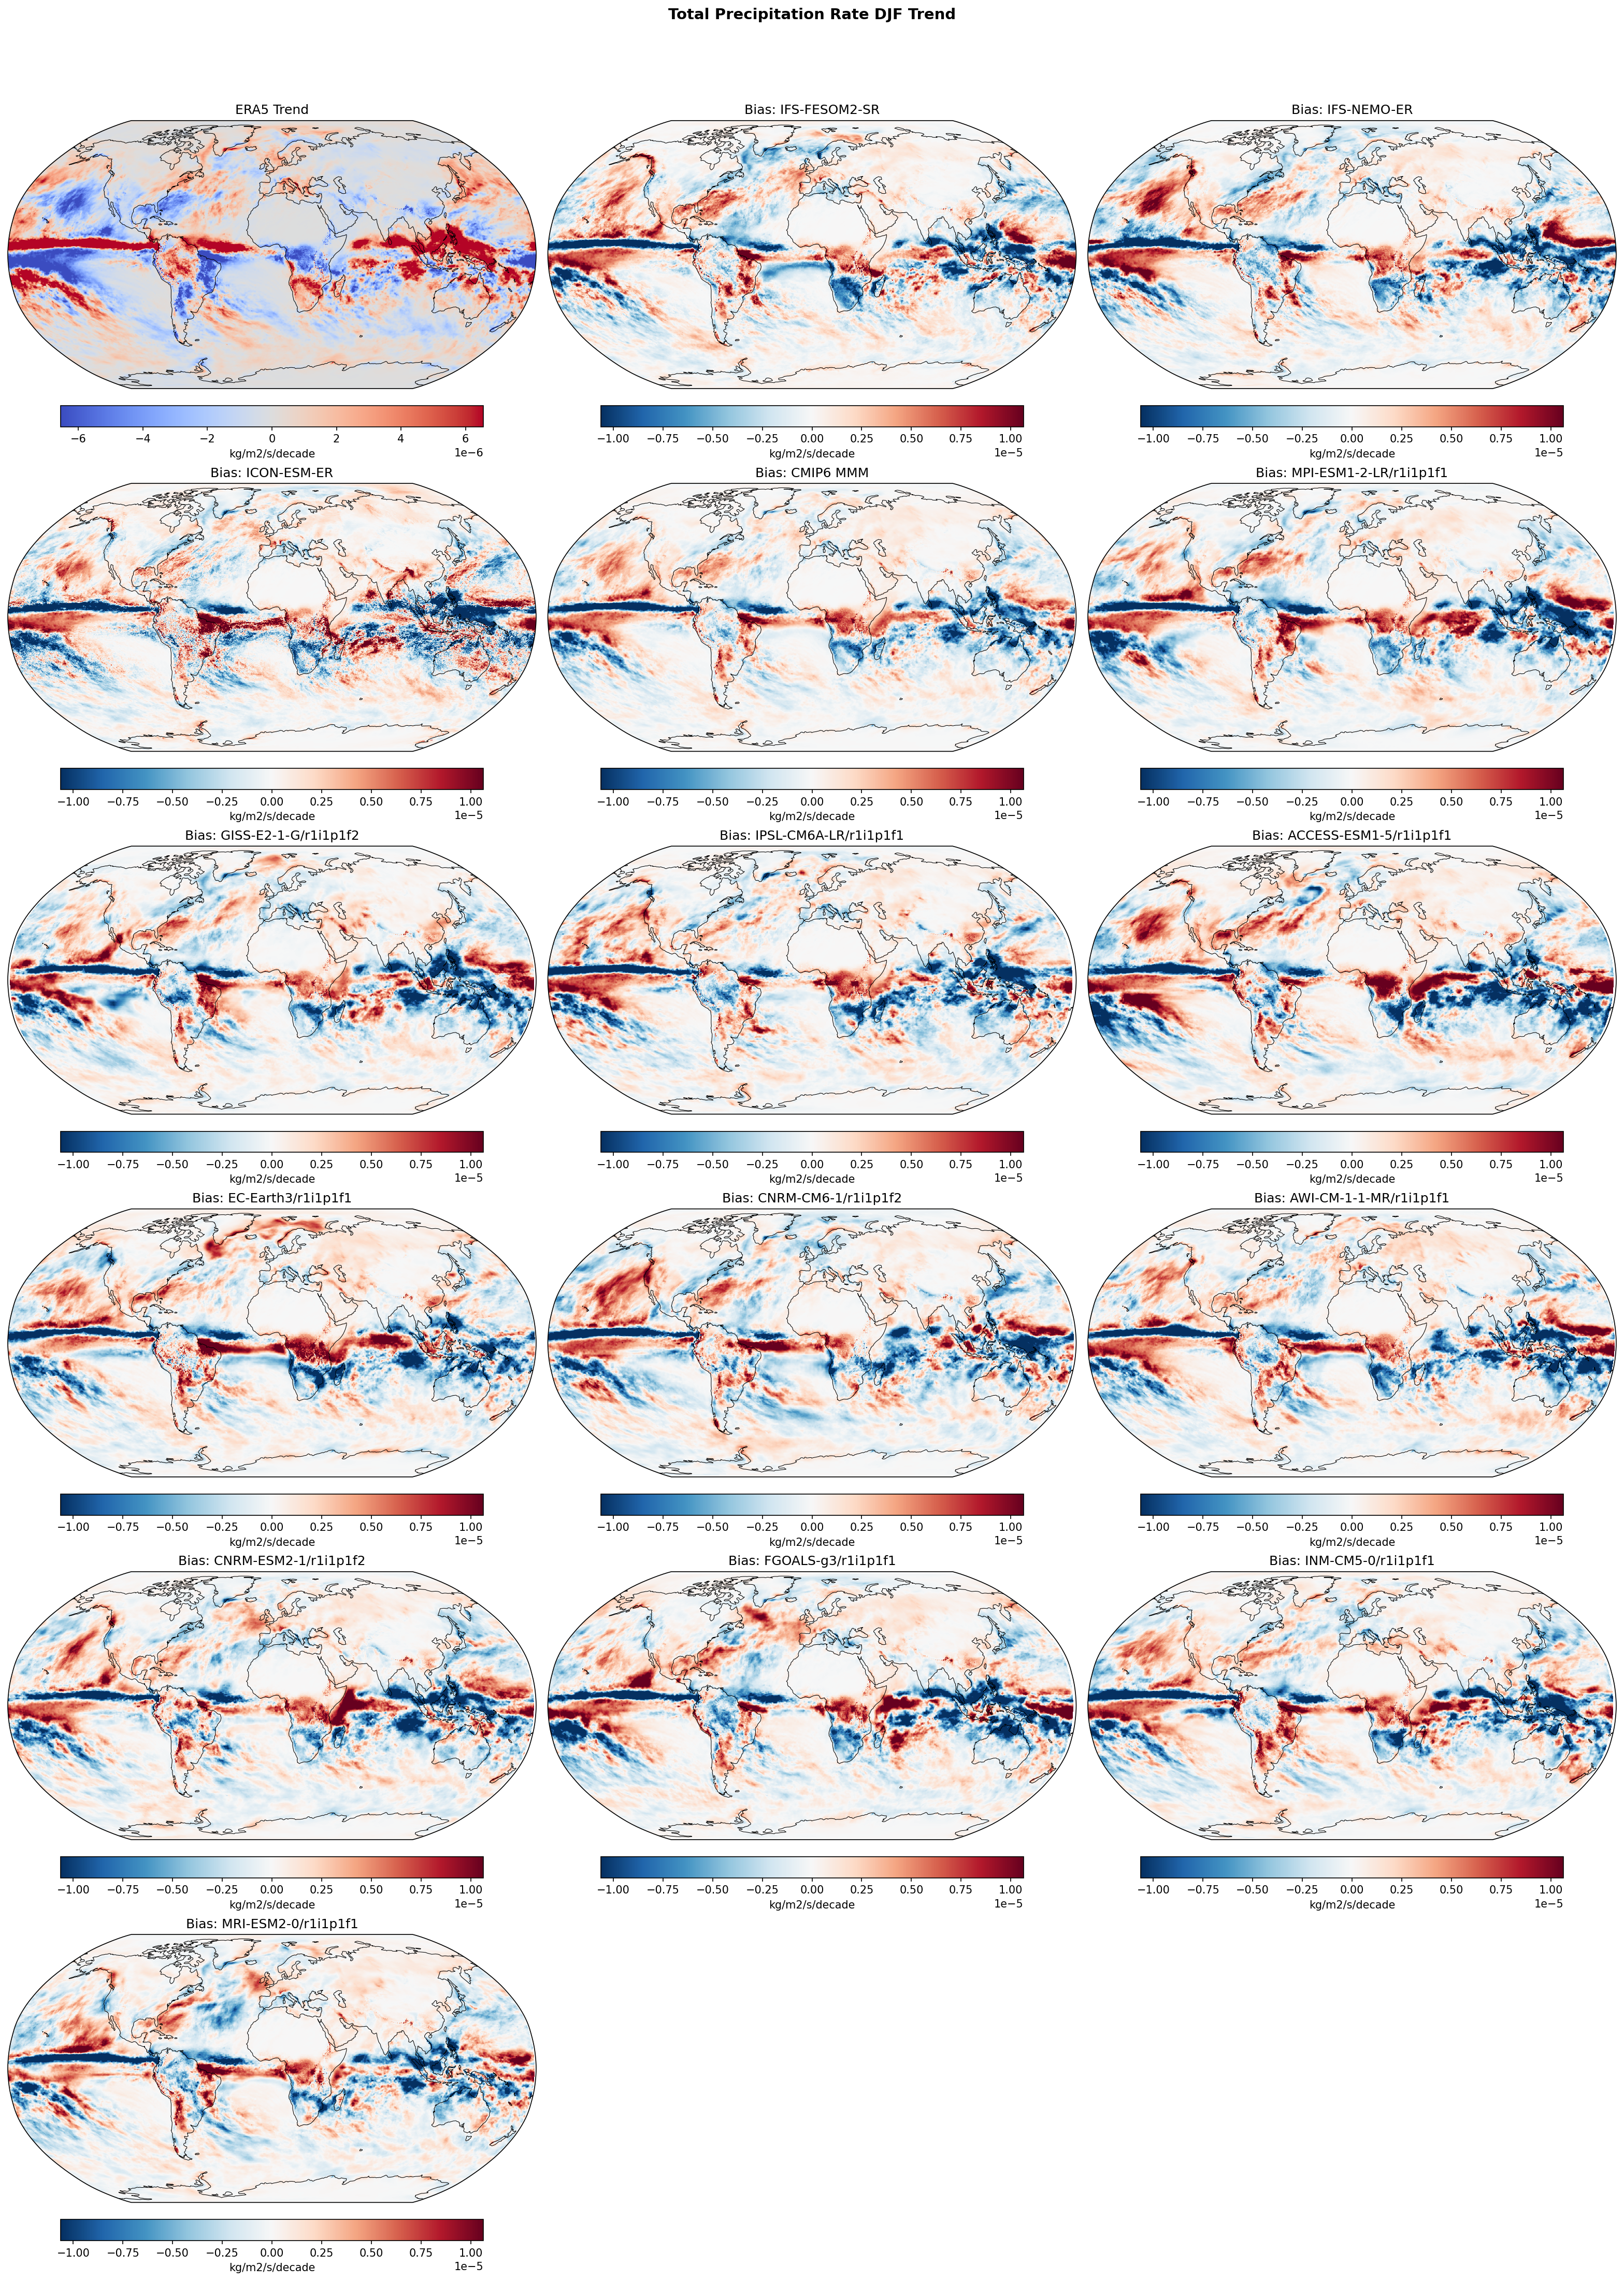
Summary high
This figure compares the linear trend in DJF total precipitation (1980–2014) between ERA5 reanalysis and various climate models, including high-resolution EERIE simulations and CMIP6. The comparison reveals a stark and systematic disagreement in the tropical Pacific, where models fail to replicate the observed La Niña-like precipitation trend.
Key Findings
- A systematic 'dipole' bias dominates the tropical Pacific in all model panels: models show a relative wet trend bias in the central/eastern Pacific and a dry trend bias in the western Pacific/Maritime Continent compared to ERA5.
- The high-resolution EERIE models (IFS-FESOM2-SR, IFS-NEMO-ER, ICON-ESM-ER, HadGEM3-GC5) exhibit the same large-scale trend discrepancies as the standard CMIP6 ensemble, indicating that increased resolution does not resolve this issue.
- The magnitude of the trend difference (bias) often exceeds the magnitude of the observed trend itself, particularly in the tropics (bias scale ±1.0e-5 vs obs scale ±6e-6 kg/m²/s/decade).
Spatial Patterns
The ERA5 trend shows a complex pattern with wetting in the western Pacific and parts of the ITCZ. The bias maps (Model - Obs) are dominated by a strong, coherent pattern: positive (wet) differences along the equatorial central and eastern Pacific and negative (dry) differences over the Maritime Continent and western Pacific. Similar but less intense dipole biases are visible in the Indian Ocean (wet bias in western IO, dry in eastern). Extratropical patterns are more heterogeneous and noisy.
Model Agreement
There is remarkably high qualitative agreement across all models (both EERIE and CMIP6) regarding the sign and spatial structure of the trend error in the tropical Pacific. No single model successfully captures the observed pattern; the CMIP6 Multi-Model Mean (MMM) shows the error clearly, smoothing out internal noise but highlighting the systematic nature of the discrepancy.
Physical Interpretation
The mismatch arises because the observed period (1980–2014) was characterized by a strengthening of the Walker circulation (La Niña-like trend) associated with the negative phase of the Interdecadal Pacific Oscillation (IPO). Free-running coupled models, however, typically produce a weakening Walker circulation trend in response to greenhouse gas forcing (El Niño-like warming) and do not synchronize their internal decadal variability phases with the real world. Consequently, the 'Bias' maps essentially show an El Niño-like precipitation pattern (wet East/dry West relative to obs).
Caveats
- The 35-year analysis period is short relative to decadal climate variability modes (e.g., IPO/PDO), so trend differences may largely reflect internal variability sampling rather than model physics errors.
- Uncoupled or initialized runs would be needed to separate forced trend errors from internal variability mismatches.
Total Precipitation Rate JJA Linear Trend
| Variables | pr |
|---|---|
| Models | IFS-FESOM2-SR, IFS-NEMO-ER, ICON-ESM-ER, HadGEM3-GC5, CMIP6 MMM, MPI-ESM1-2-LR/r1i1p1f1, GISS-E2-1-G/r1i1p1f2, IPSL-CM6A-LR/r1i1p1f1, ACCESS-ESM1-5/r1i1p1f1, EC-Earth3/r1i1p1f1, CNRM-CM6-1/r1i1p1f2, AWI-CM-1-1-MR/r1i1p1f1, CNRM-ESM2-1/r1i1p1f2, FGOALS-g3/r1i1p1f1, INM-CM5-0/r1i1p1f1, MRI-ESM2-0/r1i1p1f1 |
| Reference Dataset | ERA5 |
| Units | kg/m2/s/decade |
| Period | 1980–2014 |
| CMIP6 MMM | Global Mean Trend Diff: -0.00 · Trend Rmse: None |
| MPI-ESM1-2-LR/r1i1p1f1 | Global Mean Trend Diff: -0.00 · Trend Rmse: None |
| GISS-E2-1-G/r1i1p1f2 | Global Mean Trend Diff: -0.00 · Trend Rmse: None |
| IPSL-CM6A-LR/r1i1p1f1 | Global Mean Trend Diff: -0.00 · Trend Rmse: None |
| ACCESS-ESM1-5/r1i1p1f1 | Global Mean Trend Diff: -0.00 · Trend Rmse: None |
| EC-Earth3/r1i1p1f1 | Global Mean Trend Diff: 0.00 · Trend Rmse: None |
| CNRM-CM6-1/r1i1p1f2 | Global Mean Trend Diff: -0.00 · Trend Rmse: None |
| AWI-CM-1-1-MR/r1i1p1f1 | Global Mean Trend Diff: -0.00 · Trend Rmse: None |
| CNRM-ESM2-1/r1i1p1f2 | Global Mean Trend Diff: -0.00 · Trend Rmse: None |
| FGOALS-g3/r1i1p1f1 | Global Mean Trend Diff: -0.00 · Trend Rmse: None |
| INM-CM5-0/r1i1p1f1 | Global Mean Trend Diff: -0.00 · Trend Rmse: None |
| MRI-ESM2-0/r1i1p1f1 | Global Mean Trend Diff: -0.00 · Trend Rmse: None |
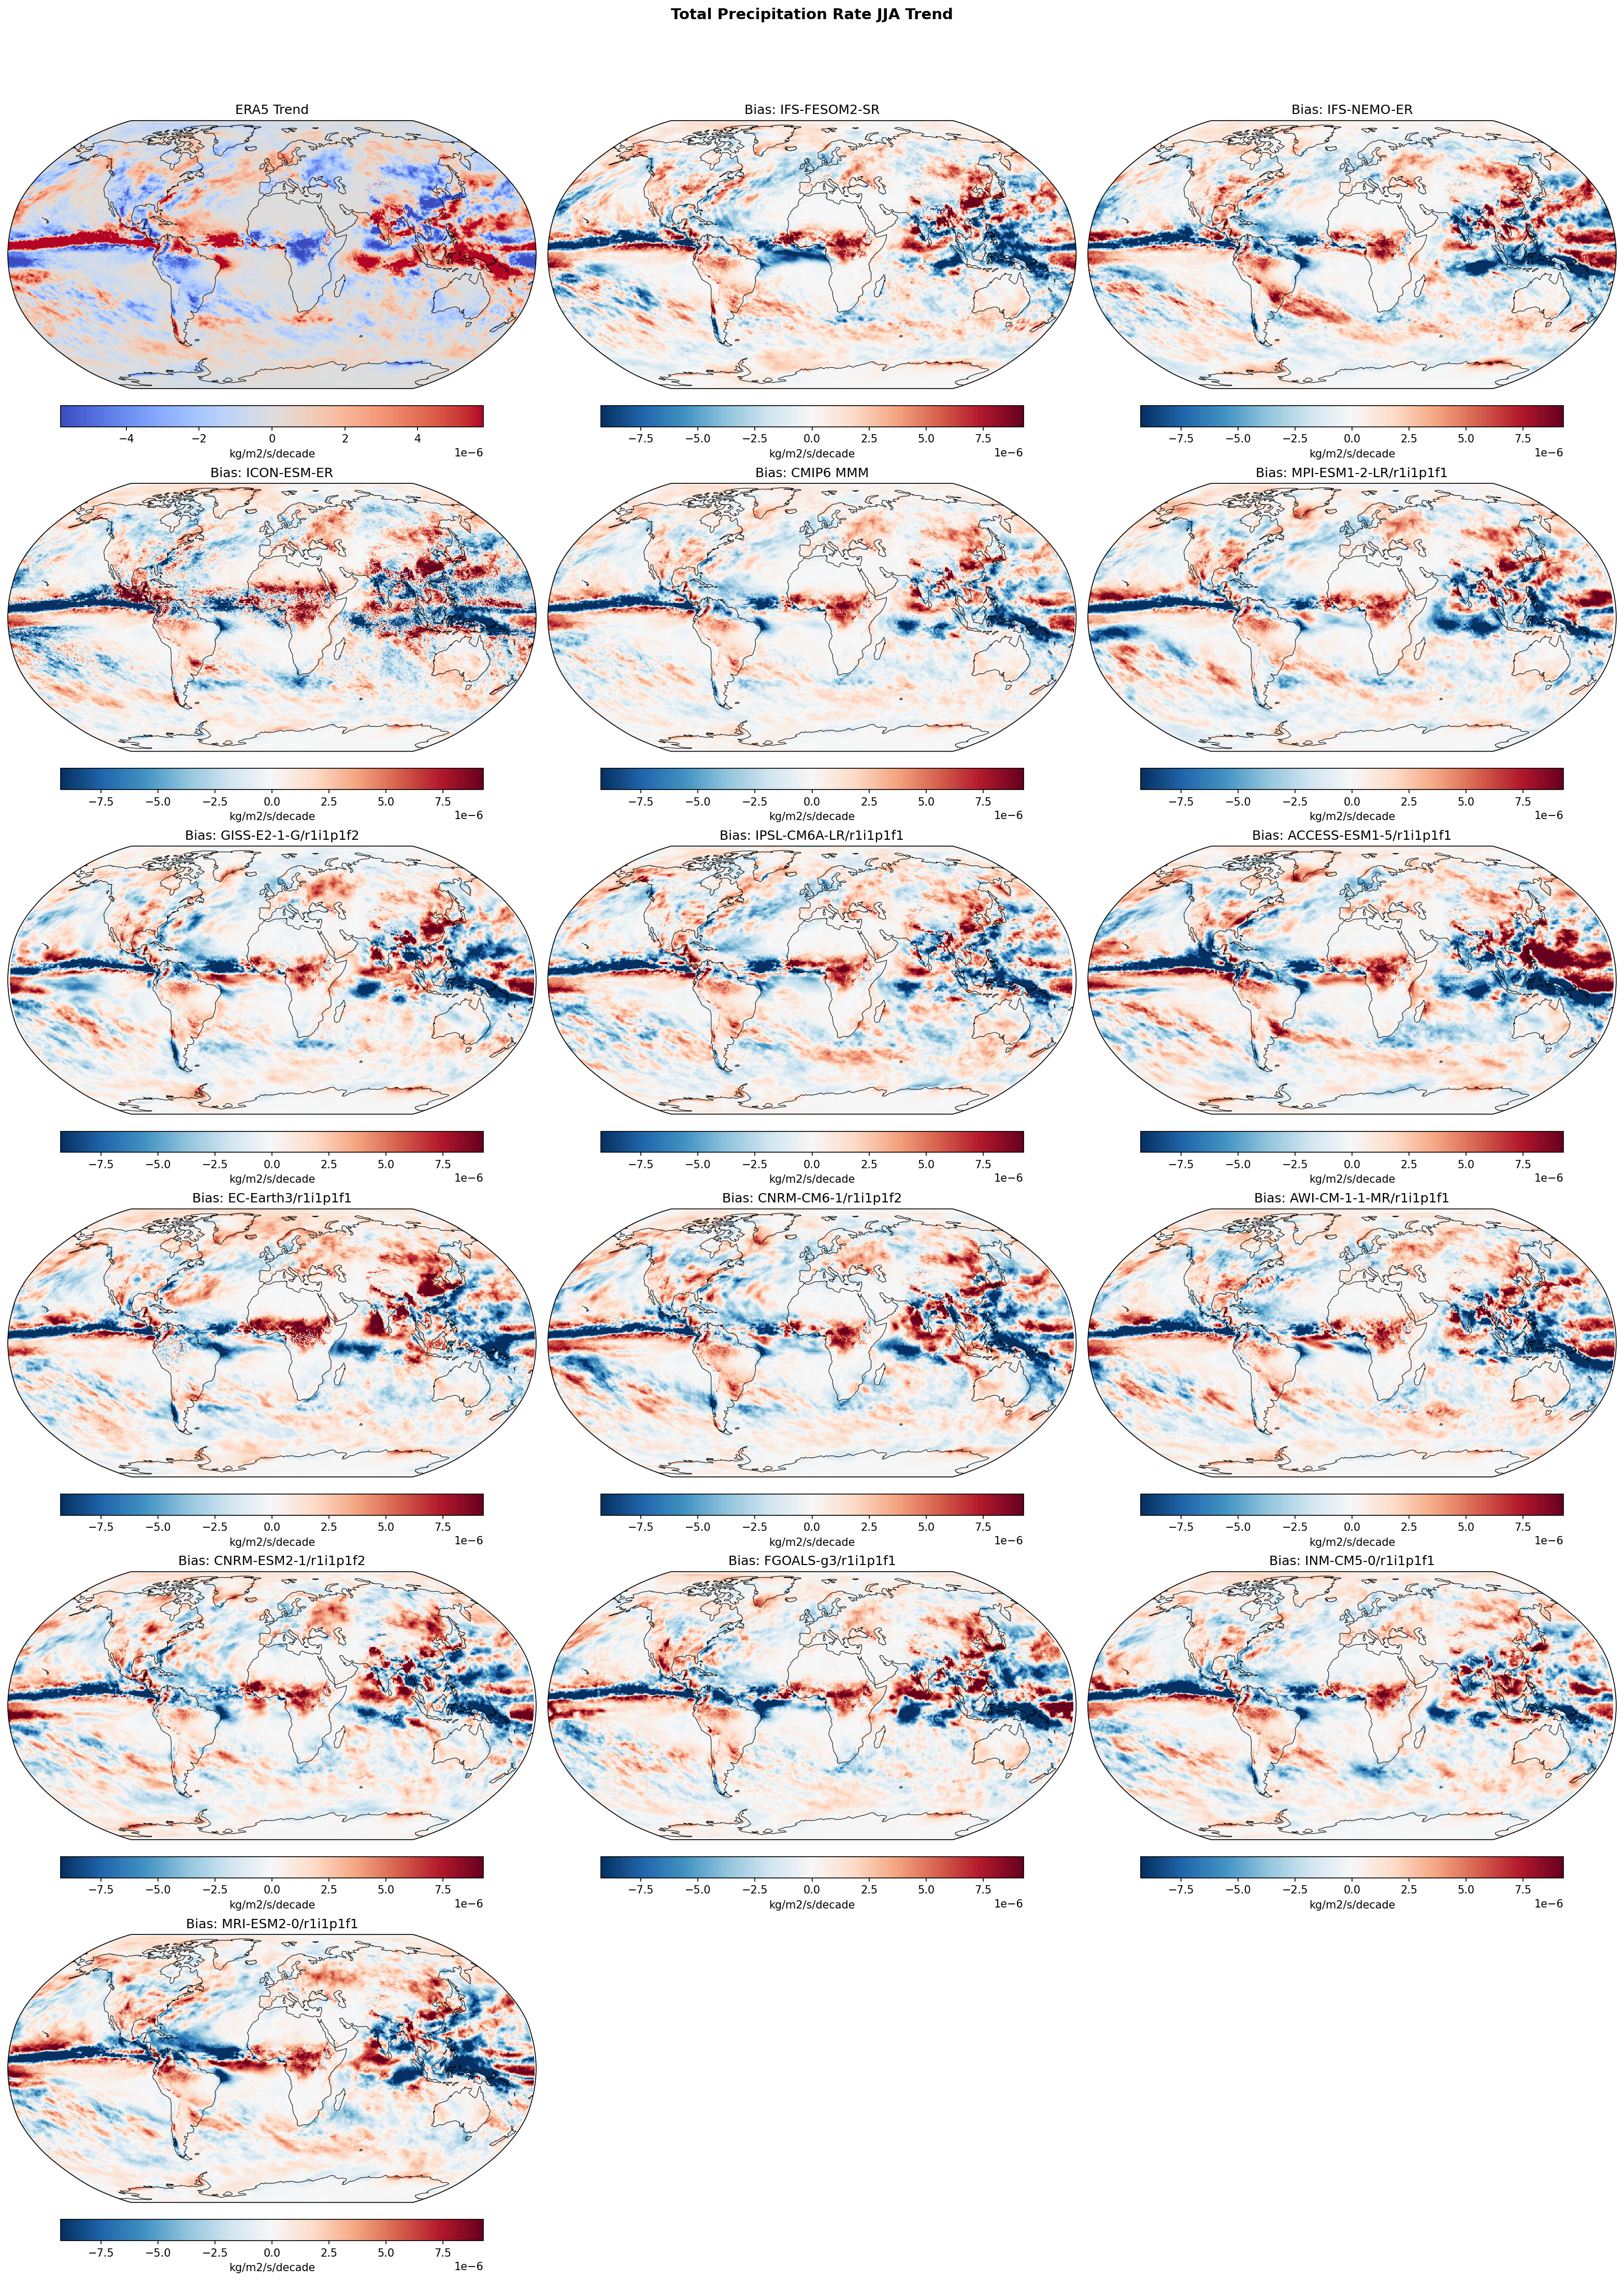
Summary high
This figure evaluates linear trends in JJA precipitation rate (1980–2014) for EERIE high-resolution models and CMIP6 models against ERA5 reanalysis. The dominant feature is a systematic widespread failure of models to capture the observed zonal trend pattern in the tropical Pacific.
Key Findings
- ERA5 displays a distinct 'La Niña-like' trend pattern in the tropical Pacific: drying (blue) in the central/eastern equatorial region and wetting (red) in the Western Pacific/Maritime Continent.
- Virtually all models (EERIE and CMIP6) exhibit a striking dipole bias: positive trend differences (red) in the Central Pacific and negative differences (blue) in the Western Pacific.
- This bias indicates that the models fail to reproduce the observed strengthening of the Walker circulation over this period, instead producing weak or El Niño-like warming trends.
- The high-resolution EERIE models (IFS-FESOM2-SR, IFS-NEMO-ER, ICON-ESM-ER, HadGEM3-GC5) show no significant improvement over standard CMIP6 models in capturing this multidecadal trend feature.
- HadGEM3-GC5 shows notably higher amplitude trend biases in the Indo-Pacific warm pool compared to the IFS-based models.
Spatial Patterns
The observation panel shows a strengthening zonal precipitation gradient (wet West, dry East) along the equator. The bias panels are dominated by the inverse of this pattern (dry bias West, wet bias East), suggesting the model trends are near-zero or opposite to observations. This dipole error structure is the primary signal in the global maps, dwarfing regional mismatches elsewhere.
Model Agreement
There is very high inter-model agreement regarding the sign and spatial structure of the trend bias. The CMIP6 Multi-Model Mean (MMM) resembles the individual high-resolution simulations, confirming that this is a systematic deficiency in coupled climate models regardless of horizontal resolution (up to ~10 km).
Physical Interpretation
The bias reflects the well-known discrepancy in historical SST and circulation trends: while the real world experienced a cooling eastern Pacific and strengthened trade winds (likely associated with the negative phase of the Interdecadal Pacific Oscillation or external forcing response), coupled models generally simulate a weakening Walker circulation or uniform warming. Consequently, models do not simulate the precipitation suppression in the central Pacific or the intensification in the west seen in ERA5.
Caveats
- The analysis period (1980-2014) is relatively short and heavily influenced by internal decadal variability (IPO), which free-running coupled models are not expected to phase-match.
- ERA5 precipitation trends over the tropical oceans are derived from data assimilation and model physics, carrying higher uncertainty than direct gauge data.
Mean Sea Level Pressure Annual Linear Trend
| Variables | psl |
|---|---|
| Models | IFS-FESOM2-SR, IFS-NEMO-ER, ICON-ESM-ER, CMIP6 MMM, MPI-ESM1-2-LR/r1i1p1f1, GISS-E2-1-G/r1i1p1f2, IPSL-CM6A-LR/r1i1p1f1, ACCESS-ESM1-5/r1i1p1f1, EC-Earth3/r1i1p1f1, CNRM-CM6-1/r1i1p1f2, AWI-CM-1-1-MR/r1i1p1f1, CNRM-ESM2-1/r1i1p1f2, FGOALS-g3/r1i1p1f1, INM-CM5-0/r1i1p1f1, MRI-ESM2-0/r1i1p1f1 |
| Reference Dataset | ERA5 |
| Units | Pa/decade |
| Period | 1980–2014 |
| IFS-FESOM2-SR | Global Mean Trend: -1.97 · Global Mean Trend Diff: -7.20 · Trend Rmse: 28.70 |
| IFS-NEMO-ER | Global Mean Trend: -1.48 · Global Mean Trend Diff: -6.71 · Trend Rmse: 23.64 |
| ICON-ESM-ER | Global Mean Trend: -1.36 · Global Mean Trend Diff: -6.59 · Trend Rmse: 22.56 |
| CMIP6 MMM | Global Mean Trend Diff: -5.92 · Trend Rmse: 21.65 |
| MPI-ESM1-2-LR/r1i1p1f1 | Global Mean Trend Diff: -6.64 · Trend Rmse: 25.69 |
| GISS-E2-1-G/r1i1p1f2 | Global Mean Trend Diff: -6.93 · Trend Rmse: 22.88 |
| IPSL-CM6A-LR/r1i1p1f1 | Global Mean Trend Diff: -7.58 · Trend Rmse: 28.03 |
| ACCESS-ESM1-5/r1i1p1f1 | Global Mean Trend Diff: -4.47 · Trend Rmse: 32.15 |
| EC-Earth3/r1i1p1f1 | Global Mean Trend Diff: -2.13 · Trend Rmse: 28.19 |
| CNRM-CM6-1/r1i1p1f2 | Global Mean Trend Diff: -4.38 · Trend Rmse: 32.79 |
| AWI-CM-1-1-MR/r1i1p1f1 | Global Mean Trend Diff: -7.37 · Trend Rmse: 26.68 |
| CNRM-ESM2-1/r1i1p1f2 | Global Mean Trend Diff: -3.34 · Trend Rmse: 25.78 |
| FGOALS-g3/r1i1p1f1 | Global Mean Trend Diff: -7.29 · Trend Rmse: 31.49 |
| INM-CM5-0/r1i1p1f1 | Global Mean Trend Diff: -7.75 · Trend Rmse: 26.52 |
| MRI-ESM2-0/r1i1p1f1 | Global Mean Trend Diff: -7.17 · Trend Rmse: 33.55 |
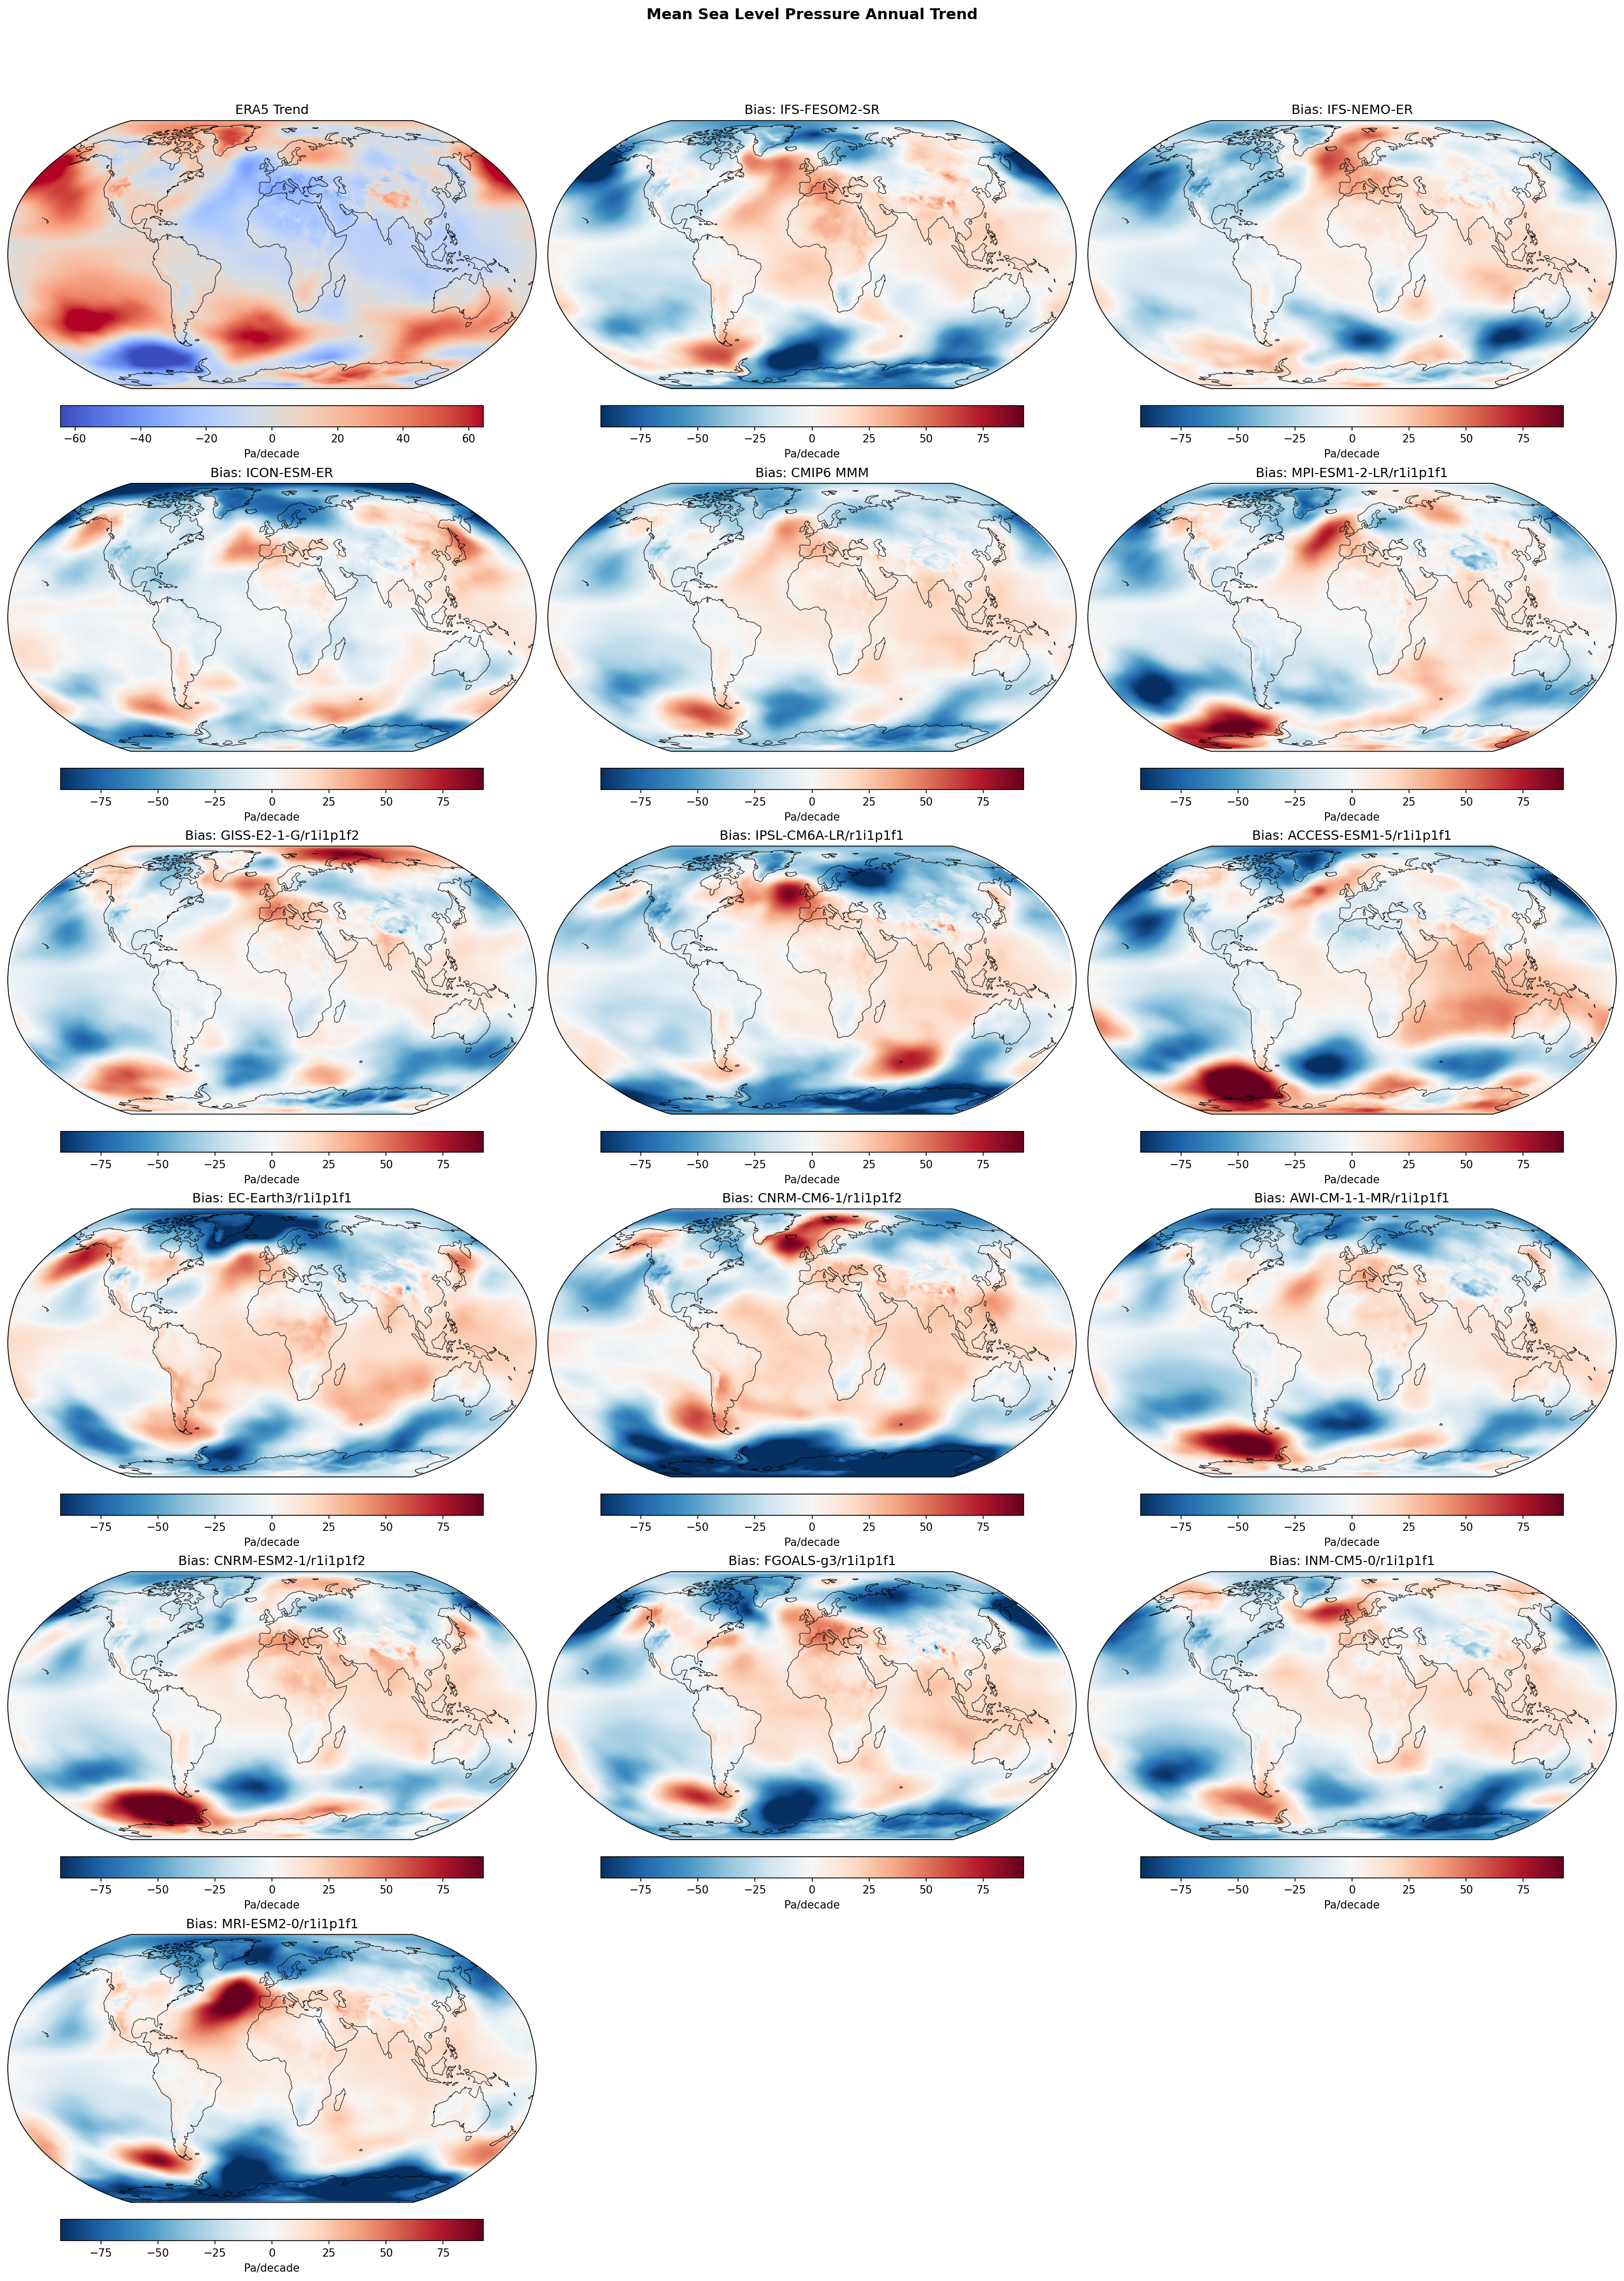
Summary high
This figure evaluates the annual linear trend in Mean Sea Level Pressure (MSLP) from 1980 to 2014, comparing ERA5 reanalysis with three high-resolution EERIE models (IFS-FESOM2-SR, IFS-NEMO-ER, ICON-ESM-ER) and a suite of CMIP6 models. The analysis highlights that over this 35-year period, spatial trend patterns are dominated by internal variability, leading to large and spatially incoherent differences between uninitialized coupled models and observations.
Key Findings
- Regional trend mismatches are large and vary substantially between models, confirming that 35-year circulation trends are heavily influenced by internal climate variability (e.g., ENSO, NAO phases) rather than just external forcing.
- Among the individual models, ICON-ESM-ER shows the best agreement with observations globally, achieving a trend RMSE of 22.6 Pa/decade, which is comparable to the noise-reduced CMIP6 Multi-Model Mean (21.6 Pa/decade) and lower than IFS-NEMO-ER (23.6) and IFS-FESOM2-SR (28.7).
- Specific models exhibit extreme regional trend biases; for example, MRI-ESM2-0 shows a massive positive trend bias in the North Atlantic, while ACCESS-ESM1-5 shows strong zonal dipoles in the Southern Ocean, likely representing different realizations of decadal variability modes.
Spatial Patterns
ERA5 (top-left) shows distinct positive MSLP trends over the North Pacific and subtropical South Atlantic. The model bias maps (Model trend - Obs trend) do not show a systematic global error structure common to all models, but rather randomized regional errors. IFS-FESOM2-SR and IFS-NEMO-ER show negative biases (blue) over parts of the Southern Ocean and North Pacific, indicating a stronger deepening or weaker pressure increase than observed. MRI-ESM2-0 is a notable outlier with a strong localized positive bias in the North Atlantic.
Model Agreement
Inter-model agreement is low regarding the spatial distribution of trends, which is expected for uninitialized simulations. The CMIP6 Multi-Model Mean (MMM) has the lowest RMSE, likely because averaging suppresses the uncorrelated internal variability of individual ensemble members, leaving the forced signal which better matches the long-term observational component. The high-resolution EERIE models perform within the range of the CMIP6 ensemble, with ICON-ESM-ER performing particularly well.
Physical Interpretation
The large discrepancies in MSLP trends are primarily driven by the stochastic nature of internal atmospheric variability (e.g., the specific phasing of the Pacific Decadal Oscillation or Southern Annular Mode) over the 35-year analysis window. Since these are free-running coupled simulations, they are not expected to reproduce the specific historical chronology of internal variability seen in ERA5. Biases thus reflect 'bad luck' in variability phasing as much as, or more than, systematic model deficiencies.
Caveats
- The 1980–2014 period is too short to robustly separate forced circulation trends from internal decadal variability.
- Comparisons of trends in uninitialized models against observations should be interpreted with caution; a high RMSE does not necessarily imply poor model physics, but may simply indicate a different realization of chaotic internal dynamics.
Mean Sea Level Pressure DJF Linear Trend
| Variables | psl |
|---|---|
| Models | IFS-FESOM2-SR, IFS-NEMO-ER, ICON-ESM-ER, CMIP6 MMM, MPI-ESM1-2-LR/r1i1p1f1, GISS-E2-1-G/r1i1p1f2, IPSL-CM6A-LR/r1i1p1f1, ACCESS-ESM1-5/r1i1p1f1, EC-Earth3/r1i1p1f1, CNRM-CM6-1/r1i1p1f2, AWI-CM-1-1-MR/r1i1p1f1, CNRM-ESM2-1/r1i1p1f2, FGOALS-g3/r1i1p1f1, INM-CM5-0/r1i1p1f1, MRI-ESM2-0/r1i1p1f1 |
| Reference Dataset | ERA5 |
| Units | Pa/decade |
| Period | 1980–2014 |
| CMIP6 MMM | Global Mean Trend Diff: -6.70 · Trend Rmse: None |
| MPI-ESM1-2-LR/r1i1p1f1 | Global Mean Trend Diff: -6.53 · Trend Rmse: None |
| GISS-E2-1-G/r1i1p1f2 | Global Mean Trend Diff: -7.08 · Trend Rmse: None |
| IPSL-CM6A-LR/r1i1p1f1 | Global Mean Trend Diff: -8.14 · Trend Rmse: None |
| ACCESS-ESM1-5/r1i1p1f1 | Global Mean Trend Diff: -5.41 · Trend Rmse: None |
| EC-Earth3/r1i1p1f1 | Global Mean Trend Diff: -4.19 · Trend Rmse: None |
| CNRM-CM6-1/r1i1p1f2 | Global Mean Trend Diff: -5.74 · Trend Rmse: None |
| AWI-CM-1-1-MR/r1i1p1f1 | Global Mean Trend Diff: -7.93 · Trend Rmse: None |
| CNRM-ESM2-1/r1i1p1f2 | Global Mean Trend Diff: -4.57 · Trend Rmse: None |
| FGOALS-g3/r1i1p1f1 | Global Mean Trend Diff: -7.68 · Trend Rmse: None |
| INM-CM5-0/r1i1p1f1 | Global Mean Trend Diff: -8.41 · Trend Rmse: None |
| MRI-ESM2-0/r1i1p1f1 | Global Mean Trend Diff: -7.76 · Trend Rmse: None |
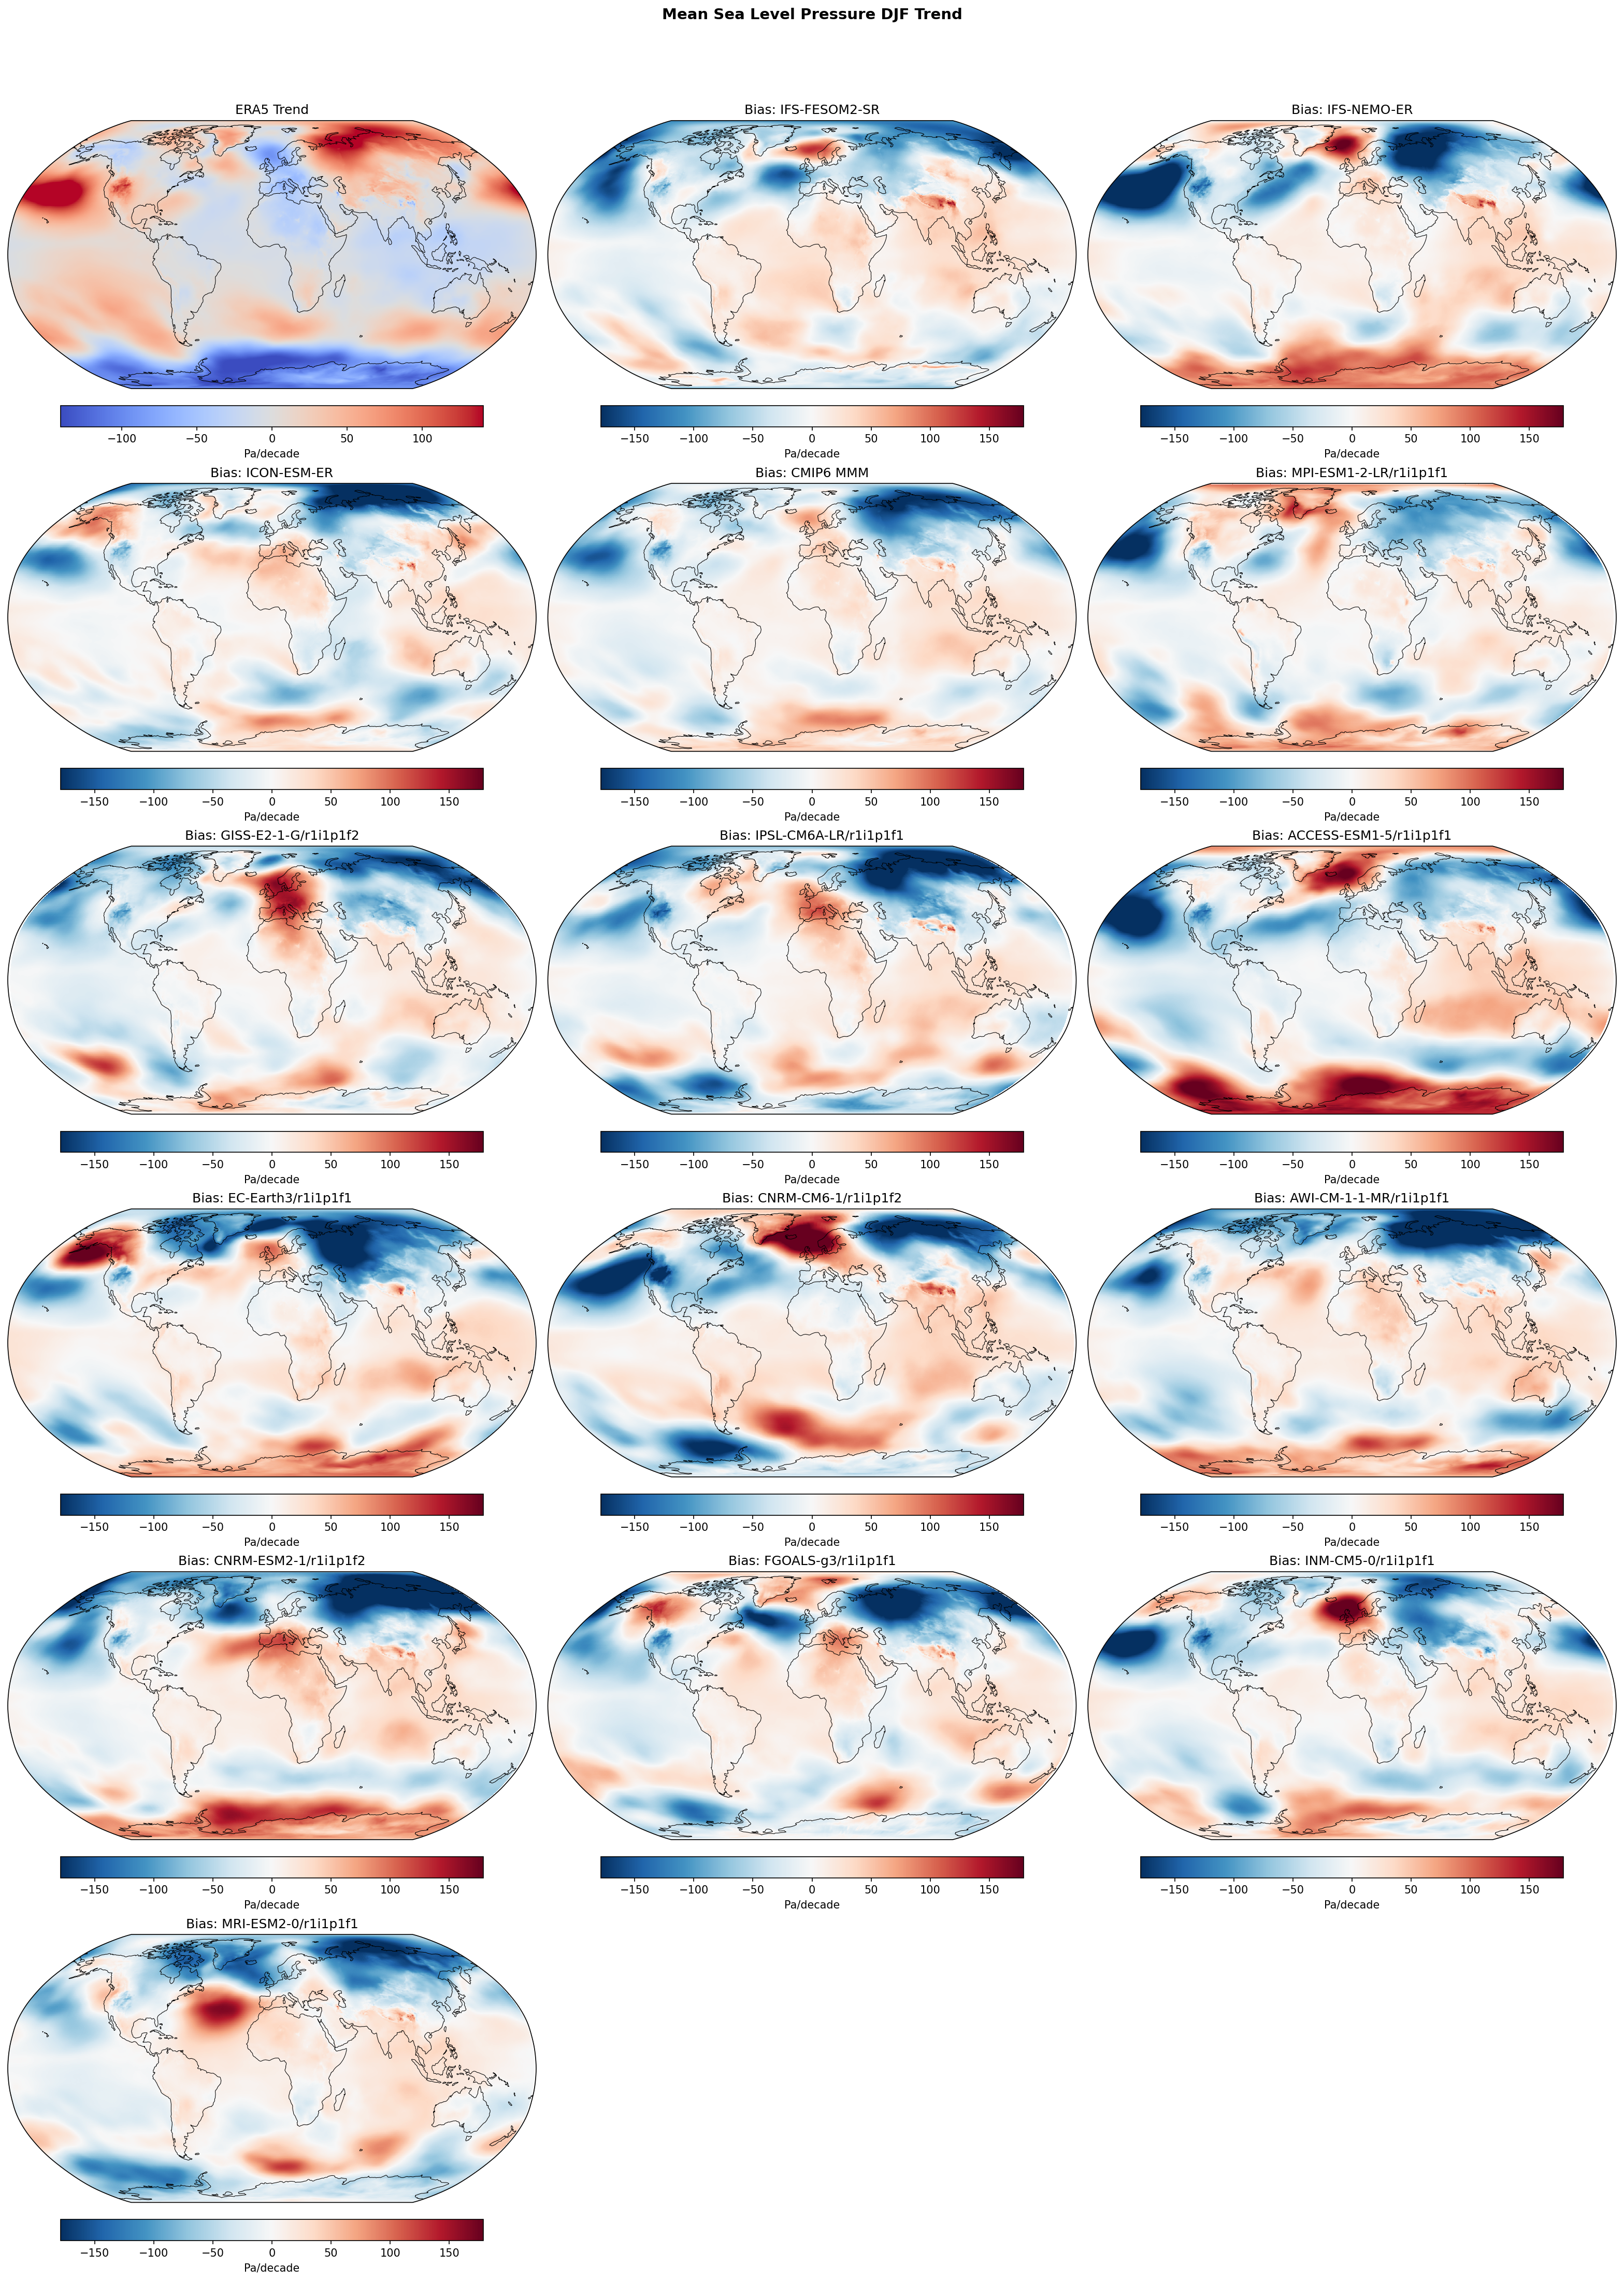
Summary high
This figure evaluates linear trends in DJF Mean Sea Level Pressure (1980–2014), revealing that both high-resolution EERIE models and standard CMIP6 models largely fail to capture the observed regional circulation changes, particularly in the North Pacific.
Key Findings
- Prominent North Pacific mismatch: ERA5 shows a strong positive pressure trend (weakening Aleutian Low), while models consistently exhibit a strong negative bias, indicating they simulate a deepening or neutral trend instead.
- Underestimated SAM trend: In the Southern Hemisphere, ERA5 displays a positive Southern Annular Mode (SAM) trend (pressure drop over Antarctica). Many models, including IFS-FESOM2-SR and IFS-NEMO-ER, show positive biases over the pole, indicating they underestimate the strength of this deepening.
- North Atlantic discrepancy: Models generally show negative biases over the North Atlantic and Southern Europe, failing to reproduce the magnitude of the observed positive pressure trends associated with the NAO phase during this period.
- The CMIP6 Multi-Model Mean (MMM) bias pattern closely resembles the individual high-resolution simulations, suggesting these biases are systematic across model generations and resolutions.
Spatial Patterns
ERA5 shows a positive SAM trend in the SH and strong positive trends in the North Pacific and North Atlantic. The model bias maps are dominated by large-scale zonal asymmetries: specifically, a profound negative bias (blue) centered on the North Pacific and often the North Atlantic, and positive biases (red) frequently appearing over Antarctica.
Model Agreement
There is high inter-model agreement regarding the sign of the error in the North Pacific; almost every model, including the high-resolution IFS and ICON variants, shares the negative trend bias seen in the CMIP6 MMM. Biases in the Southern Hemisphere are more variable, though the EERIE models cluster with similar underestimations of the polar pressure drop.
Physical Interpretation
The pervasive mismatch in the North Pacific likely results from the difference between the single observed realization of internal decadal variability (e.g., specific IPO/PDO phases) and the unsynchronized variability in free-running coupled models. The systematic nature of the bias in the MMM, however, points to the 'signal-to-noise paradox,' where models may respond too weakly to external forcing (like ozone depletion or GHGs) or fail to capture the multidecadal atmospheric circulation response observed in reality.
Caveats
- The analysis period (1980–2014) is relatively short (35 years), meaning trends are heavily influenced by internal multidecadal variability which free-running models are not expected to phase-match with observations.
- Units are Pa/decade; a bias of 150 Pa/decade corresponds to 1.5 hPa/decade, which is significant for regional circulation patterns.
Mean Sea Level Pressure JJA Linear Trend
| Variables | psl |
|---|---|
| Models | IFS-FESOM2-SR, IFS-NEMO-ER, ICON-ESM-ER, CMIP6 MMM, MPI-ESM1-2-LR/r1i1p1f1, GISS-E2-1-G/r1i1p1f2, IPSL-CM6A-LR/r1i1p1f1, ACCESS-ESM1-5/r1i1p1f1, EC-Earth3/r1i1p1f1, CNRM-CM6-1/r1i1p1f2, AWI-CM-1-1-MR/r1i1p1f1, CNRM-ESM2-1/r1i1p1f2, FGOALS-g3/r1i1p1f1, INM-CM5-0/r1i1p1f1, MRI-ESM2-0/r1i1p1f1 |
| Reference Dataset | ERA5 |
| Units | Pa/decade |
| Period | 1980–2014 |
| CMIP6 MMM | Global Mean Trend Diff: -5.36 · Trend Rmse: None |
| MPI-ESM1-2-LR/r1i1p1f1 | Global Mean Trend Diff: -6.36 · Trend Rmse: None |
| GISS-E2-1-G/r1i1p1f2 | Global Mean Trend Diff: -7.51 · Trend Rmse: None |
| IPSL-CM6A-LR/r1i1p1f1 | Global Mean Trend Diff: -7.25 · Trend Rmse: None |
| ACCESS-ESM1-5/r1i1p1f1 | Global Mean Trend Diff: -3.22 · Trend Rmse: None |
| EC-Earth3/r1i1p1f1 | Global Mean Trend Diff: -0.57 · Trend Rmse: None |
| CNRM-CM6-1/r1i1p1f2 | Global Mean Trend Diff: -3.10 · Trend Rmse: None |
| AWI-CM-1-1-MR/r1i1p1f1 | Global Mean Trend Diff: -6.84 · Trend Rmse: None |
| CNRM-ESM2-1/r1i1p1f2 | Global Mean Trend Diff: -2.37 · Trend Rmse: None |
| FGOALS-g3/r1i1p1f1 | Global Mean Trend Diff: -7.01 · Trend Rmse: None |
| INM-CM5-0/r1i1p1f1 | Global Mean Trend Diff: -7.35 · Trend Rmse: None |
| MRI-ESM2-0/r1i1p1f1 | Global Mean Trend Diff: -7.21 · Trend Rmse: None |
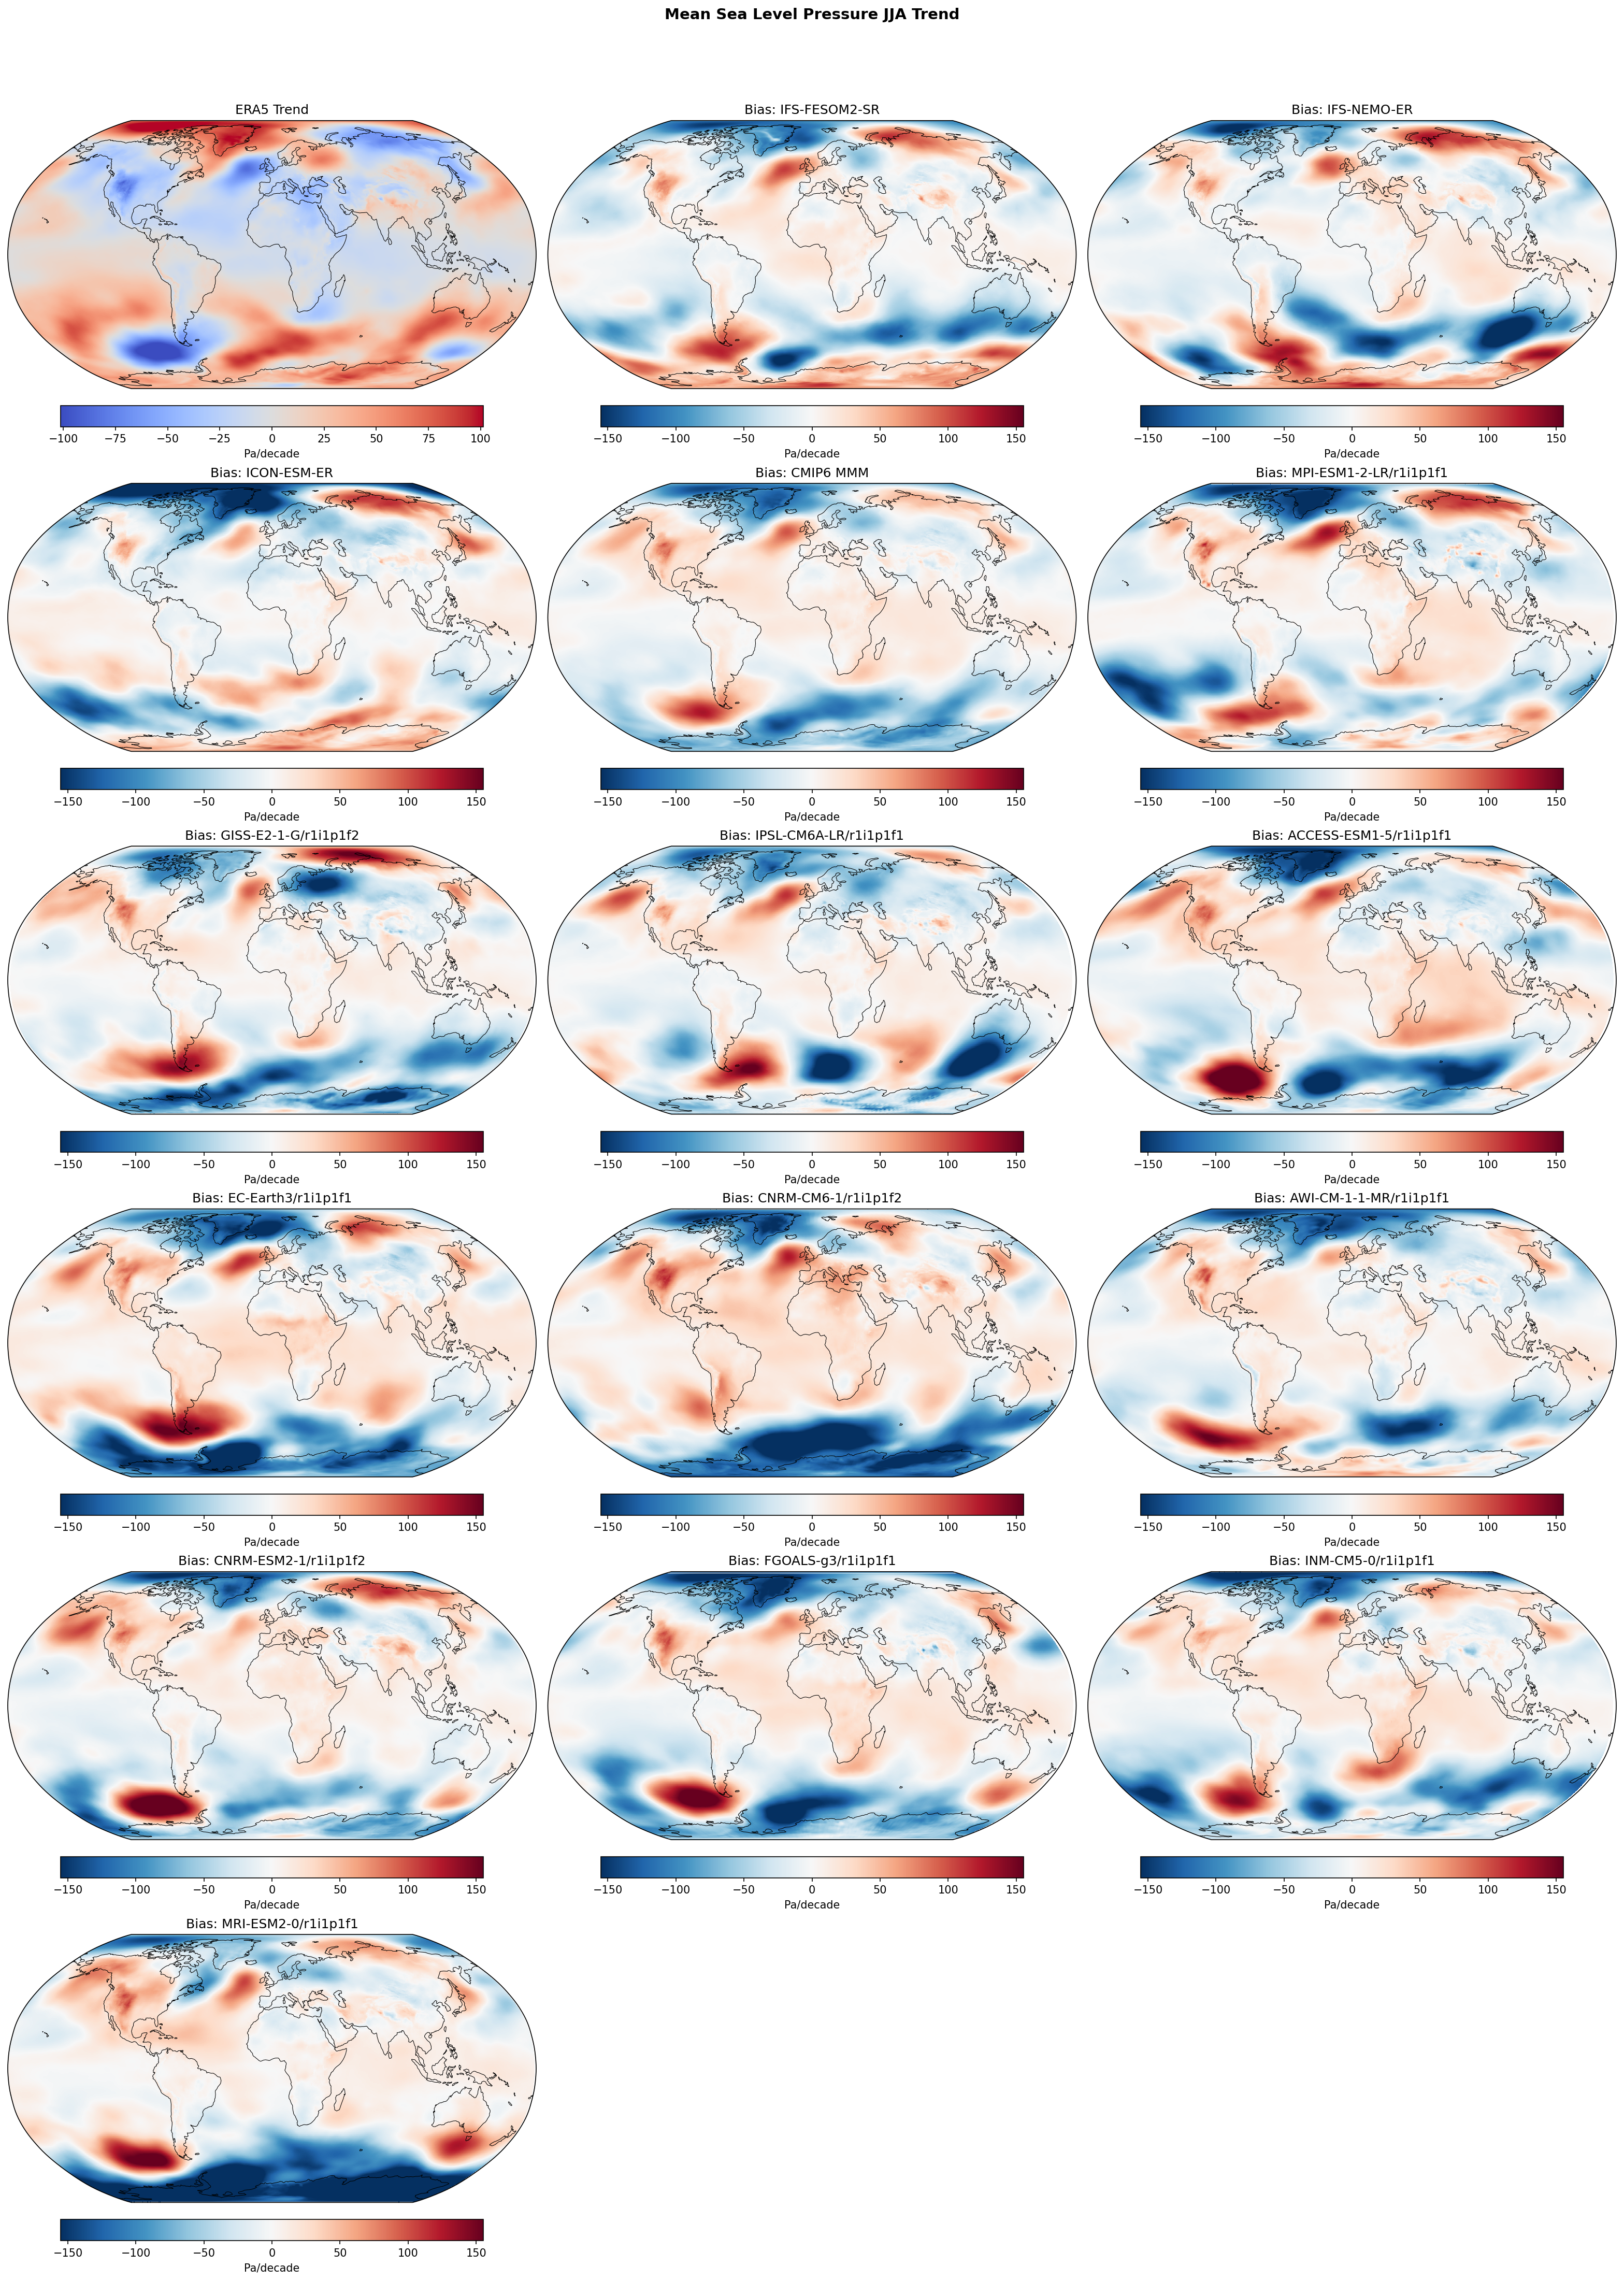
Summary high
This figure evaluates linear trends in JJA Mean Sea Level Pressure (MSLP) from 1980–2014, comparing ERA5 observations against EERIE high-resolution simulations and the CMIP6 ensemble. The dominant feature is a systematic failure of models to replicate the strong pressure decrease observed over Antarctica, resulting in widespread positive trend biases in high southern latitudes.
Key Findings
- ERA5 displays a robust strengthening of the Southern Annular Mode (SAM) in austral winter (JJA), characterized by significant pressure decreases over the Antarctic continent and Amundsen Sea (-75 to -100 Pa/decade).
- Both EERIE models (IFS-FESOM2-SR, IFS-NEMO-ER, ICON-ESM-ER) and the CMIP6 ensemble exhibit a strong positive bias (red) over Antarctica, indicating they underestimate the observed polar deepening.
- The spatial structure of biases is remarkably consistent across resolutions and model families, typically showing positive biases over the pole and negative biases in the southern mid-latitudes, suggesting a weaker meridional gradient trend in models than in observations.
Spatial Patterns
The observation panel shows a classic positive SAM trend pattern in the Southern Hemisphere: pressure rises in the mid-latitudes (40°S–50°S) and falls over the polar cap. The model bias panels consistently invert this gradient relative to observations (red pole, blue mid-latitudes), effectively flattening the trend. In the Northern Hemisphere, biases are more heterogeneous, though several models (e.g., IFS variants, MPI-ESM) show positive trend biases over the North Atlantic.
Model Agreement
There is high inter-model agreement regarding the sign of the error in the Southern Hemisphere. The high-resolution EERIE models do not distinctively diverge from the CMIP6 Multi-Model Mean in this metric; IFS-FESOM2-SR and IFS-NEMO-ER show very similar bias patterns, implying the atmospheric component (IFS) or external forcing dominates over ocean grid differences.
Physical Interpretation
The observed trend is likely driven by stratospheric ozone depletion and increasing greenhouse gases, which favour a positive SAM phase. The consistent model underestimation of this trend suggests either a weaker sensitivity to these forcings in the models or that the observed trend contains a substantial contribution from internal variability (e.g., decadal variability of the Amundsen Sea Low) that the forced model runs are not expected to phase-match.
Caveats
- Trends calculated over a 35-year period (1980–2014) are heavily influenced by internal climate variability; disagreement between free-running coupled models and observations is expected to some degree.
- The analysis does not separate forced response from internal variability, making it difficult to attribute the bias strictly to model error versus stochastic noise.
Surface Downwelling Longwave Annual Linear Trend
| Variables | rlds |
|---|---|
| Models | IFS-FESOM2-SR, IFS-NEMO-ER, ICON-ESM-ER, CMIP6 MMM, MPI-ESM1-2-LR/r1i1p1f1, GISS-E2-1-G/r1i1p1f2, IPSL-CM6A-LR/r1i1p1f1, ACCESS-ESM1-5/r1i1p1f1, EC-Earth3/r1i1p1f1, CNRM-CM6-1/r1i1p1f2, AWI-CM-1-1-MR/r1i1p1f1, CNRM-ESM2-1/r1i1p1f2, FGOALS-g3/r1i1p1f1, INM-CM5-0/r1i1p1f1, MRI-ESM2-0/r1i1p1f1 |
| Reference Dataset | ERA5 |
| Units | W/m2/decade |
| Period | 1980–2014 |
| IFS-FESOM2-SR | Global Mean Trend: 1.84 · Global Mean Trend Diff: 1.06 · Trend Rmse: 1.56 |
| IFS-NEMO-ER | Global Mean Trend: 1.24 · Global Mean Trend Diff: 0.45 · Trend Rmse: 1.23 |
| ICON-ESM-ER | Global Mean Trend: 1.18 · Global Mean Trend Diff: 0.39 · Trend Rmse: 1.04 |
| CMIP6 MMM | Global Mean Trend Diff: 0.87 · Trend Rmse: 1.24 |
| MPI-ESM1-2-LR/r1i1p1f1 | Global Mean Trend Diff: 0.40 · Trend Rmse: 1.02 |
| GISS-E2-1-G/r1i1p1f2 | Global Mean Trend Diff: 0.51 · Trend Rmse: 1.21 |
| IPSL-CM6A-LR/r1i1p1f1 | Global Mean Trend Diff: 0.97 · Trend Rmse: 1.49 |
| ACCESS-ESM1-5/r1i1p1f1 | Global Mean Trend Diff: 1.32 · Trend Rmse: 1.87 |
| EC-Earth3/r1i1p1f1 | Global Mean Trend Diff: 1.86 · Trend Rmse: 2.37 |
| CNRM-CM6-1/r1i1p1f2 | Global Mean Trend Diff: 0.46 · Trend Rmse: 1.34 |
| AWI-CM-1-1-MR/r1i1p1f1 | Global Mean Trend Diff: 1.03 · Trend Rmse: 1.46 |
| CNRM-ESM2-1/r1i1p1f2 | Global Mean Trend Diff: 0.78 · Trend Rmse: 1.28 |
| FGOALS-g3/r1i1p1f1 | Global Mean Trend Diff: 0.96 · Trend Rmse: 1.60 |
| INM-CM5-0/r1i1p1f1 | Global Mean Trend Diff: 0.68 · Trend Rmse: 1.26 |
| MRI-ESM2-0/r1i1p1f1 | Global Mean Trend Diff: 0.61 · Trend Rmse: 1.21 |
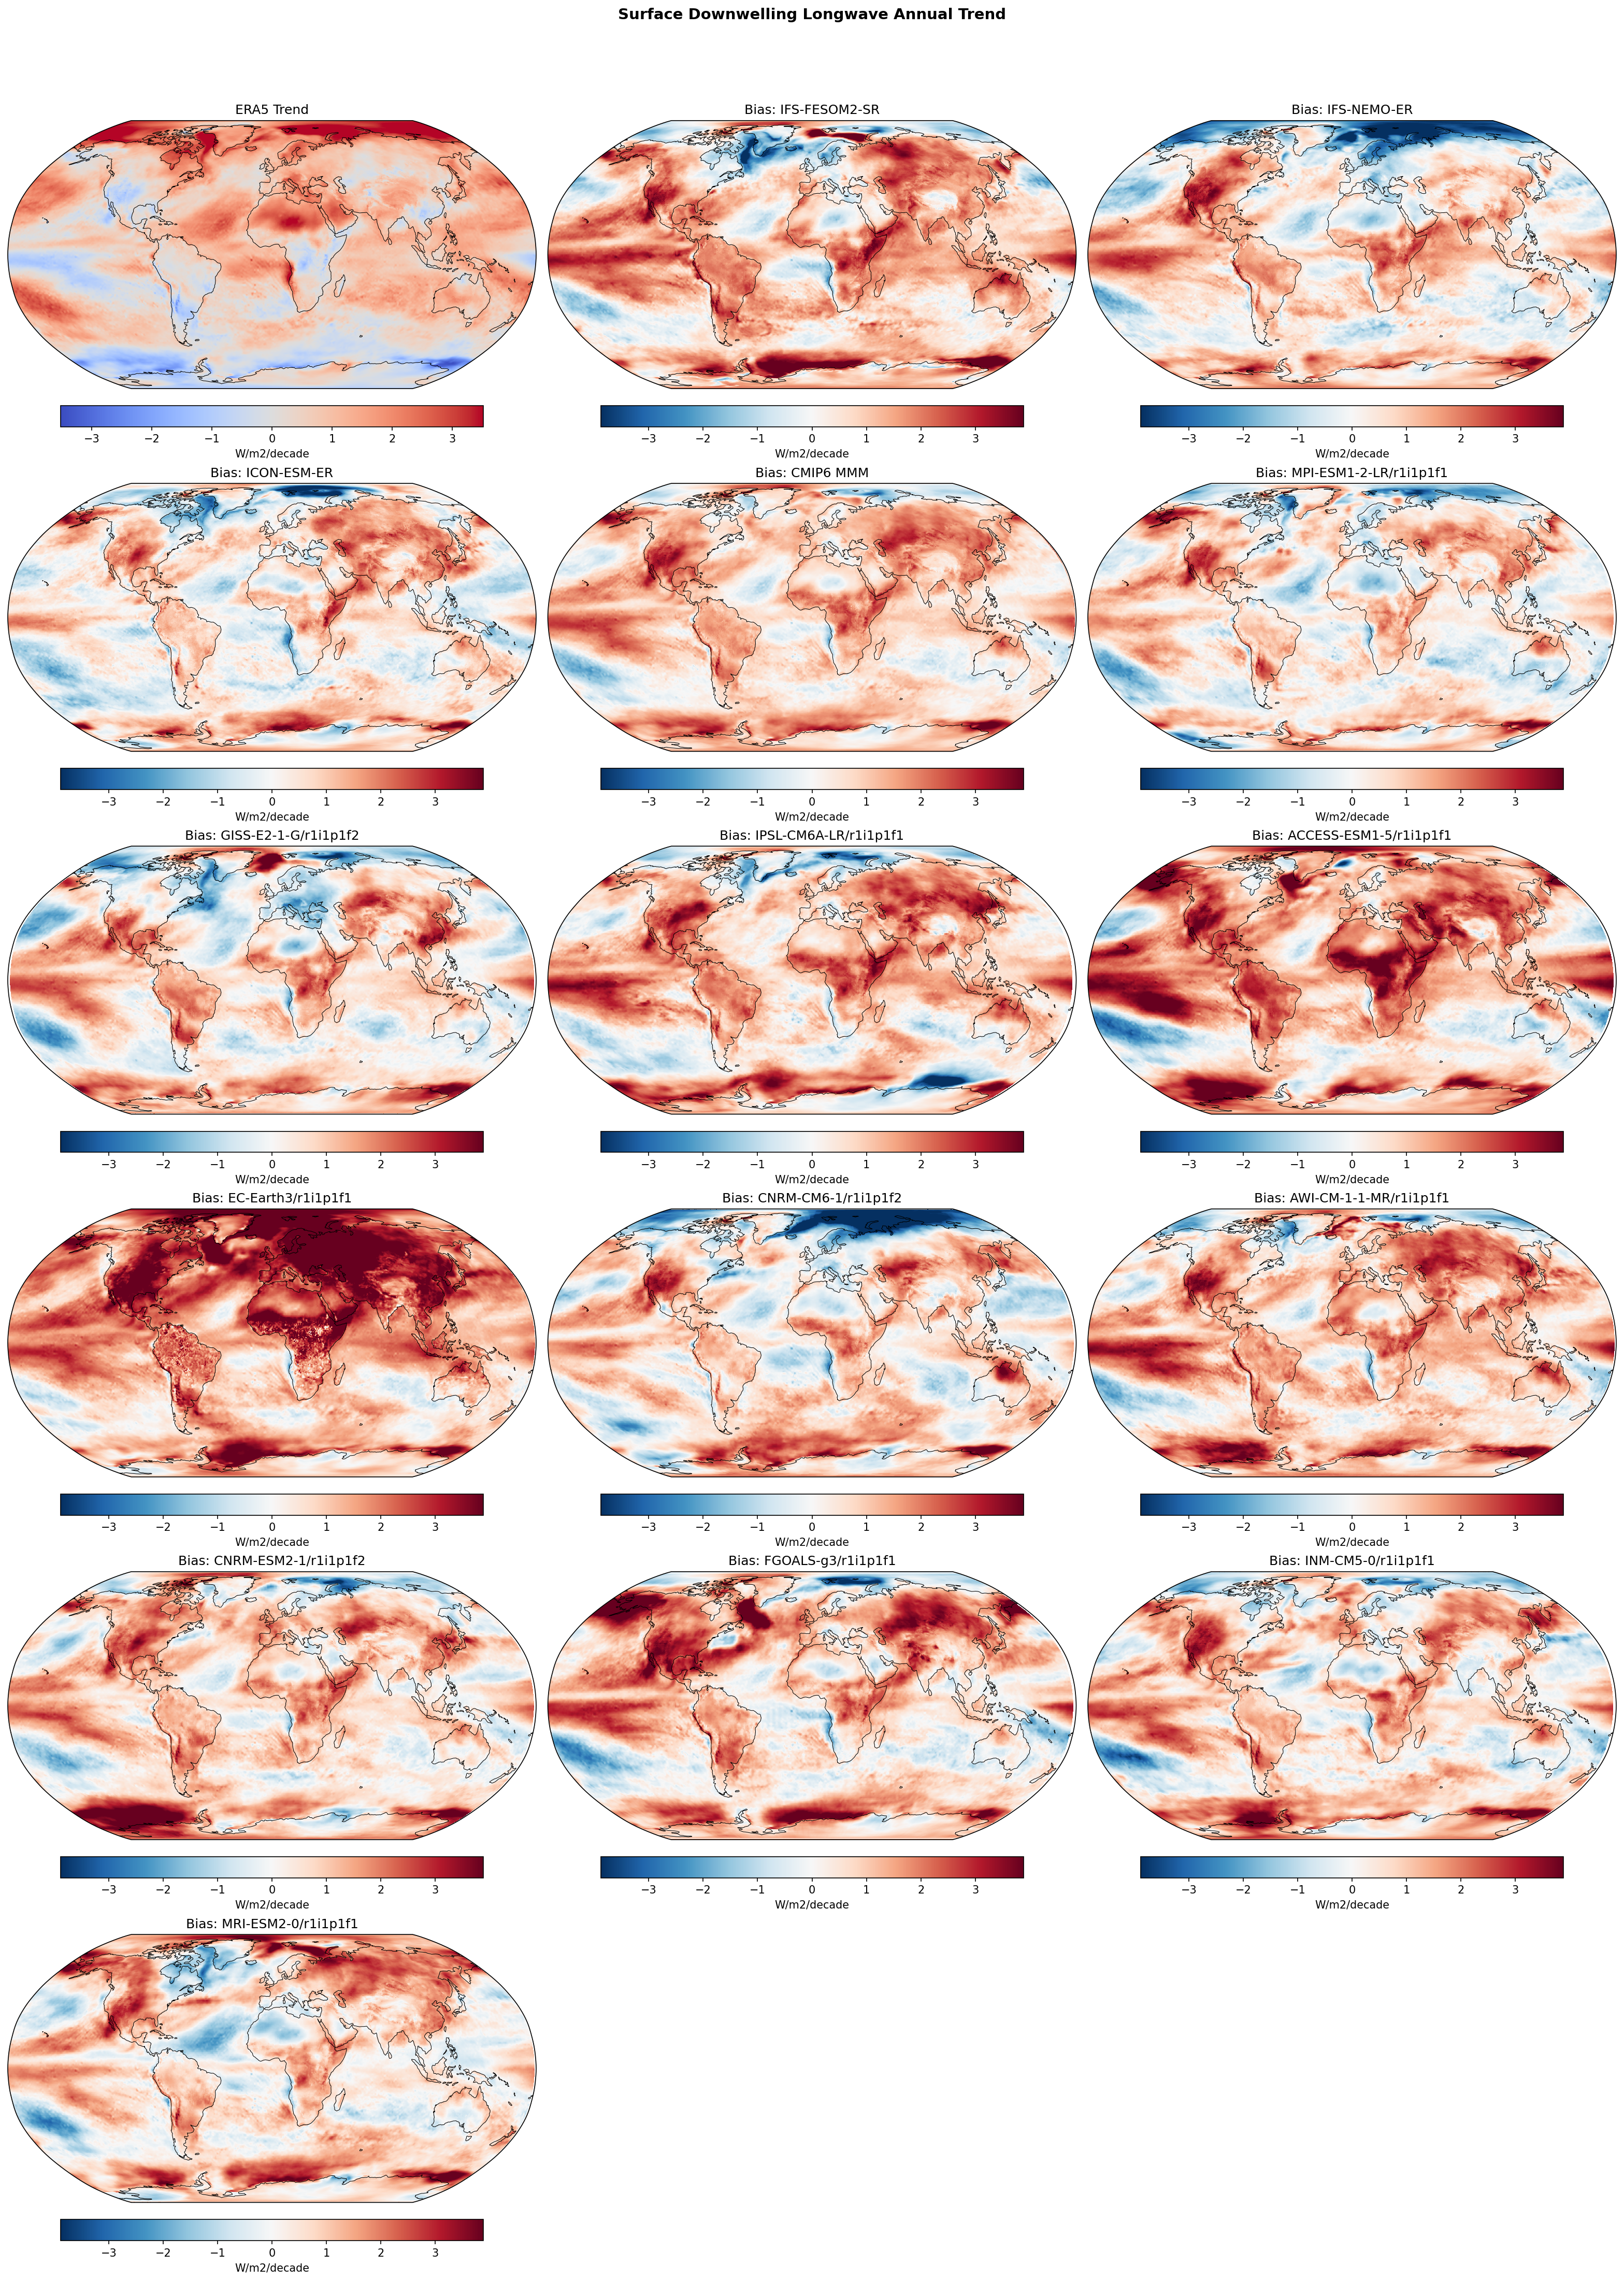
Summary high
Models systematically overestimate the increasing trend in surface downwelling longwave radiation (1980–2014) compared to ERA5, though the high-resolution ICON-ESM-ER and IFS-NEMO-ER simulations show better agreement than many standard CMIP6 models.
Key Findings
- Most models exhibit a widespread positive bias in trend magnitude (global mean differences +0.4 to +1.9 W/m²/decade), indicating they simulate a faster increase in downwelling longwave radiation than the reanalysis.
- ICON-ESM-ER performs best among the high-resolution EERIE models, with the lowest global mean trend difference (+0.39 W/m²/decade) and lowest RMSE (~1.04), outperforming the CMIP6 Multi-Model Mean.
- EC-Earth3 and ACCESS-ESM1-5 show the strongest positive trend biases (up to +1.86 W/m²/decade global excess), particularly amplifying trends in the Arctic and over land masses.
Spatial Patterns
ERA5 (top-left) shows positive trends globally, peaking in the Arctic and over Northern Hemisphere land. The model bias panels are predominantly red, indicating that models simulate even stronger positive trends almost everywhere. The strongest discrepancies (dark red) are often found in the Arctic (indicating excessive polar amplification of the radiative feedback) and over tropical oceans.
Model Agreement
Models universally agree on the sign of the trend (positive) but diverge on magnitude. The high-resolution IFS-NEMO-ER and ICON-ESM-ER align much closer to ERA5 than IFS-FESOM2-SR, which shows a strong positive bias (+1.06 W/m²/decade) similar to the poorer-performing CMIP6 members.
Physical Interpretation
The pervasive positive bias suggests that free-running coupled models simulate a stronger surface warming rate and/or stronger water vapor feedback loop over the 1980–2014 period than observed in ERA5. This may be partly due to models not capturing the early-2000s 'warming hiatus' effectively, leading to steeper linear trends, or differences in cloud cover evolution. The excessive Arctic trend in models like EC-Earth3 points to strong sea-ice/temperature feedbacks driving increased atmospheric emissivity.
Caveats
- ERA5 trends are sensitive to changes in the observing system (e.g., satellite ingest) and may contain spurious artifacts.
- The 35-year period (1980-2014) is short enough that internal variability (e.g., ENSO, IPO phases) can create mismatches between free-running models and historical reanalysis.
Surface Downwelling Longwave DJF Linear Trend
| Variables | rlds |
|---|---|
| Models | IFS-FESOM2-SR, IFS-NEMO-ER, ICON-ESM-ER, CMIP6 MMM, MPI-ESM1-2-LR/r1i1p1f1, GISS-E2-1-G/r1i1p1f2, IPSL-CM6A-LR/r1i1p1f1, ACCESS-ESM1-5/r1i1p1f1, EC-Earth3/r1i1p1f1, CNRM-CM6-1/r1i1p1f2, AWI-CM-1-1-MR/r1i1p1f1, CNRM-ESM2-1/r1i1p1f2, FGOALS-g3/r1i1p1f1, INM-CM5-0/r1i1p1f1, MRI-ESM2-0/r1i1p1f1 |
| Reference Dataset | ERA5 |
| Units | W/m2/decade |
| Period | 1980–2014 |
| CMIP6 MMM | Global Mean Trend Diff: 0.83 · Trend Rmse: None |
| MPI-ESM1-2-LR/r1i1p1f1 | Global Mean Trend Diff: 0.35 · Trend Rmse: None |
| GISS-E2-1-G/r1i1p1f2 | Global Mean Trend Diff: 0.51 · Trend Rmse: None |
| IPSL-CM6A-LR/r1i1p1f1 | Global Mean Trend Diff: 0.84 · Trend Rmse: None |
| ACCESS-ESM1-5/r1i1p1f1 | Global Mean Trend Diff: 1.35 · Trend Rmse: None |
| EC-Earth3/r1i1p1f1 | Global Mean Trend Diff: 1.76 · Trend Rmse: None |
| CNRM-CM6-1/r1i1p1f2 | Global Mean Trend Diff: 0.44 · Trend Rmse: None |
| AWI-CM-1-1-MR/r1i1p1f1 | Global Mean Trend Diff: 0.97 · Trend Rmse: None |
| CNRM-ESM2-1/r1i1p1f2 | Global Mean Trend Diff: 0.76 · Trend Rmse: None |
| FGOALS-g3/r1i1p1f1 | Global Mean Trend Diff: 0.91 · Trend Rmse: None |
| INM-CM5-0/r1i1p1f1 | Global Mean Trend Diff: 0.61 · Trend Rmse: None |
| MRI-ESM2-0/r1i1p1f1 | Global Mean Trend Diff: 0.66 · Trend Rmse: None |
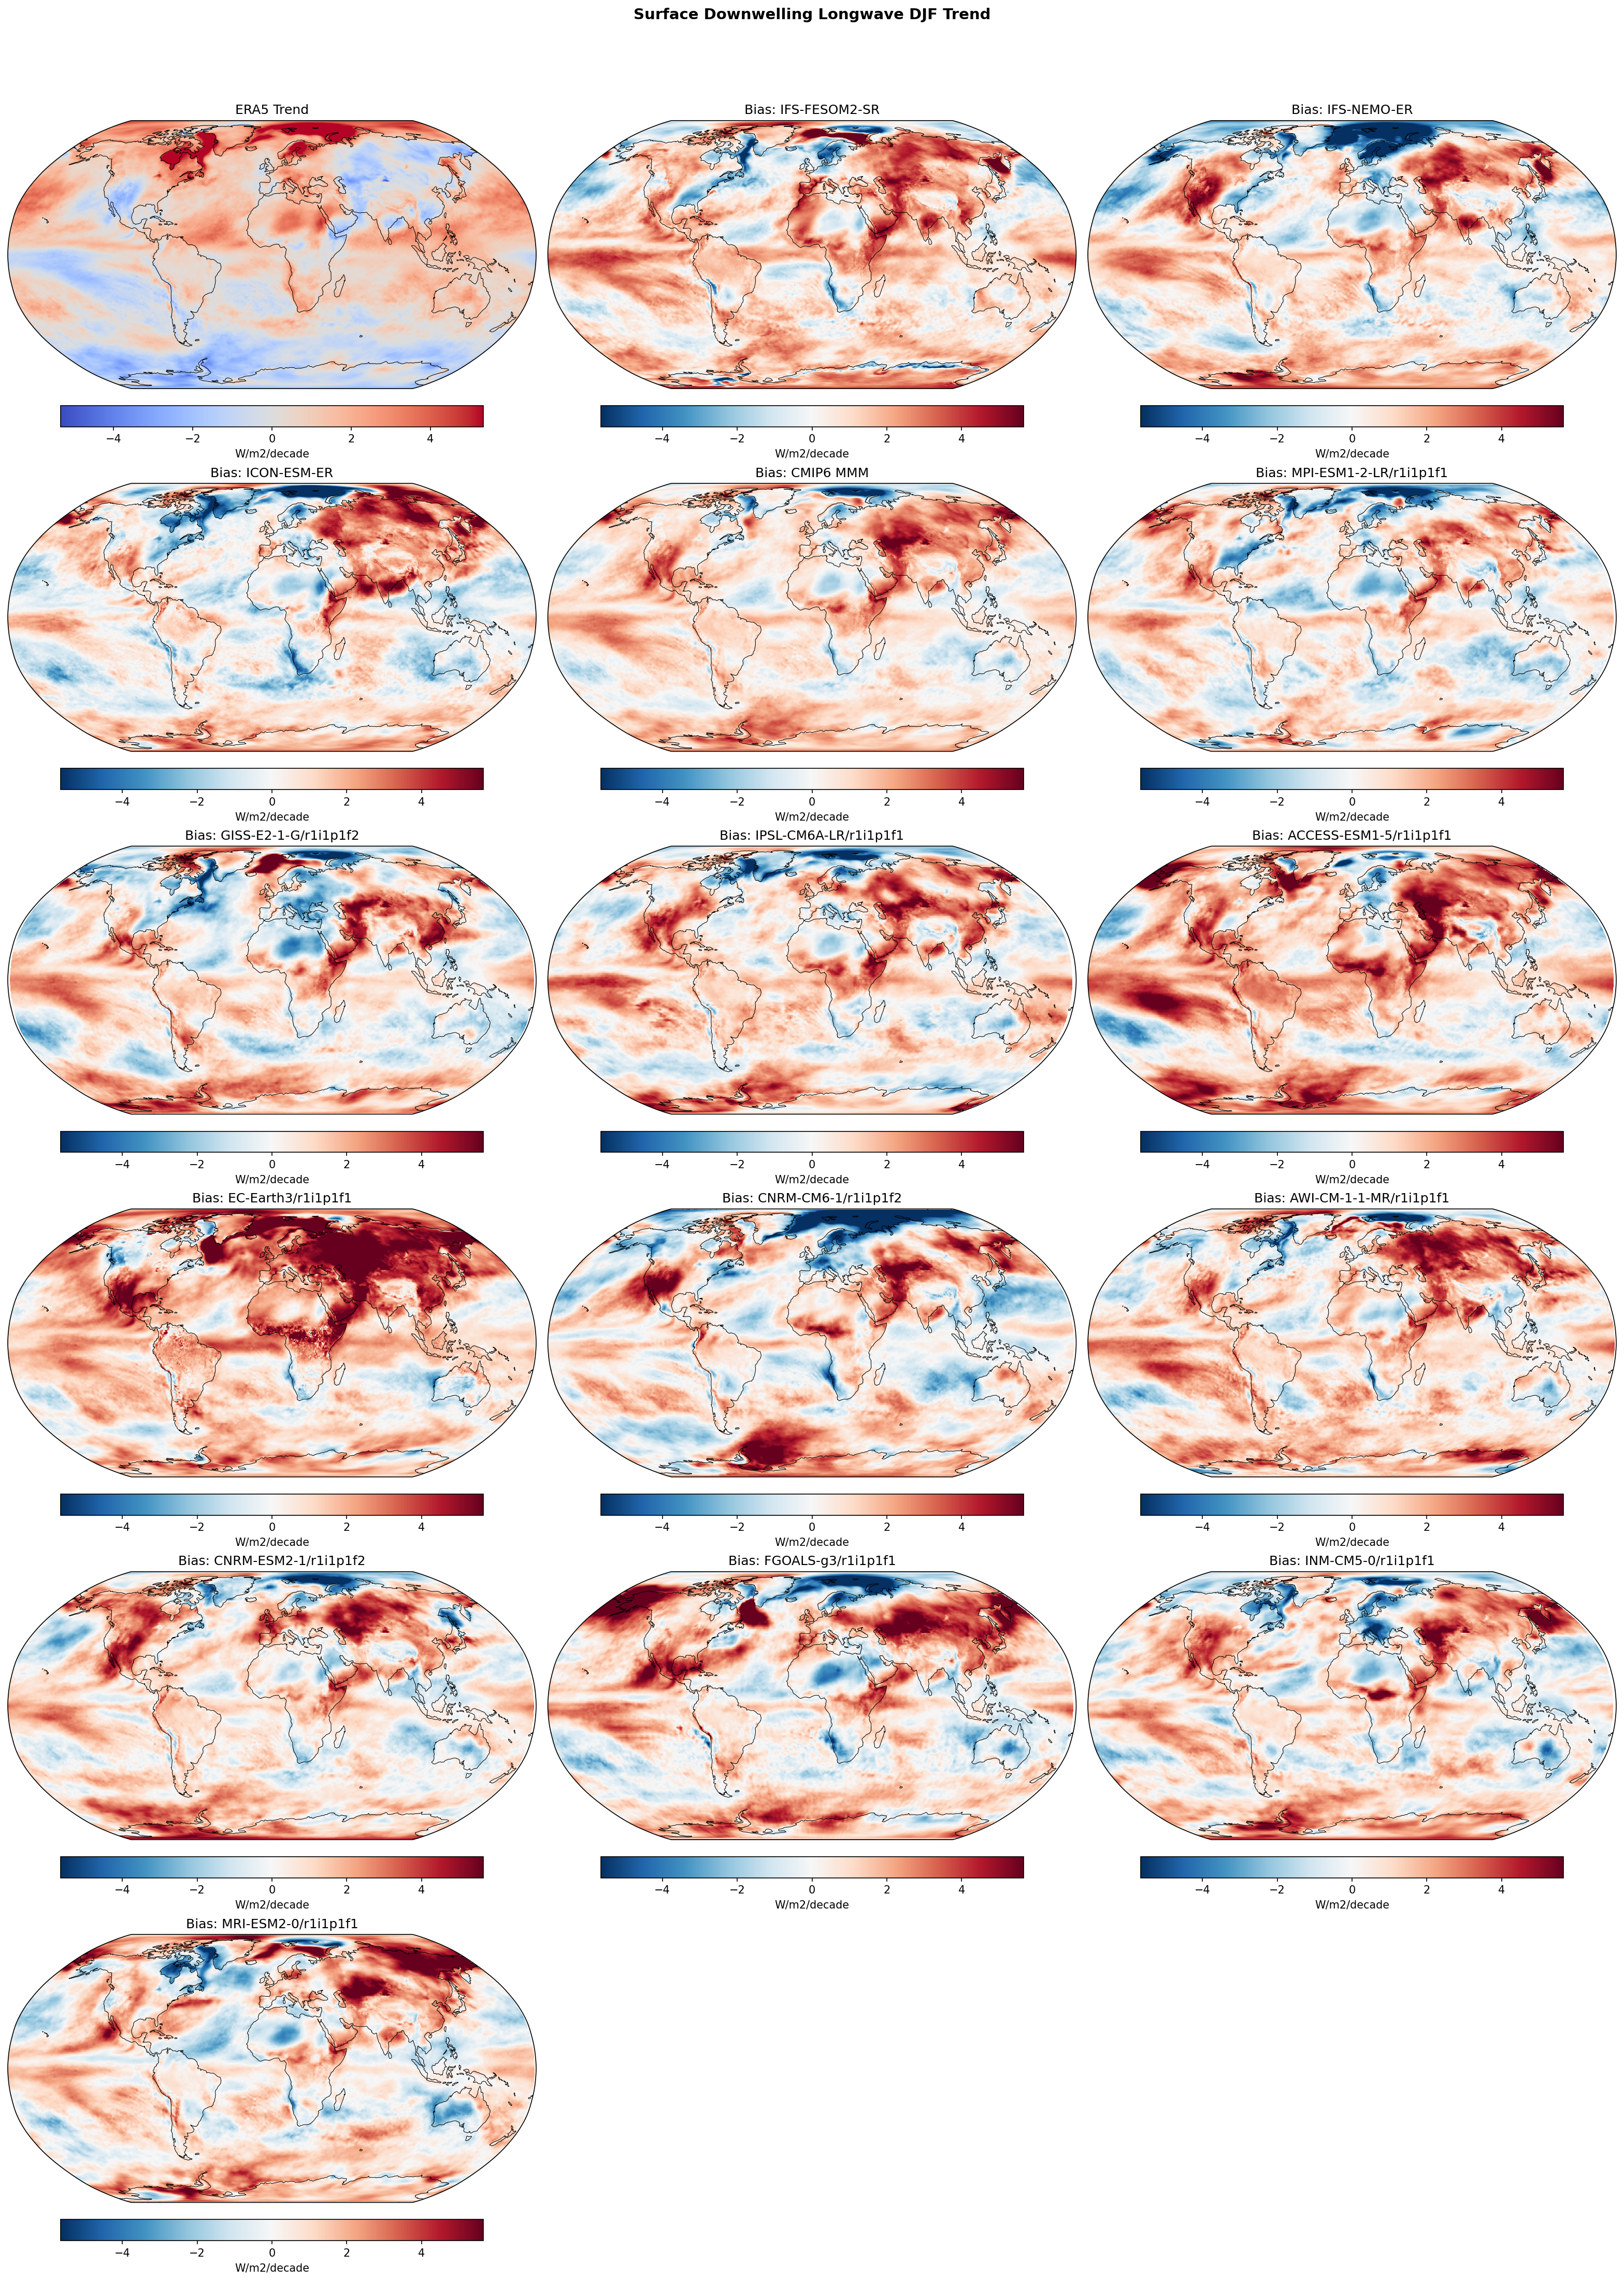
Summary high
This diagnostic evaluates linear trends (1980–2014) in winter (DJF) surface downwelling longwave radiation (RLDS), comparing high-resolution EERIE models and CMIP6 models against ERA5 reanalysis. The analysis reveals a systematic tendency for models to overestimate the positive RLDS trend over Northern Hemisphere land masses and the Arctic.
Key Findings
- Most models, including the high-resolution IFS-FESOM2-SR and IFS-NEMO-ER, exhibit a strong positive trend bias (red) over the Arctic and Northern Eurasia, implying they simulate a more rapid increase in downwelling radiation than ERA5.
- ICON-ESM-ER diverges from the IFS models in the Barents-Kara Sea region, showing a negative trend bias (blue) where IFS models show a strong positive bias, suggesting different sea-ice or cloud feedback responses in this sector.
- EC-Earth3 and ACCESS-ESM1-5 display the most severe widespread positive trend biases globally, whereas MPI-ESM1-2-LR shows the closest agreement with ERA5 trends (weakest biases).
- Southern Ocean biases are generally weak or negative across most models, contrasting with the strong positive biases in the Northern Hemisphere.
Spatial Patterns
ERA5 shows a positive RLDS trend (warming signal) over the Arctic and Northern Eurasia. The model bias maps are dominated by positive values (red) in these same regions, indicating an amplification of this trend in the simulations. Tropical biases are mixed, often showing zonal structures likely related to differences in ENSO evolution or ITCZ positioning over the trend period. The IFS models show particularly strong positive biases over North America and Siberia.
Model Agreement
There is broad inter-model agreement on the sign of the bias (positive) in the Northern Hemisphere high latitudes, with the CMIP6 Multi-Model Mean (MMM) summarizing this feature. However, the magnitude varies significantly, with EC-Earth3 being an outlier on the high side and MPI-ESM1-2-LR on the low side. The high-resolution IFS models align more closely with the 'high bias' group (like CMIP6 MMM) in the Arctic than with the 'low bias' group.
Physical Interpretation
In winter (DJF), RLDS is primarily determined by atmospheric temperature, water vapor, and cloud cover. The strong positive trend bias in the Arctic and NH continents suggests that models are warming the lower atmosphere faster than ERA5 (exaggerated Arctic Amplification) or are producing increasingly optically thick clouds/moisture trends. The contrast between IFS (positive bias) and ICON (negative regional bias in Barents-Kara) likely points to differences in sea ice retreat rates or cloud phase parameterizations in the marginal ice zone.
Caveats
- ERA5 is a reanalysis product; its trends in radiative fluxes, especially in polar regions, are model-derived and subject to uncertainties in the underlying assimilation system.
- The analysis period (1980-2014) captures a specific phase of internal variability (e.g., IPO, AMO) which models are not expected to reproduce in phase unless initialised, influencing regional trend comparisons.
Surface Downwelling Longwave JJA Linear Trend
| Variables | rlds |
|---|---|
| Models | IFS-FESOM2-SR, IFS-NEMO-ER, ICON-ESM-ER, CMIP6 MMM, MPI-ESM1-2-LR/r1i1p1f1, GISS-E2-1-G/r1i1p1f2, IPSL-CM6A-LR/r1i1p1f1, ACCESS-ESM1-5/r1i1p1f1, EC-Earth3/r1i1p1f1, CNRM-CM6-1/r1i1p1f2, AWI-CM-1-1-MR/r1i1p1f1, CNRM-ESM2-1/r1i1p1f2, FGOALS-g3/r1i1p1f1, INM-CM5-0/r1i1p1f1, MRI-ESM2-0/r1i1p1f1 |
| Reference Dataset | ERA5 |
| Units | W/m2/decade |
| Period | 1980–2014 |
| CMIP6 MMM | Global Mean Trend Diff: 0.87 · Trend Rmse: None |
| MPI-ESM1-2-LR/r1i1p1f1 | Global Mean Trend Diff: 0.34 · Trend Rmse: None |
| GISS-E2-1-G/r1i1p1f2 | Global Mean Trend Diff: 0.44 · Trend Rmse: None |
| IPSL-CM6A-LR/r1i1p1f1 | Global Mean Trend Diff: 1.04 · Trend Rmse: None |
| ACCESS-ESM1-5/r1i1p1f1 | Global Mean Trend Diff: 1.31 · Trend Rmse: None |
| EC-Earth3/r1i1p1f1 | Global Mean Trend Diff: 1.88 · Trend Rmse: None |
| CNRM-CM6-1/r1i1p1f2 | Global Mean Trend Diff: 0.48 · Trend Rmse: None |
| AWI-CM-1-1-MR/r1i1p1f1 | Global Mean Trend Diff: 1.01 · Trend Rmse: None |
| CNRM-ESM2-1/r1i1p1f2 | Global Mean Trend Diff: 0.77 · Trend Rmse: None |
| FGOALS-g3/r1i1p1f1 | Global Mean Trend Diff: 0.94 · Trend Rmse: None |
| INM-CM5-0/r1i1p1f1 | Global Mean Trend Diff: 0.72 · Trend Rmse: None |
| MRI-ESM2-0/r1i1p1f1 | Global Mean Trend Diff: 0.62 · Trend Rmse: None |
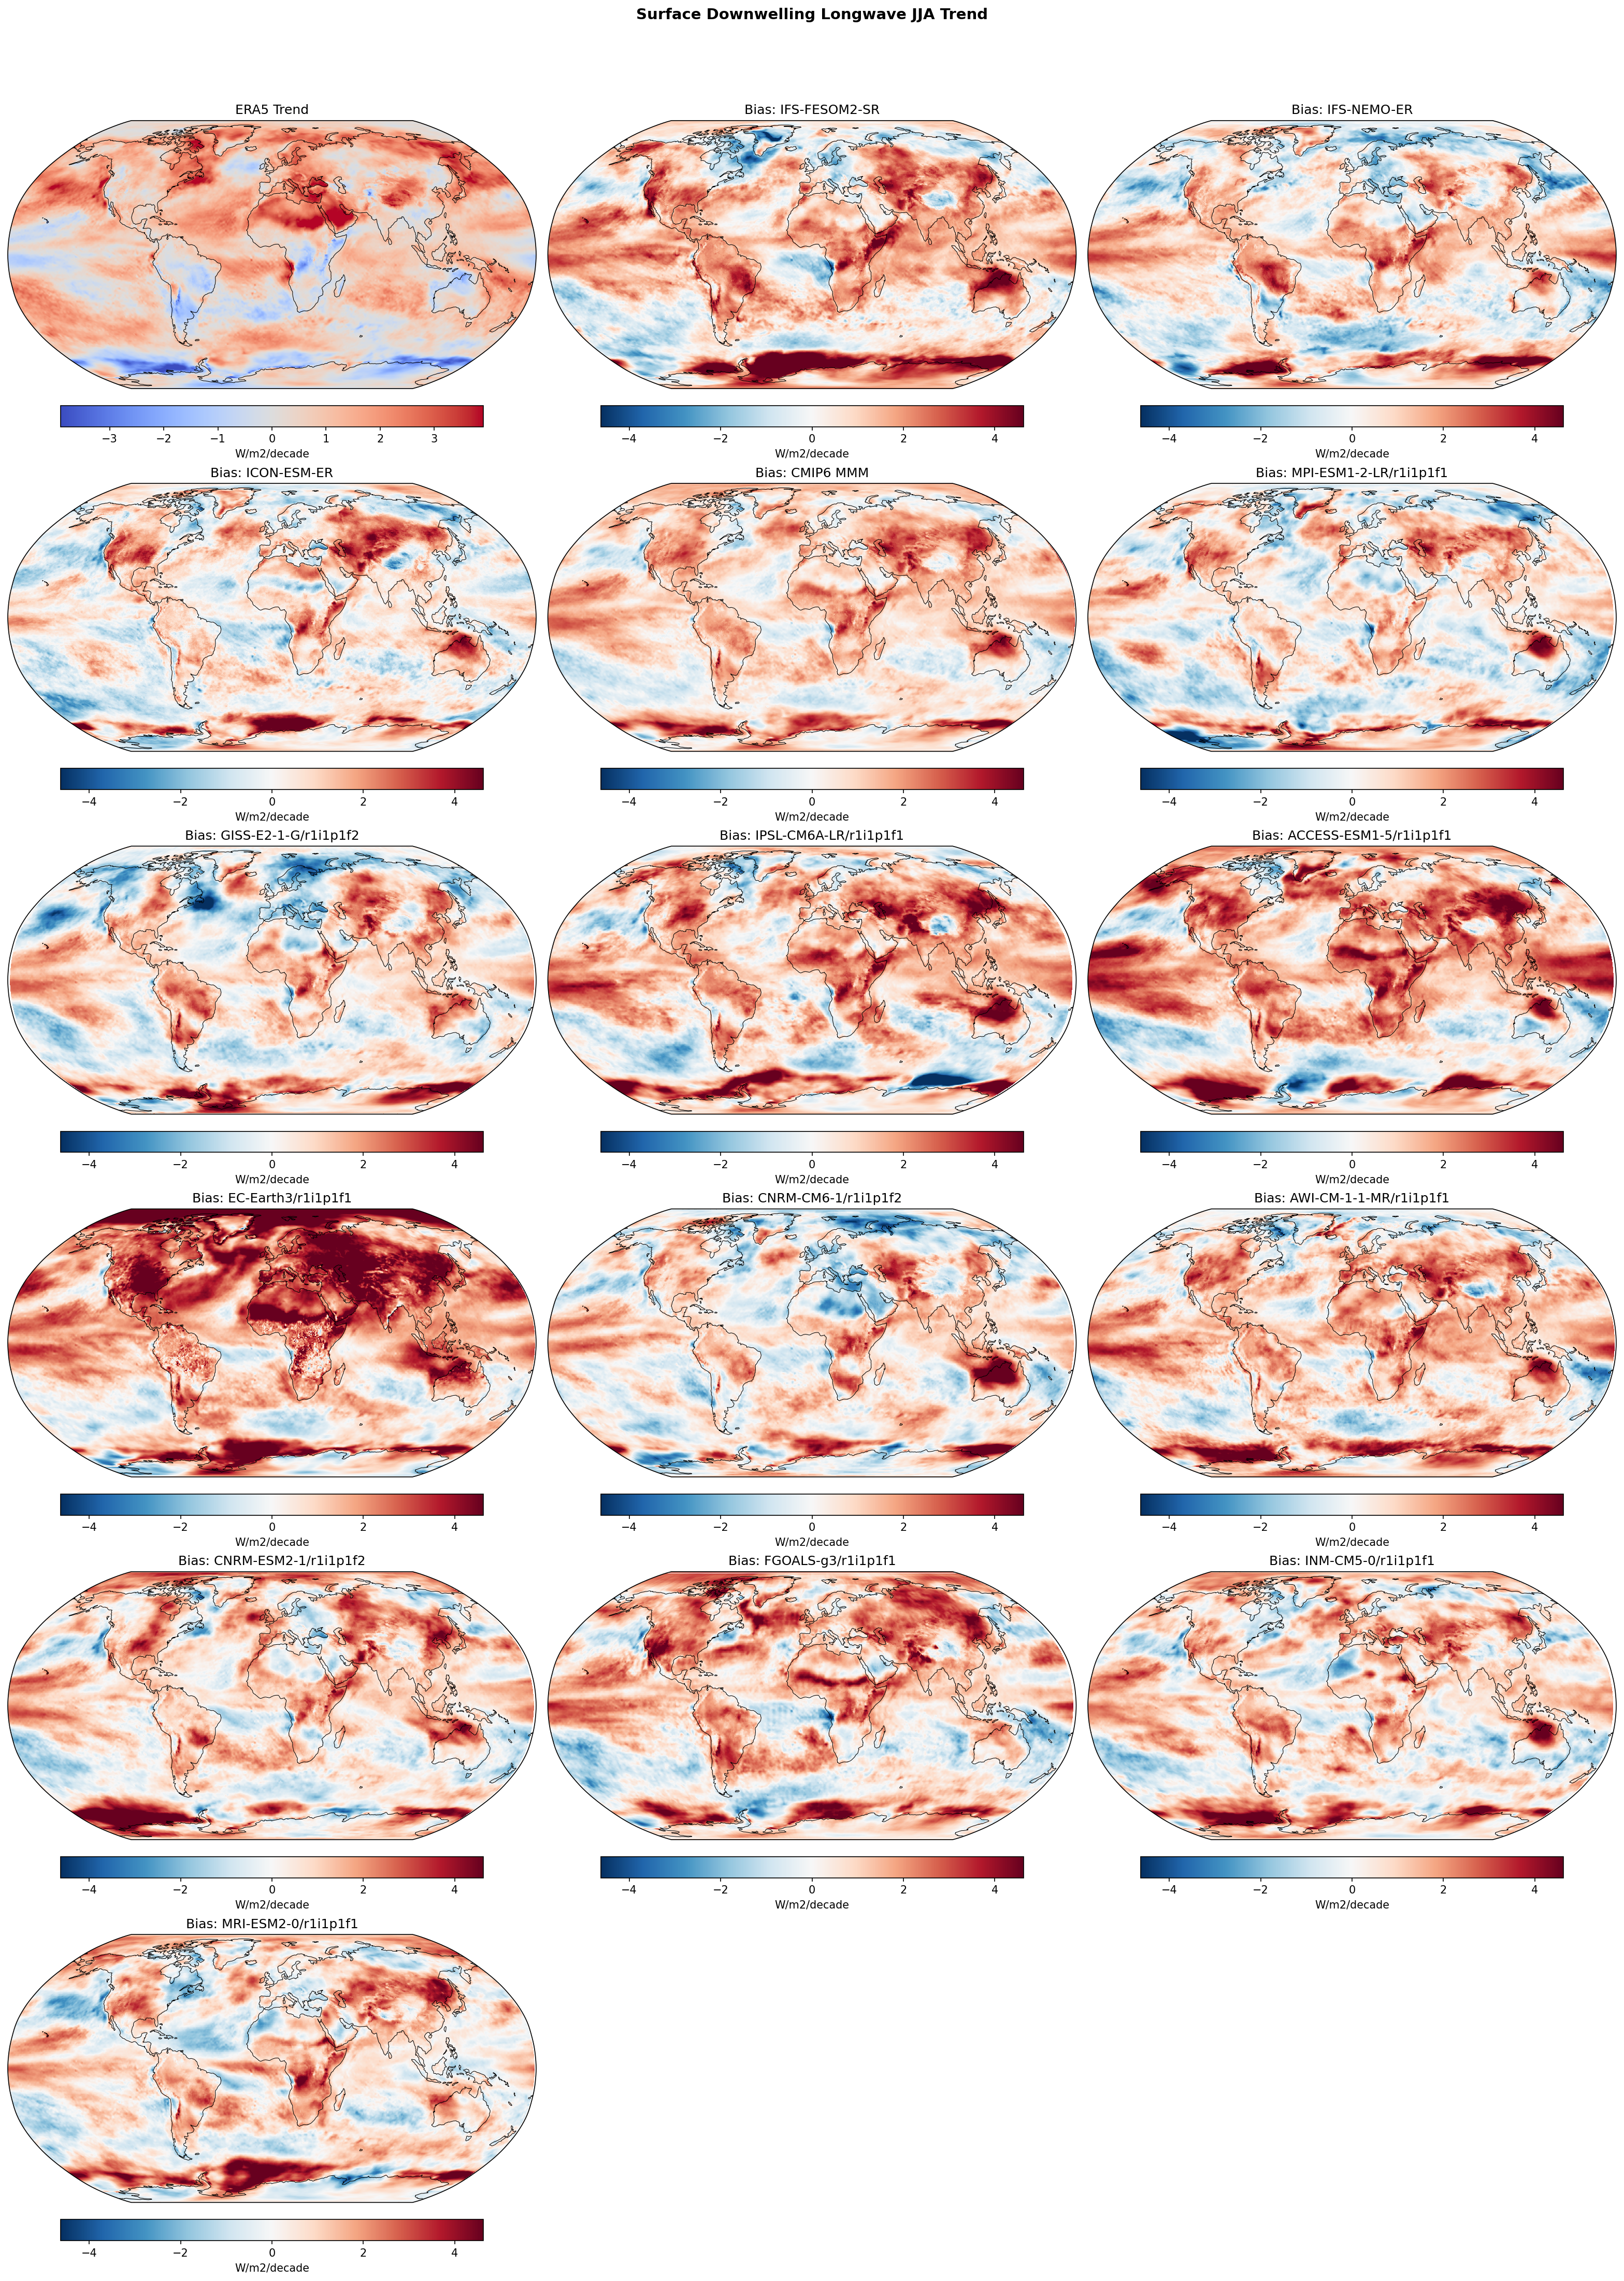
Summary high
This figure evaluates linear trends (1980–2014) in JJA surface downwelling longwave radiation (rlds) for high-resolution EERIE models and the CMIP6 ensemble against ERA5 reanalysis. It highlights a systematic tendency for models to simulate stronger positive trends (increases in downwelling radiation) than observed, particularly over Northern Hemisphere land.
Key Findings
- Systematic positive trend bias: Almost all models, including the high-resolution IFS and ICON simulations, exhibit widespread positive trend biases (red), indicating they simulate a more rapid increase in surface downwelling longwave radiation than ERA5.
- Continental amplification: The trend overestimation is most severe over Northern Hemisphere continents (Eurasia, North America) and the Arctic during the boreal summer (JJA), with excesses often exceeding 2–3 W/m²/decade in models like EC-Earth3 and ICON-ESM-ER.
- Southern Ocean discrepancy: While ERA5 shows weak or negative trends in the Southern Ocean, most models simulate positive trends (red bias), suggesting a failure to capture observed cooling or stable conditions in this region.
- Inter-model spread: EC-Earth3 and ACCESS-ESM1-5 show the strongest positive biases, while MPI-ESM1-2-LR and MRI-ESM2-0 display more moderate biases, though the spatial pattern of overestimation remains consistent.
Spatial Patterns
ERA5 (top-left) shows moderate positive trends (warming) over NH land and the Arctic, with mixed signals over oceans. The model bias maps are dominated by red colors, spatially coherent over continents, indicating that the 'Model minus Observation' trend difference is positive. Localized negative biases (blue) appear in the tropical oceans in some models (e.g., IFS-FESOM2-SR, GISS-E2-1-G), but these are exceptions to the global pattern.
Model Agreement
There is strong qualitative agreement across the hierarchy of models (high-res EERIE vs. standard CMIP6) regarding the sign of the error: models generally warm/moisten the atmosphere faster than ERA5. The EERIE models (IFS-FESOM2-SR, IFS-NEMO-ER, ICON-ESM-ER) do not show a distinct improvement in this metric compared to the CMIP6 Multi-Model Mean; ICON-ESM-ER, in particular, shows strong biases comparable to the higher-sensitivity CMIP6 models.
Physical Interpretation
Surface downwelling longwave radiation is primarily a function of lower-tropospheric temperature and emissivity (controlled by water vapor and clouds). The ubiquitous positive trend bias suggests that models are either overestimating the rate of atmospheric warming (consistent with the known high equilibrium climate sensitivity of many recent models) or simulating an excessive positive feedback in water vapor or cloud cover over land during summer. The strong Arctic biases likely relate to accelerated sea ice loss and associated amplification in the models.
Caveats
- ERA5 trends are derived from reanalysis which can be influenced by changes in the observing system (e.g., satellite assimilation) over the 1980–2014 period.
- The 35-year period is relatively short, meaning internal variability (like decadal modes) could contribute to trend differences between free-running models and historical observations.
Surface Downwelling Shortwave Annual Linear Trend
| Variables | rsds |
|---|---|
| Models | IFS-FESOM2-SR, IFS-NEMO-ER, ICON-ESM-ER, CMIP6 MMM, MPI-ESM1-2-LR/r1i1p1f1, GISS-E2-1-G/r1i1p1f2, IPSL-CM6A-LR/r1i1p1f1, ACCESS-ESM1-5/r1i1p1f1, EC-Earth3/r1i1p1f1, CNRM-CM6-1/r1i1p1f2, AWI-CM-1-1-MR/r1i1p1f1, CNRM-ESM2-1/r1i1p1f2, FGOALS-g3/r1i1p1f1, INM-CM5-0/r1i1p1f1, MRI-ESM2-0/r1i1p1f1 |
| Reference Dataset | ERA5 |
| Units | W/m2/decade |
| Period | 1980–2014 |
| IFS-FESOM2-SR | Global Mean Trend: -0.16 · Global Mean Trend Diff: -0.08 · Trend Rmse: 1.79 |
| IFS-NEMO-ER | Global Mean Trend: -0.18 · Global Mean Trend Diff: -0.10 · Trend Rmse: 1.69 |
| ICON-ESM-ER | Global Mean Trend: -0.12 · Global Mean Trend Diff: -0.04 · Trend Rmse: 1.92 |
| CMIP6 MMM | Global Mean Trend Diff: -0.06 · Trend Rmse: 1.65 |
| MPI-ESM1-2-LR/r1i1p1f1 | Global Mean Trend Diff: 0.02 · Trend Rmse: 1.69 |
| GISS-E2-1-G/r1i1p1f2 | Global Mean Trend Diff: -0.12 · Trend Rmse: 1.89 |
| IPSL-CM6A-LR/r1i1p1f1 | Global Mean Trend Diff: -0.15 · Trend Rmse: 1.83 |
| ACCESS-ESM1-5/r1i1p1f1 | Global Mean Trend Diff: 0.27 · Trend Rmse: 2.15 |
| EC-Earth3/r1i1p1f1 | Global Mean Trend Diff: -0.19 · Trend Rmse: 2.02 |
| CNRM-CM6-1/r1i1p1f2 | Global Mean Trend Diff: -0.10 · Trend Rmse: 1.93 |
| AWI-CM-1-1-MR/r1i1p1f1 | Global Mean Trend Diff: -0.07 · Trend Rmse: 1.85 |
| CNRM-ESM2-1/r1i1p1f2 | Global Mean Trend Diff: -0.18 · Trend Rmse: 1.84 |
| FGOALS-g3/r1i1p1f1 | Global Mean Trend Diff: -0.11 · Trend Rmse: 1.92 |
| INM-CM5-0/r1i1p1f1 | Global Mean Trend Diff: 0.12 · Trend Rmse: 1.82 |
| MRI-ESM2-0/r1i1p1f1 | Global Mean Trend Diff: -0.10 · Trend Rmse: 1.86 |
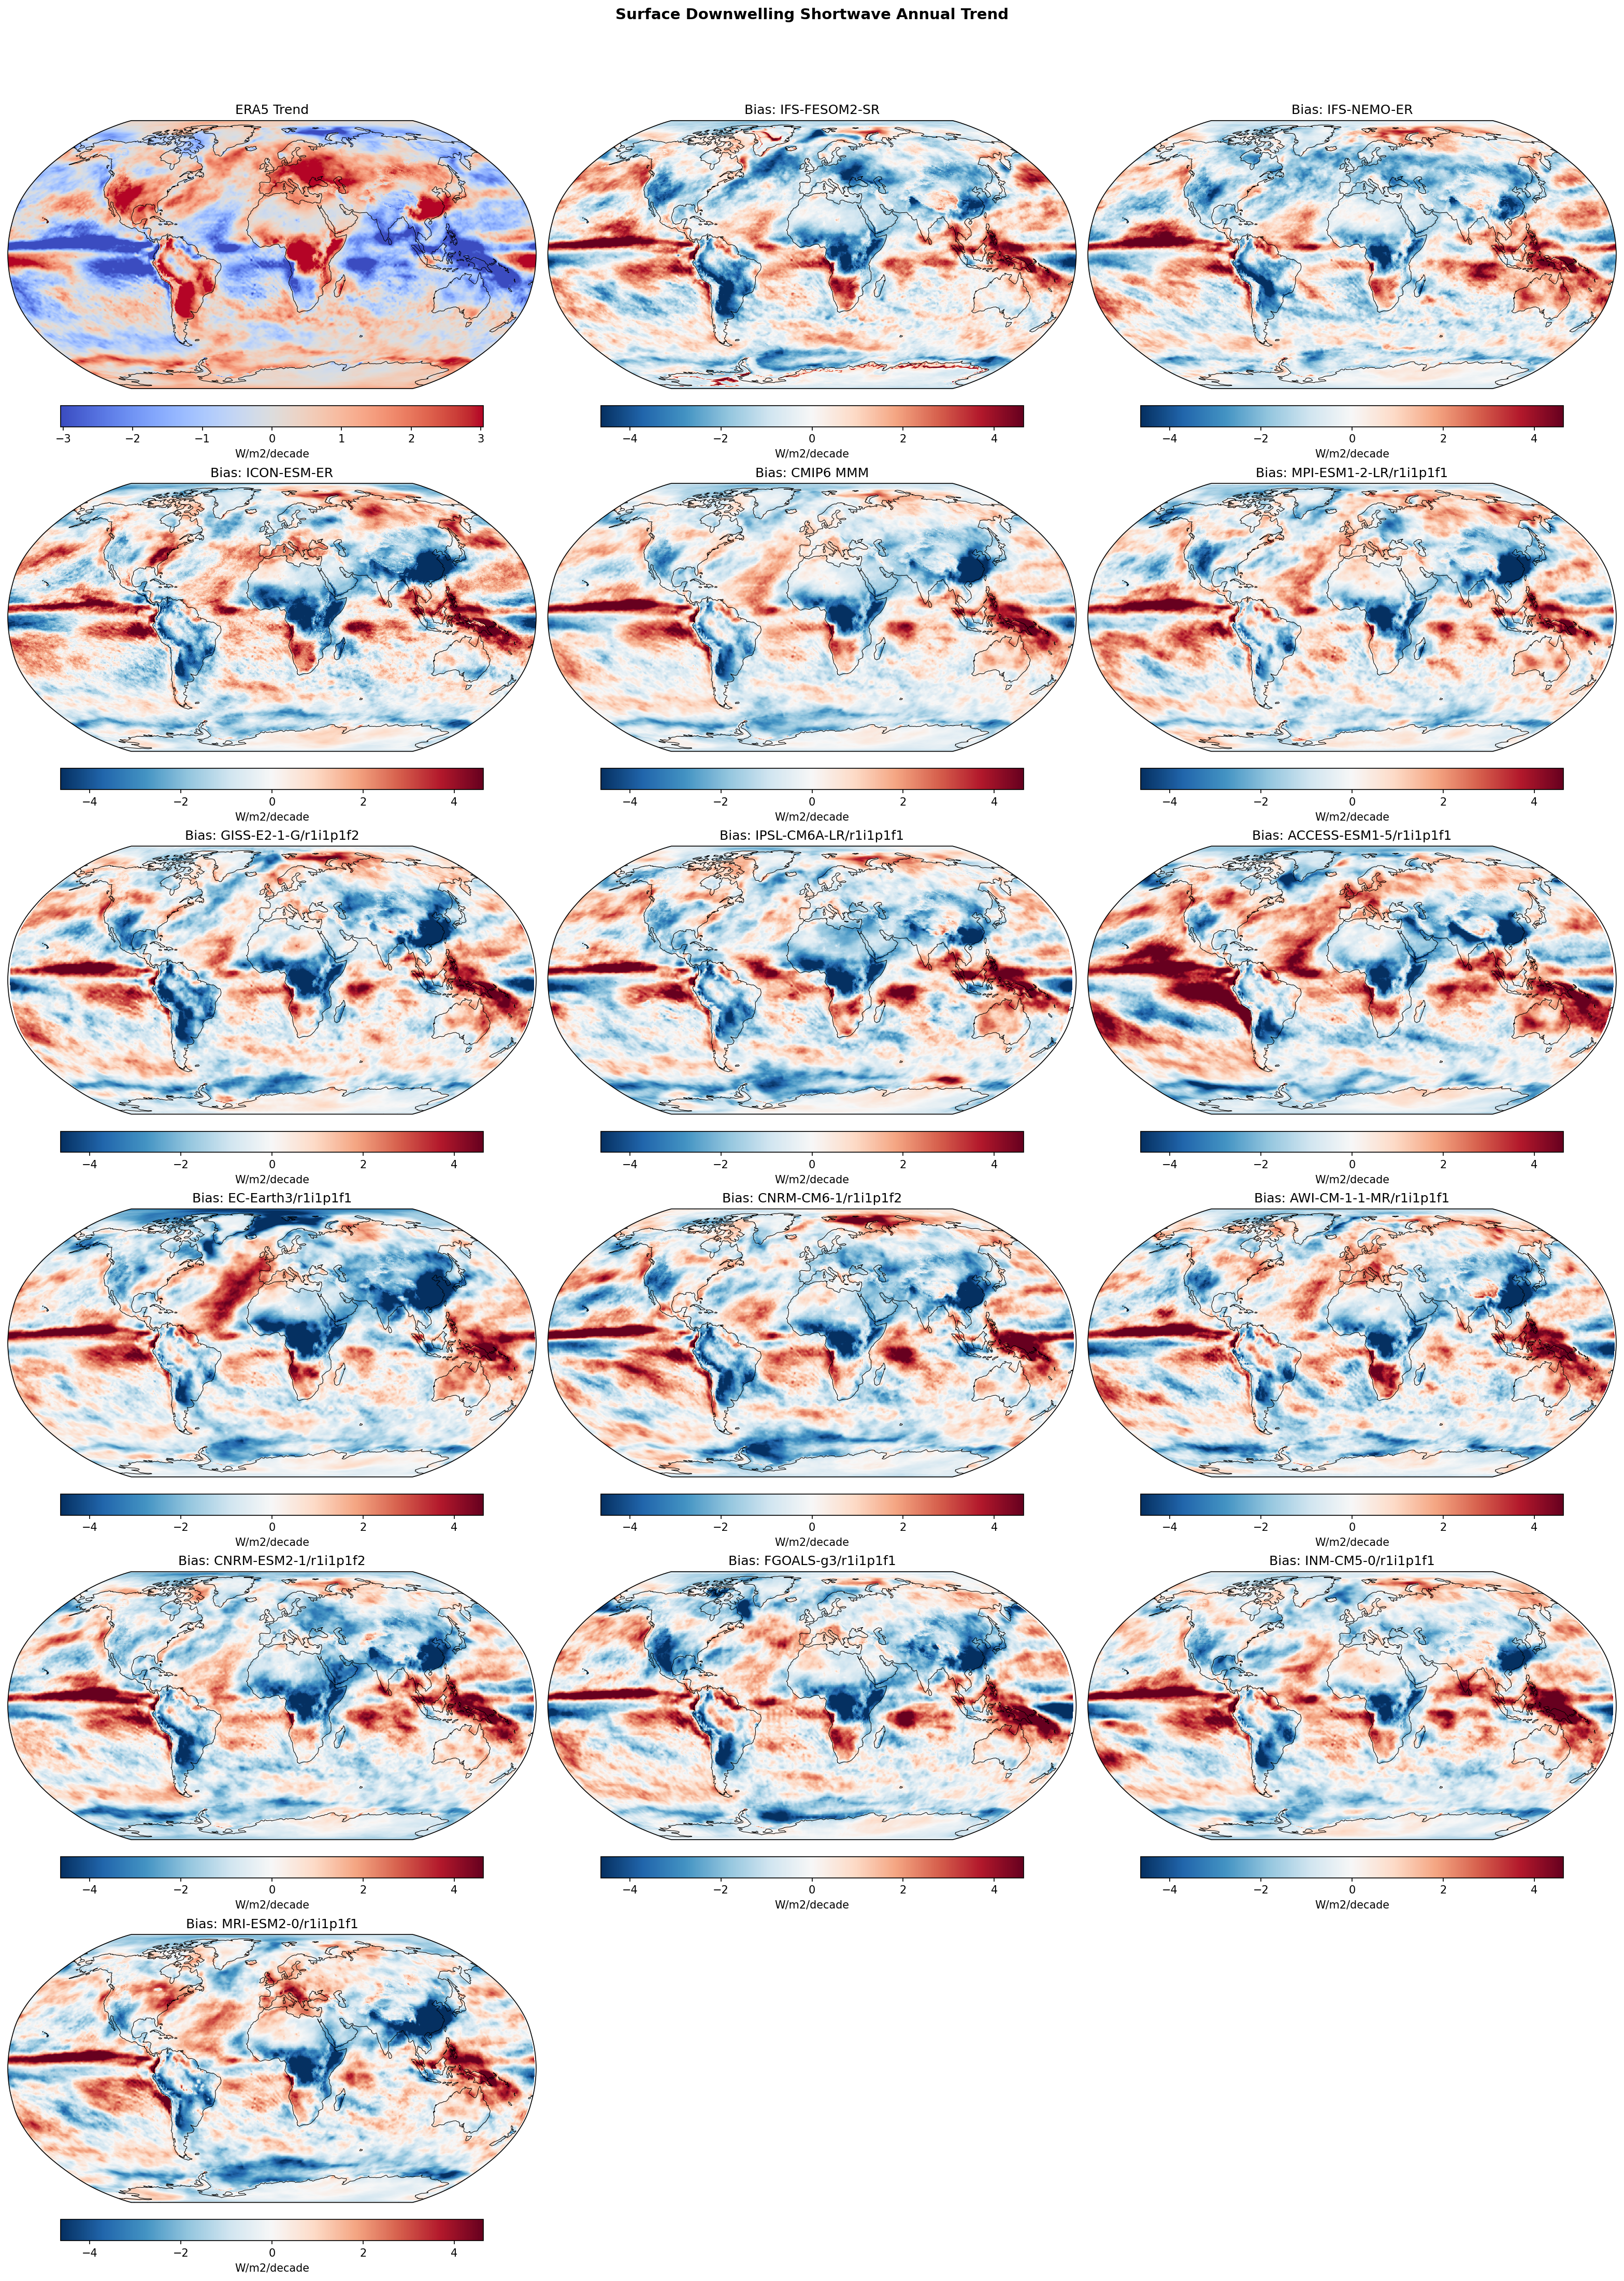
Summary high
This figure evaluates annual linear trends in surface downwelling shortwave radiation (1980–2014) for high-resolution EERIE models (IFS, ICON) and CMIP6 simulations compared to ERA5 reanalysis.
Key Findings
- ERA5 displays a strong 'La Niña-like' trend pattern in the Pacific (dimming in the West, brightening in the East), which models systematically fail to reproduce.
- Almost all models exhibit a dipole bias in the Tropical Pacific (positive bias in the West, negative in the East), indicating they simulate a weaker Walker circulation strengthening than observed.
- High-resolution models (IFS-FESOM2-SR, IFS-NEMO-ER, ICON-ESM-ER) do not outperform the CMIP6 Multi-Model Mean in capturing these trend spatial patterns, showing similar regional biases.
Spatial Patterns
ERA5 shows significant brightening (red, positive trend) in the Eastern Pacific, North Atlantic, and Europe, and dimming (blue, negative trend) in the Western Pacific and Maritime Continent. The model bias maps are largely the inverse of this pattern: they show red biases (model > obs) in the Western Pacific and blue biases (model < obs) in the Eastern Pacific and North Atlantic. This indicates that models underestimate the magnitude of the observed brightening in the East and dimming in the West.
Model Agreement
There is high inter-model agreement regarding the sign of the error in the Tropical Pacific. The IFS and ICON variants show very similar bias structures to the CMIP6 MMM. Individual CMIP6 models show more variation (e.g., ACCESS-ESM1-5 shows widespread positive biases), but the core failure to capture the Pacific zonal gradient trend is common across the ensemble.
Physical Interpretation
The observed trends are consistent with a strengthening of the Pacific Walker circulation (La Niña-like trend) over this period, driving increased cloudiness in the West and clearing in the East. Current coupled climate models historically struggle to reproduce this pattern, often simulating uniform warming or El Niño-like trends due to parameterized physics or incorrect internal variability phasing. Biases in the North Atlantic (underestimated brightening) may relate to aerosol-cloud interaction strength or the trajectory of aerosol removal.
Caveats
- Trends over short periods (35 years) are heavily influenced by internal climate variability (e.g., IPO phase); model mismatch may result from random phasing rather than structural error.
- ERA5 surface radiation trends may contain artifacts due to changes in satellite data assimilation over the 1980–2014 period.
Surface Downwelling Shortwave DJF Linear Trend
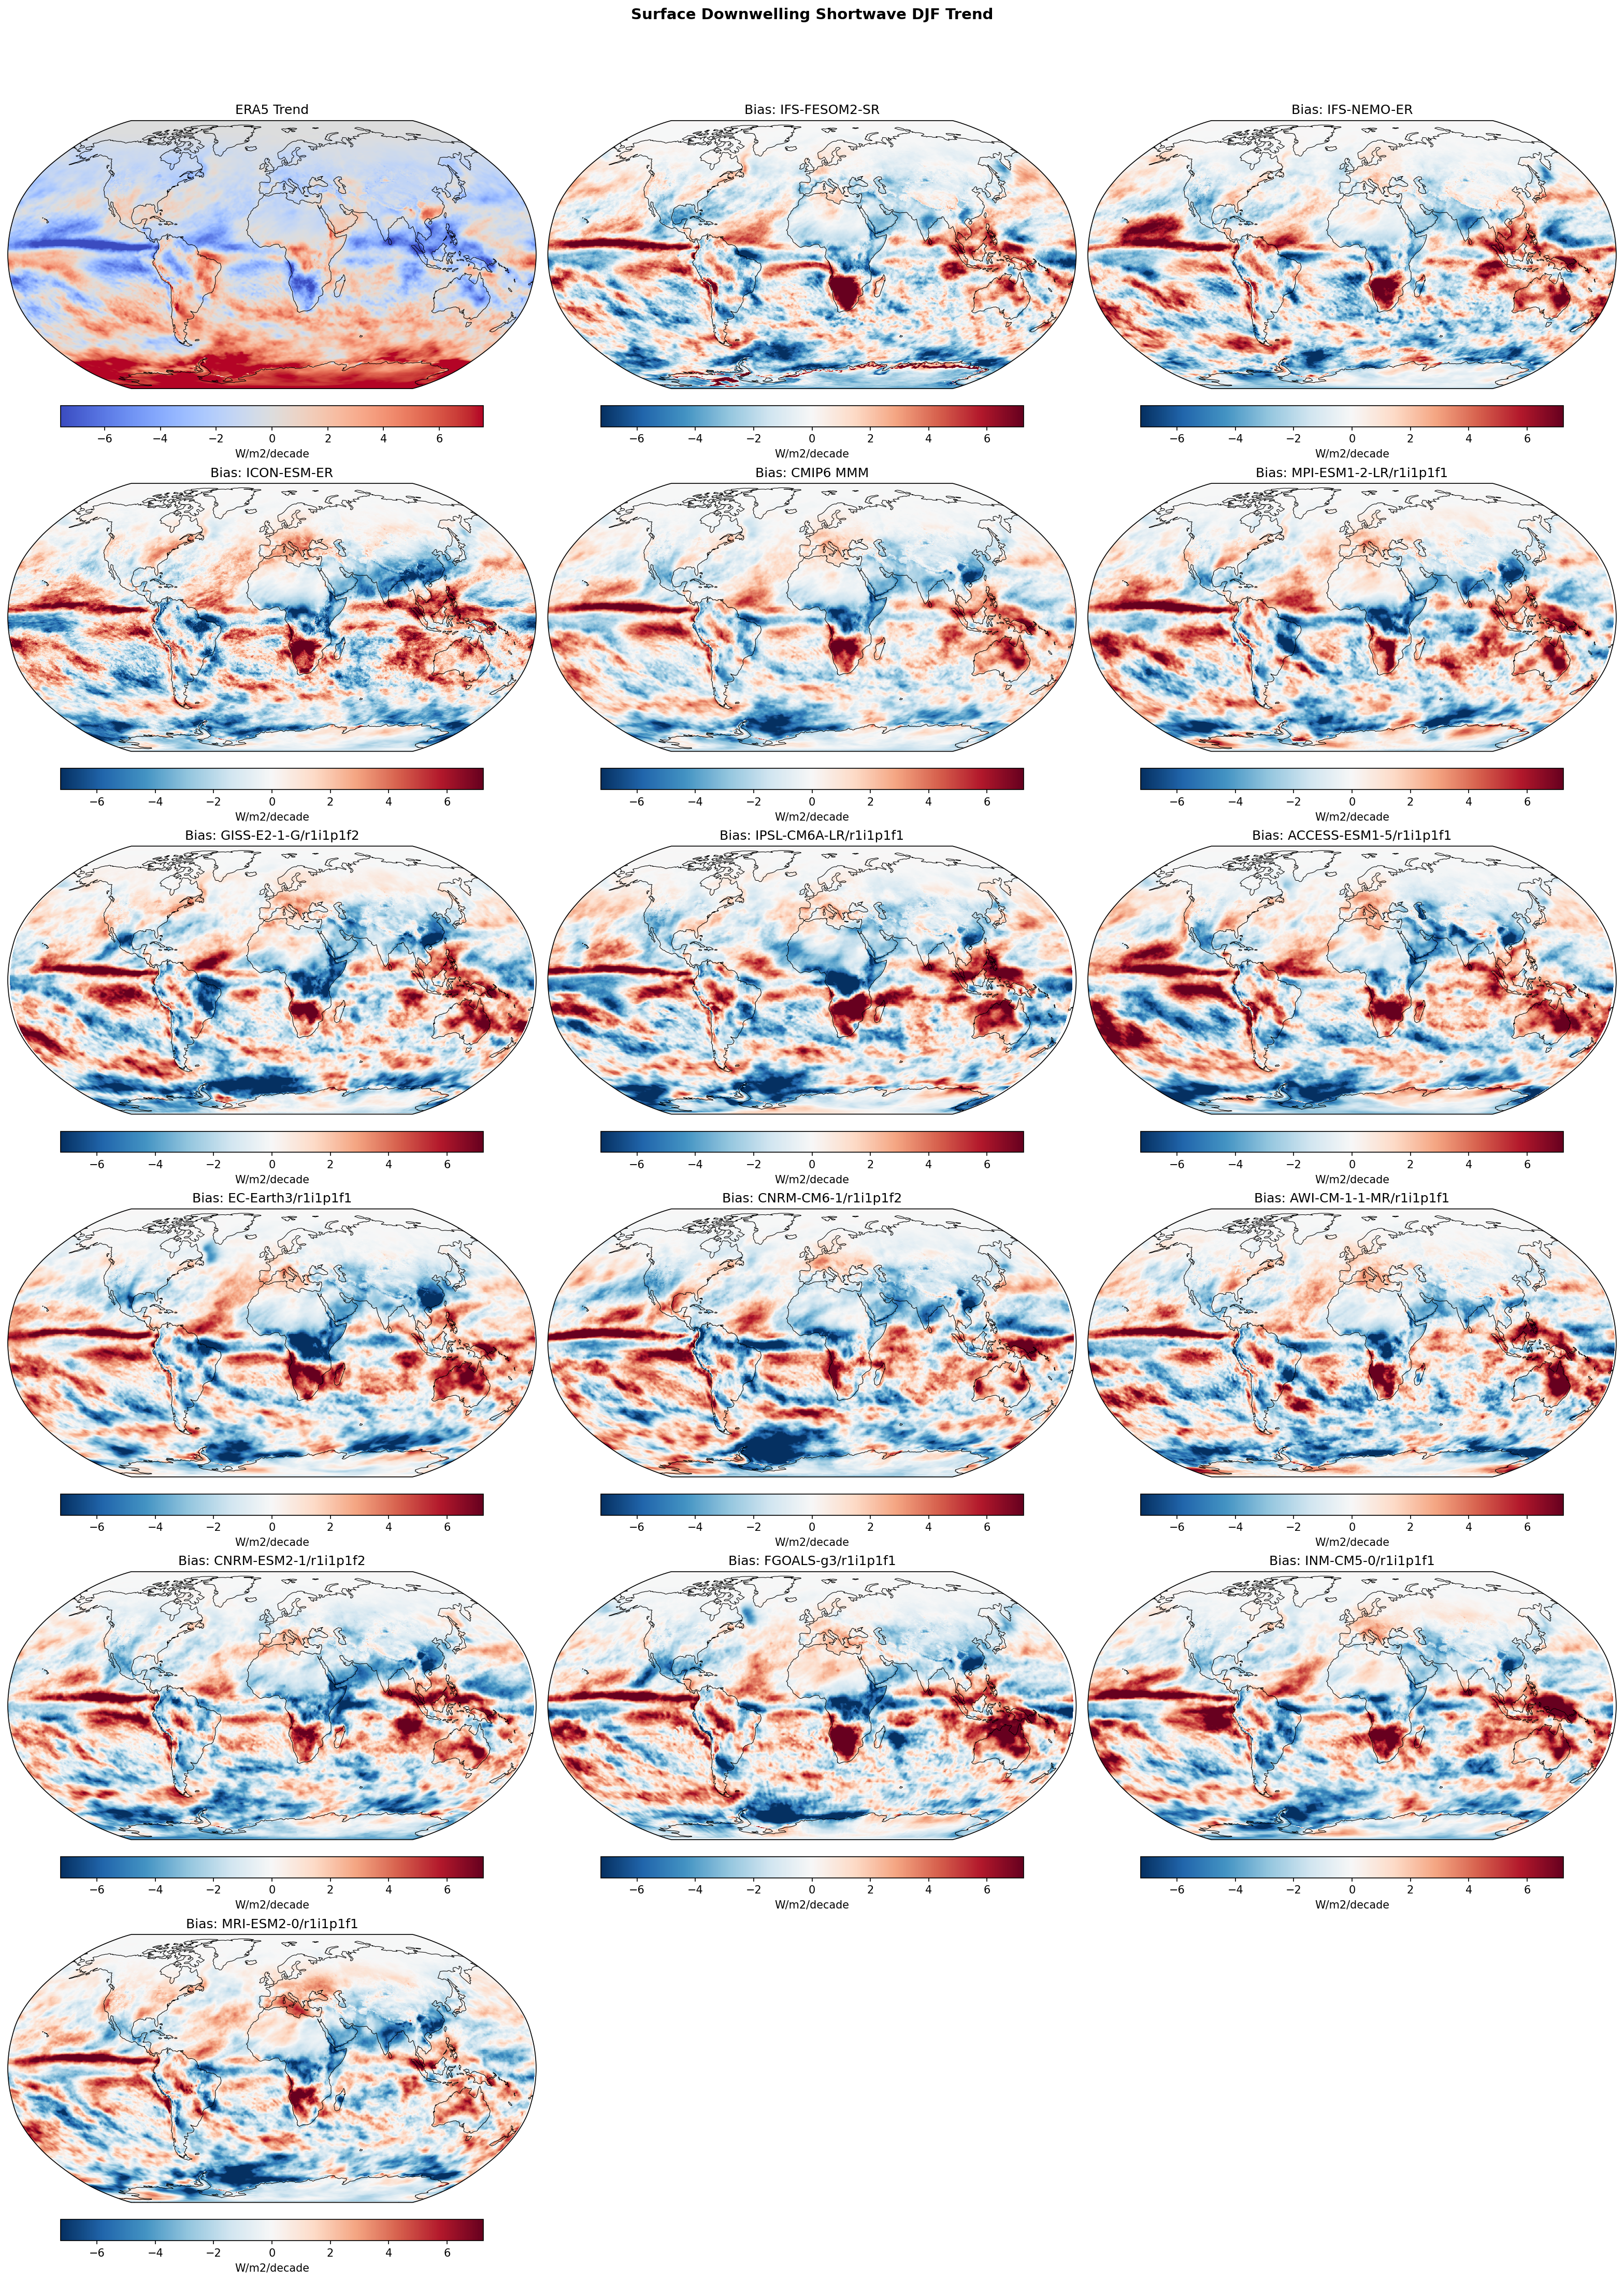
| Variables | rsds |
|---|---|
| Models | IFS-FESOM2-SR, IFS-NEMO-ER, ICON-ESM-ER, CMIP6 MMM, MPI-ESM1-2-LR/r1i1p1f1, GISS-E2-1-G/r1i1p1f2, IPSL-CM6A-LR/r1i1p1f1, ACCESS-ESM1-5/r1i1p1f1, EC-Earth3/r1i1p1f1, CNRM-CM6-1/r1i1p1f2, AWI-CM-1-1-MR/r1i1p1f1, CNRM-ESM2-1/r1i1p1f2, FGOALS-g3/r1i1p1f1, INM-CM5-0/r1i1p1f1, MRI-ESM2-0/r1i1p1f1 |
| Reference Dataset | ERA5 |
| Units | W/m2/decade |
| Period | 1980–2014 |
| CMIP6 MMM | Global Mean Trend Diff: -0.01 · Trend Rmse: None |
| MPI-ESM1-2-LR/r1i1p1f1 | Global Mean Trend Diff: 0.07 · Trend Rmse: None |
| GISS-E2-1-G/r1i1p1f2 | Global Mean Trend Diff: -0.10 · Trend Rmse: None |
| IPSL-CM6A-LR/r1i1p1f1 | Global Mean Trend Diff: -0.11 · Trend Rmse: None |
| ACCESS-ESM1-5/r1i1p1f1 | Global Mean Trend Diff: 0.20 · Trend Rmse: None |
| EC-Earth3/r1i1p1f1 | Global Mean Trend Diff: 0.02 · Trend Rmse: None |
| CNRM-CM6-1/r1i1p1f2 | Global Mean Trend Diff: -0.09 · Trend Rmse: None |
| AWI-CM-1-1-MR/r1i1p1f1 | Global Mean Trend Diff: -0.07 · Trend Rmse: None |
| CNRM-ESM2-1/r1i1p1f2 | Global Mean Trend Diff: -0.14 · Trend Rmse: None |
| FGOALS-g3/r1i1p1f1 | Global Mean Trend Diff: 0.14 · Trend Rmse: None |
| INM-CM5-0/r1i1p1f1 | Global Mean Trend Diff: 0.16 · Trend Rmse: None |
| MRI-ESM2-0/r1i1p1f1 | Global Mean Trend Diff: -0.17 · Trend Rmse: None |
Summary high
This figure evaluates the 1980–2014 linear trends in DJF surface downwelling shortwave radiation (rsds), comparing ERA5 reanalysis against high-resolution EERIE models (IFS, ICON) and a suite of CMIP6 models. The analysis reveals that both high- and standard-resolution models systematically fail to reproduce the observed trend patterns, particularly the strong brightening in the Southern Ocean and the specific zonal structures in the tropics.
Key Findings
- Systematic failure to capture Southern Ocean brightening: ERA5 shows a strong positive trend (brightening) in the Southern Ocean (50°S–65°S), while almost all models exhibit a negative bias, indicating they underestimate this trend or simulate dimming.
- Tropical trend mismatch driven by variability: Models consistently show positive trend biases (model > obs) in the tropical Pacific and Atlantic ITCZ regions, likely due to phase mismatches in decadal variability (e.g., IPO) compared to the single observed realization.
- Resolution independence of trend biases: The eddy-rich EERIE models (IFS-FESOM2-SR, IFS-NEMO-ER) display the same large-scale error patterns as the coarser CMIP6 ensemble, suggesting these discrepancies stem from fundamental physical parameterizations (clouds) or internal variability sampling rather than resolution.
Spatial Patterns
ERA5 exhibits distinct brightening (red) in the Southern Ocean and North Atlantic, and dimming (blue) in the western tropical Pacific. The model bias maps are dominated by a 'dipole' error structure: widespread negative biases (underestimated brightening) in the extratropics—especially the Southern Ocean and North Atlantic—and strong positive biases (overestimated brightening) in the tropical convective zones (ITCZ/SPCZ).
Model Agreement
There is high inter-model agreement regarding the sign of the biases. The CMIP6 Multi-Model Mean (MMM) closely resembles the individual high-resolution simulations, confirming that the discrepancy in the Southern Ocean and Tropics is a systematic feature across the current generation of coupled climate models.
Physical Interpretation
The negative bias in the Southern Ocean likely reflects errors in cloud radiative feedbacks or the simulation of jet shifts (SAM trends) which modulate cloud cover; models often maintain too much cloud optical depth compared to the observed clearing. The tropical discrepancies are consistent with the 'pattern effect' or IPO phase mismatch: the observed period (1980–2014) featured a specific evolution of Pacific trade winds and sea surface temperatures that free-running models, initialized differently or dominated by internal variability, do not reproduce deterministically.
Caveats
- Internal Variability: Comparing 35-year trends from free-running coupled models to a single observational realization is prone to mismatches in decadal variability phases (e.g., ENSO/IPO), which strongly influence regional radiation trends.
- ERA5 Uncertainty: Trends in reanalysis surface radiation are model-derived and sensitive to changes in the observing system (satellite assimilated data) over the period, though the Southern Ocean signal is robust in other datasets.
Surface Downwelling Shortwave JJA Linear Trend
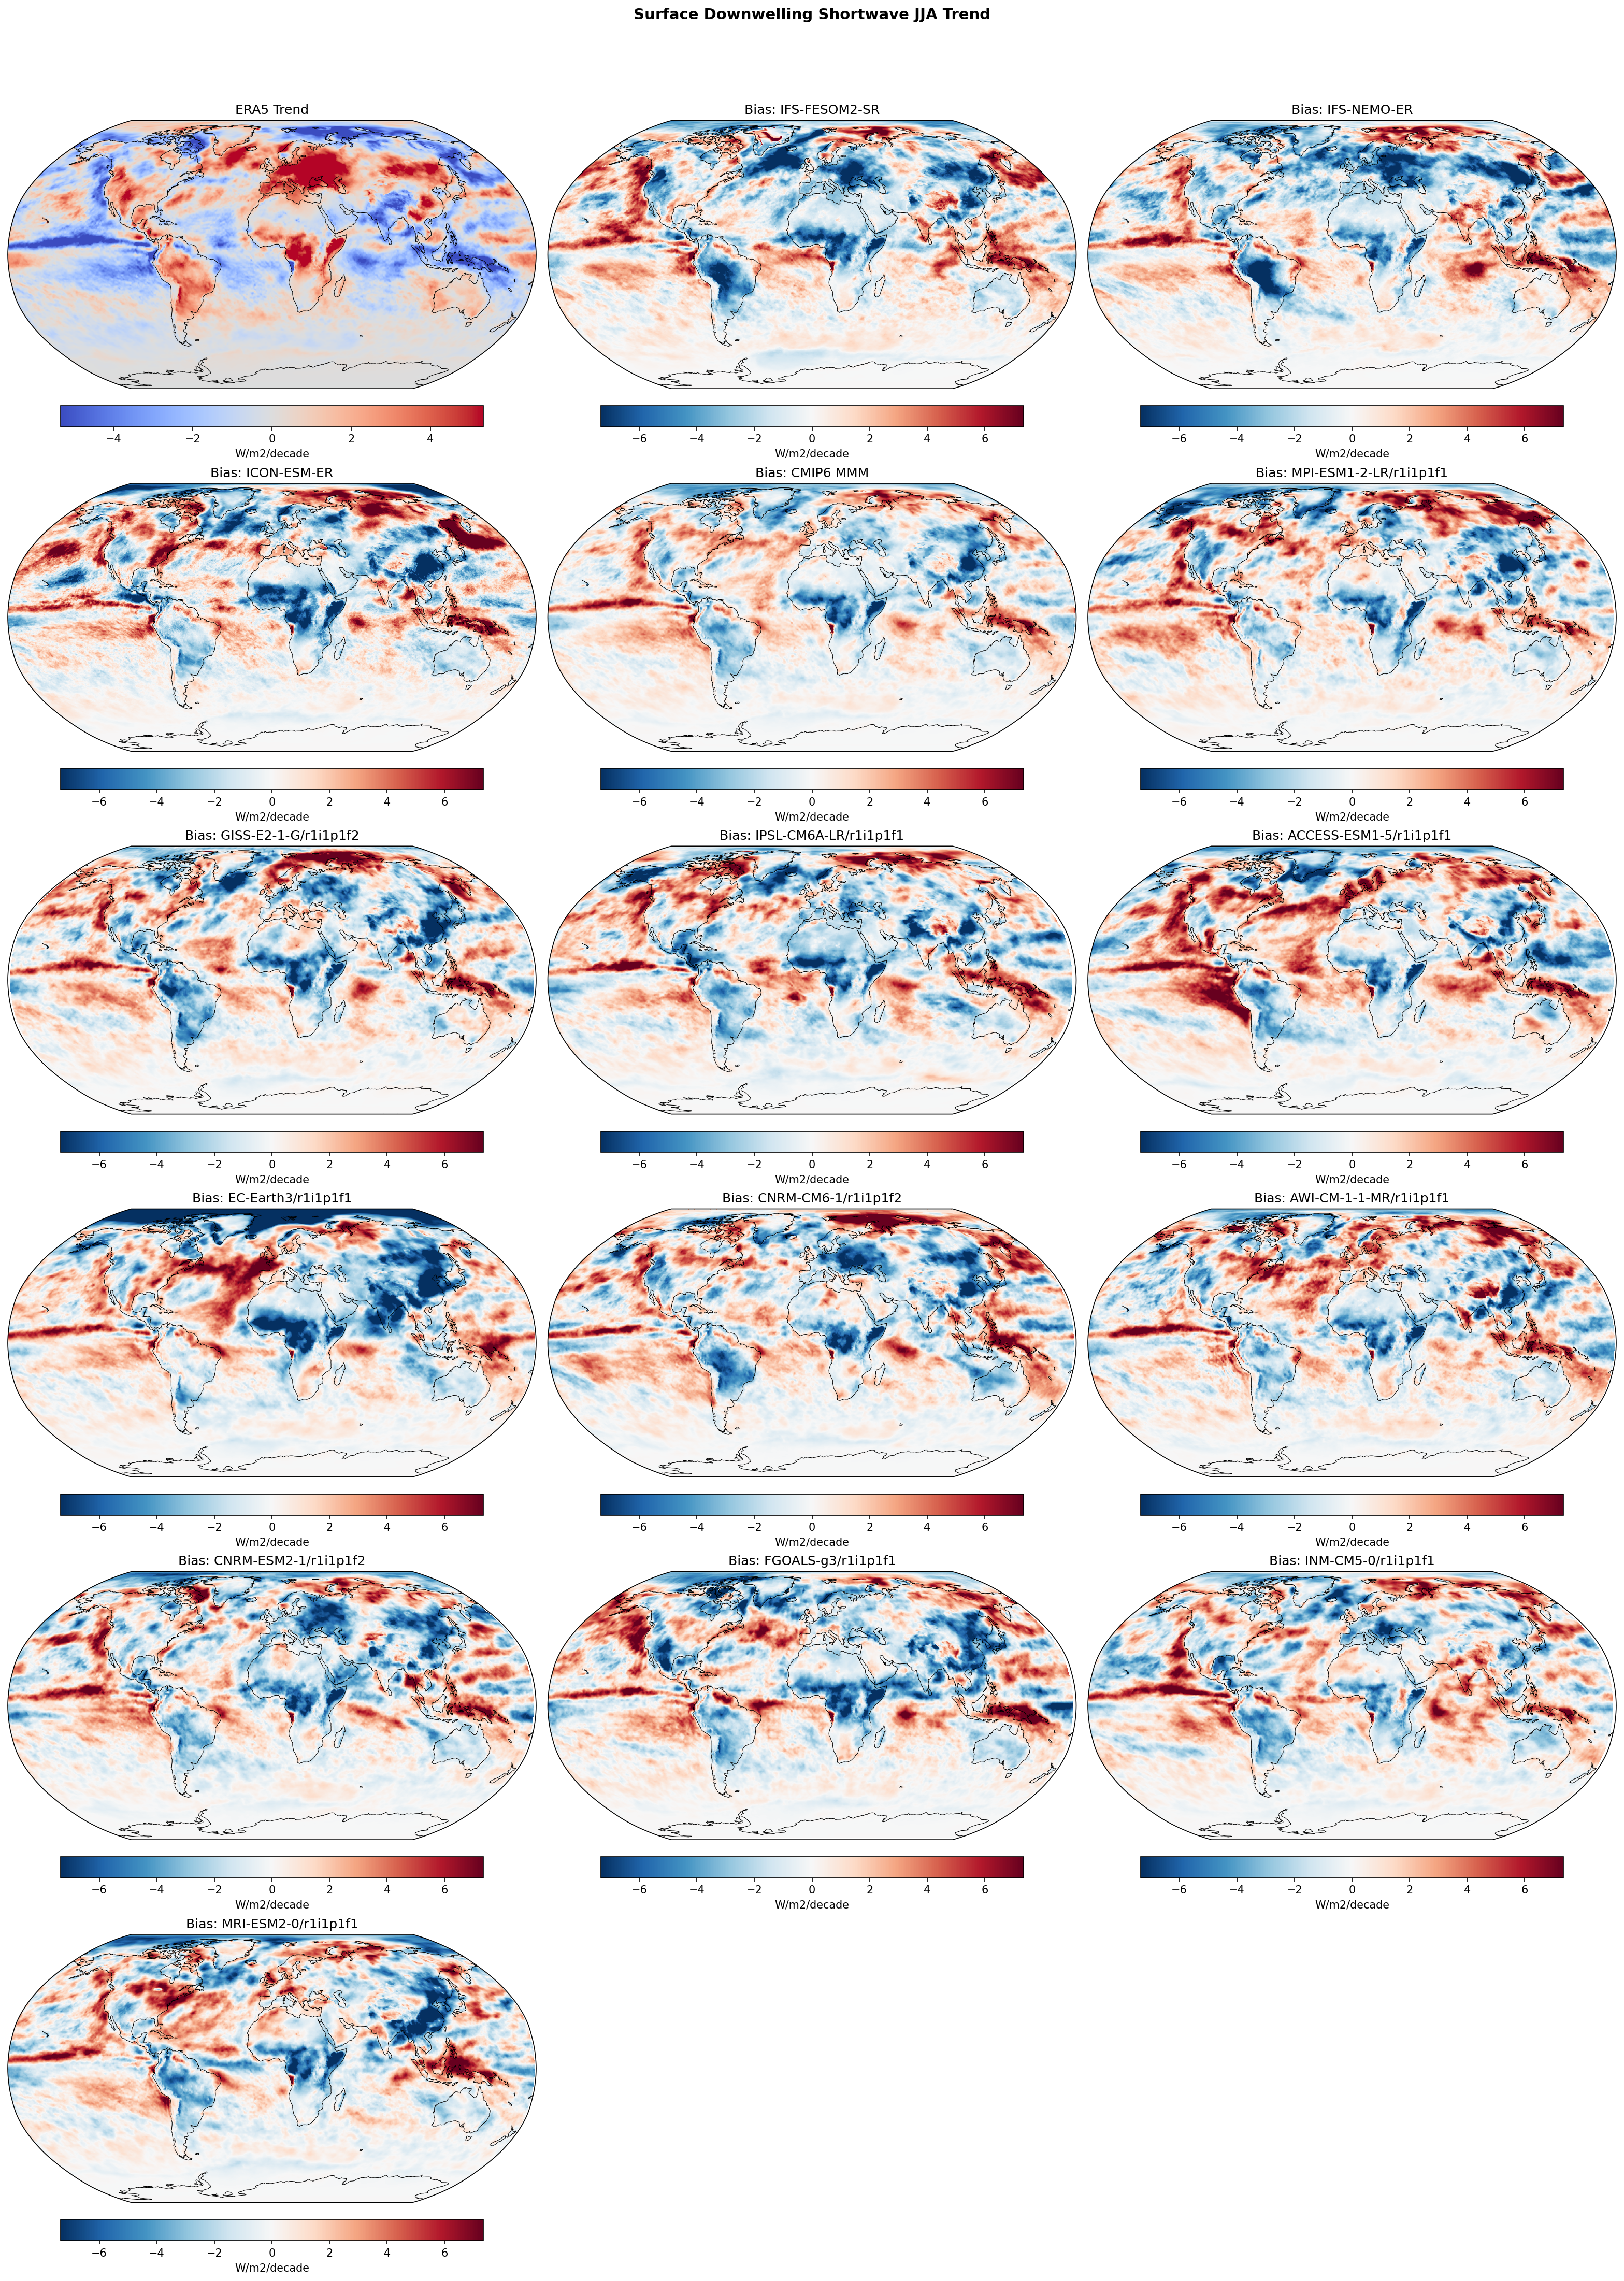
| Variables | rsds |
|---|---|
| Models | IFS-FESOM2-SR, IFS-NEMO-ER, ICON-ESM-ER, CMIP6 MMM, MPI-ESM1-2-LR/r1i1p1f1, GISS-E2-1-G/r1i1p1f2, IPSL-CM6A-LR/r1i1p1f1, ACCESS-ESM1-5/r1i1p1f1, EC-Earth3/r1i1p1f1, CNRM-CM6-1/r1i1p1f2, AWI-CM-1-1-MR/r1i1p1f1, CNRM-ESM2-1/r1i1p1f2, FGOALS-g3/r1i1p1f1, INM-CM5-0/r1i1p1f1, MRI-ESM2-0/r1i1p1f1 |
| Reference Dataset | ERA5 |
| Units | W/m2/decade |
| Period | 1980–2014 |
| CMIP6 MMM | Global Mean Trend Diff: -0.03 · Trend Rmse: None |
| MPI-ESM1-2-LR/r1i1p1f1 | Global Mean Trend Diff: 0.07 · Trend Rmse: None |
| GISS-E2-1-G/r1i1p1f2 | Global Mean Trend Diff: -0.05 · Trend Rmse: None |
| IPSL-CM6A-LR/r1i1p1f1 | Global Mean Trend Diff: -0.14 · Trend Rmse: None |
| ACCESS-ESM1-5/r1i1p1f1 | Global Mean Trend Diff: 0.37 · Trend Rmse: None |
| EC-Earth3/r1i1p1f1 | Global Mean Trend Diff: -0.26 · Trend Rmse: None |
| CNRM-CM6-1/r1i1p1f2 | Global Mean Trend Diff: -0.01 · Trend Rmse: None |
| AWI-CM-1-1-MR/r1i1p1f1 | Global Mean Trend Diff: 0.05 · Trend Rmse: None |
| CNRM-ESM2-1/r1i1p1f2 | Global Mean Trend Diff: -0.19 · Trend Rmse: None |
| FGOALS-g3/r1i1p1f1 | Global Mean Trend Diff: -0.14 · Trend Rmse: None |
| INM-CM5-0/r1i1p1f1 | Global Mean Trend Diff: 0.10 · Trend Rmse: None |
| MRI-ESM2-0/r1i1p1f1 | Global Mean Trend Diff: -0.09 · Trend Rmse: None |
Summary high
This figure evaluates linear trends in Surface Downwelling Shortwave (RSDS) radiation for JJA (1980–2014), comparing EERIE high-resolution models (IFS, ICON) and CMIP6 models against ERA5 reanalysis. The analysis highlights a systematic failure across both high-resolution and standard-resolution models to reproduce the magnitude of observed surface brightening in the North Atlantic and Europe.
Key Findings
- ERA5 shows a strong positive trend (brightening, >2-4 W/m²/decade) over the North Atlantic, Europe, and parts of East Asia, likely linked to declining aerosol emissions.
- Almost all models, including IFS-FESOM2-SR, IFS-NEMO-ER, and ICON-ESM-ER, exhibit a widespread negative trend difference (blue bias) in the North Atlantic and Europe, indicating they underestimate this brightening.
- Tropical trend biases vary significantly; while ERA5 shows dimming (negative trend) in parts of the Tropical Pacific, models like ACCESS-ESM1-5 show strong positive trend biases, whereas the EERIE models show more mixed, smaller-scale errors.
- The high-resolution EERIE models do not show a distinct improvement over the CMIP6 Multi-Model Mean regarding the North Atlantic brightening bias, suggesting the issue is microphysical or forcing-related rather than resolution-dependent.
Spatial Patterns
ERA5 displays a coherent pattern of mid-latitude Northern Hemisphere brightening (red) and Tropical Pacific dimming (blue). The model bias maps are dominated by a 'blue hole' over the North Atlantic and Europe, representing the underestimation of the positive trend. In the Southern Hemisphere (winter in JJA), trends and biases are negligible due to low insolation.
Model Agreement
There is high inter-model agreement (including between EERIE and CMIP6) on the negative trend bias in the North Atlantic. Agreement is lower in the tropics, where models like ACCESS-ESM1-5 and EC-Earth3 diverge significantly from the ensemble behavior.
Physical Interpretation
The observed North Atlantic brightening is physically driven by the reduction of anthropogenic aerosols (sulfate) and subsequent reduction in cloud droplet concentrations (aerosol indirect effect) and direct scattering. The systematic model underestimation implies that the models either have weak aerosol radiative forcing efficiencies, underestimate the reduction in aerosol load, or fail to simulate the associated decrease in cloud cover/opacity. The tropical biases relate to uncertainties in the response of convective cloud decks (ITCZ/SPCZ) to warming.
Caveats
- ERA5 surface radiation is a model-derived product (generated during the forecast step) rather than a direct observation, though it is constrained by assimilated atmospheric data.
- The analysis is limited to JJA, which emphasizes Northern Hemisphere dynamics due to the seasonal cycle of insolation.
2m Temperature Annual Linear Trend
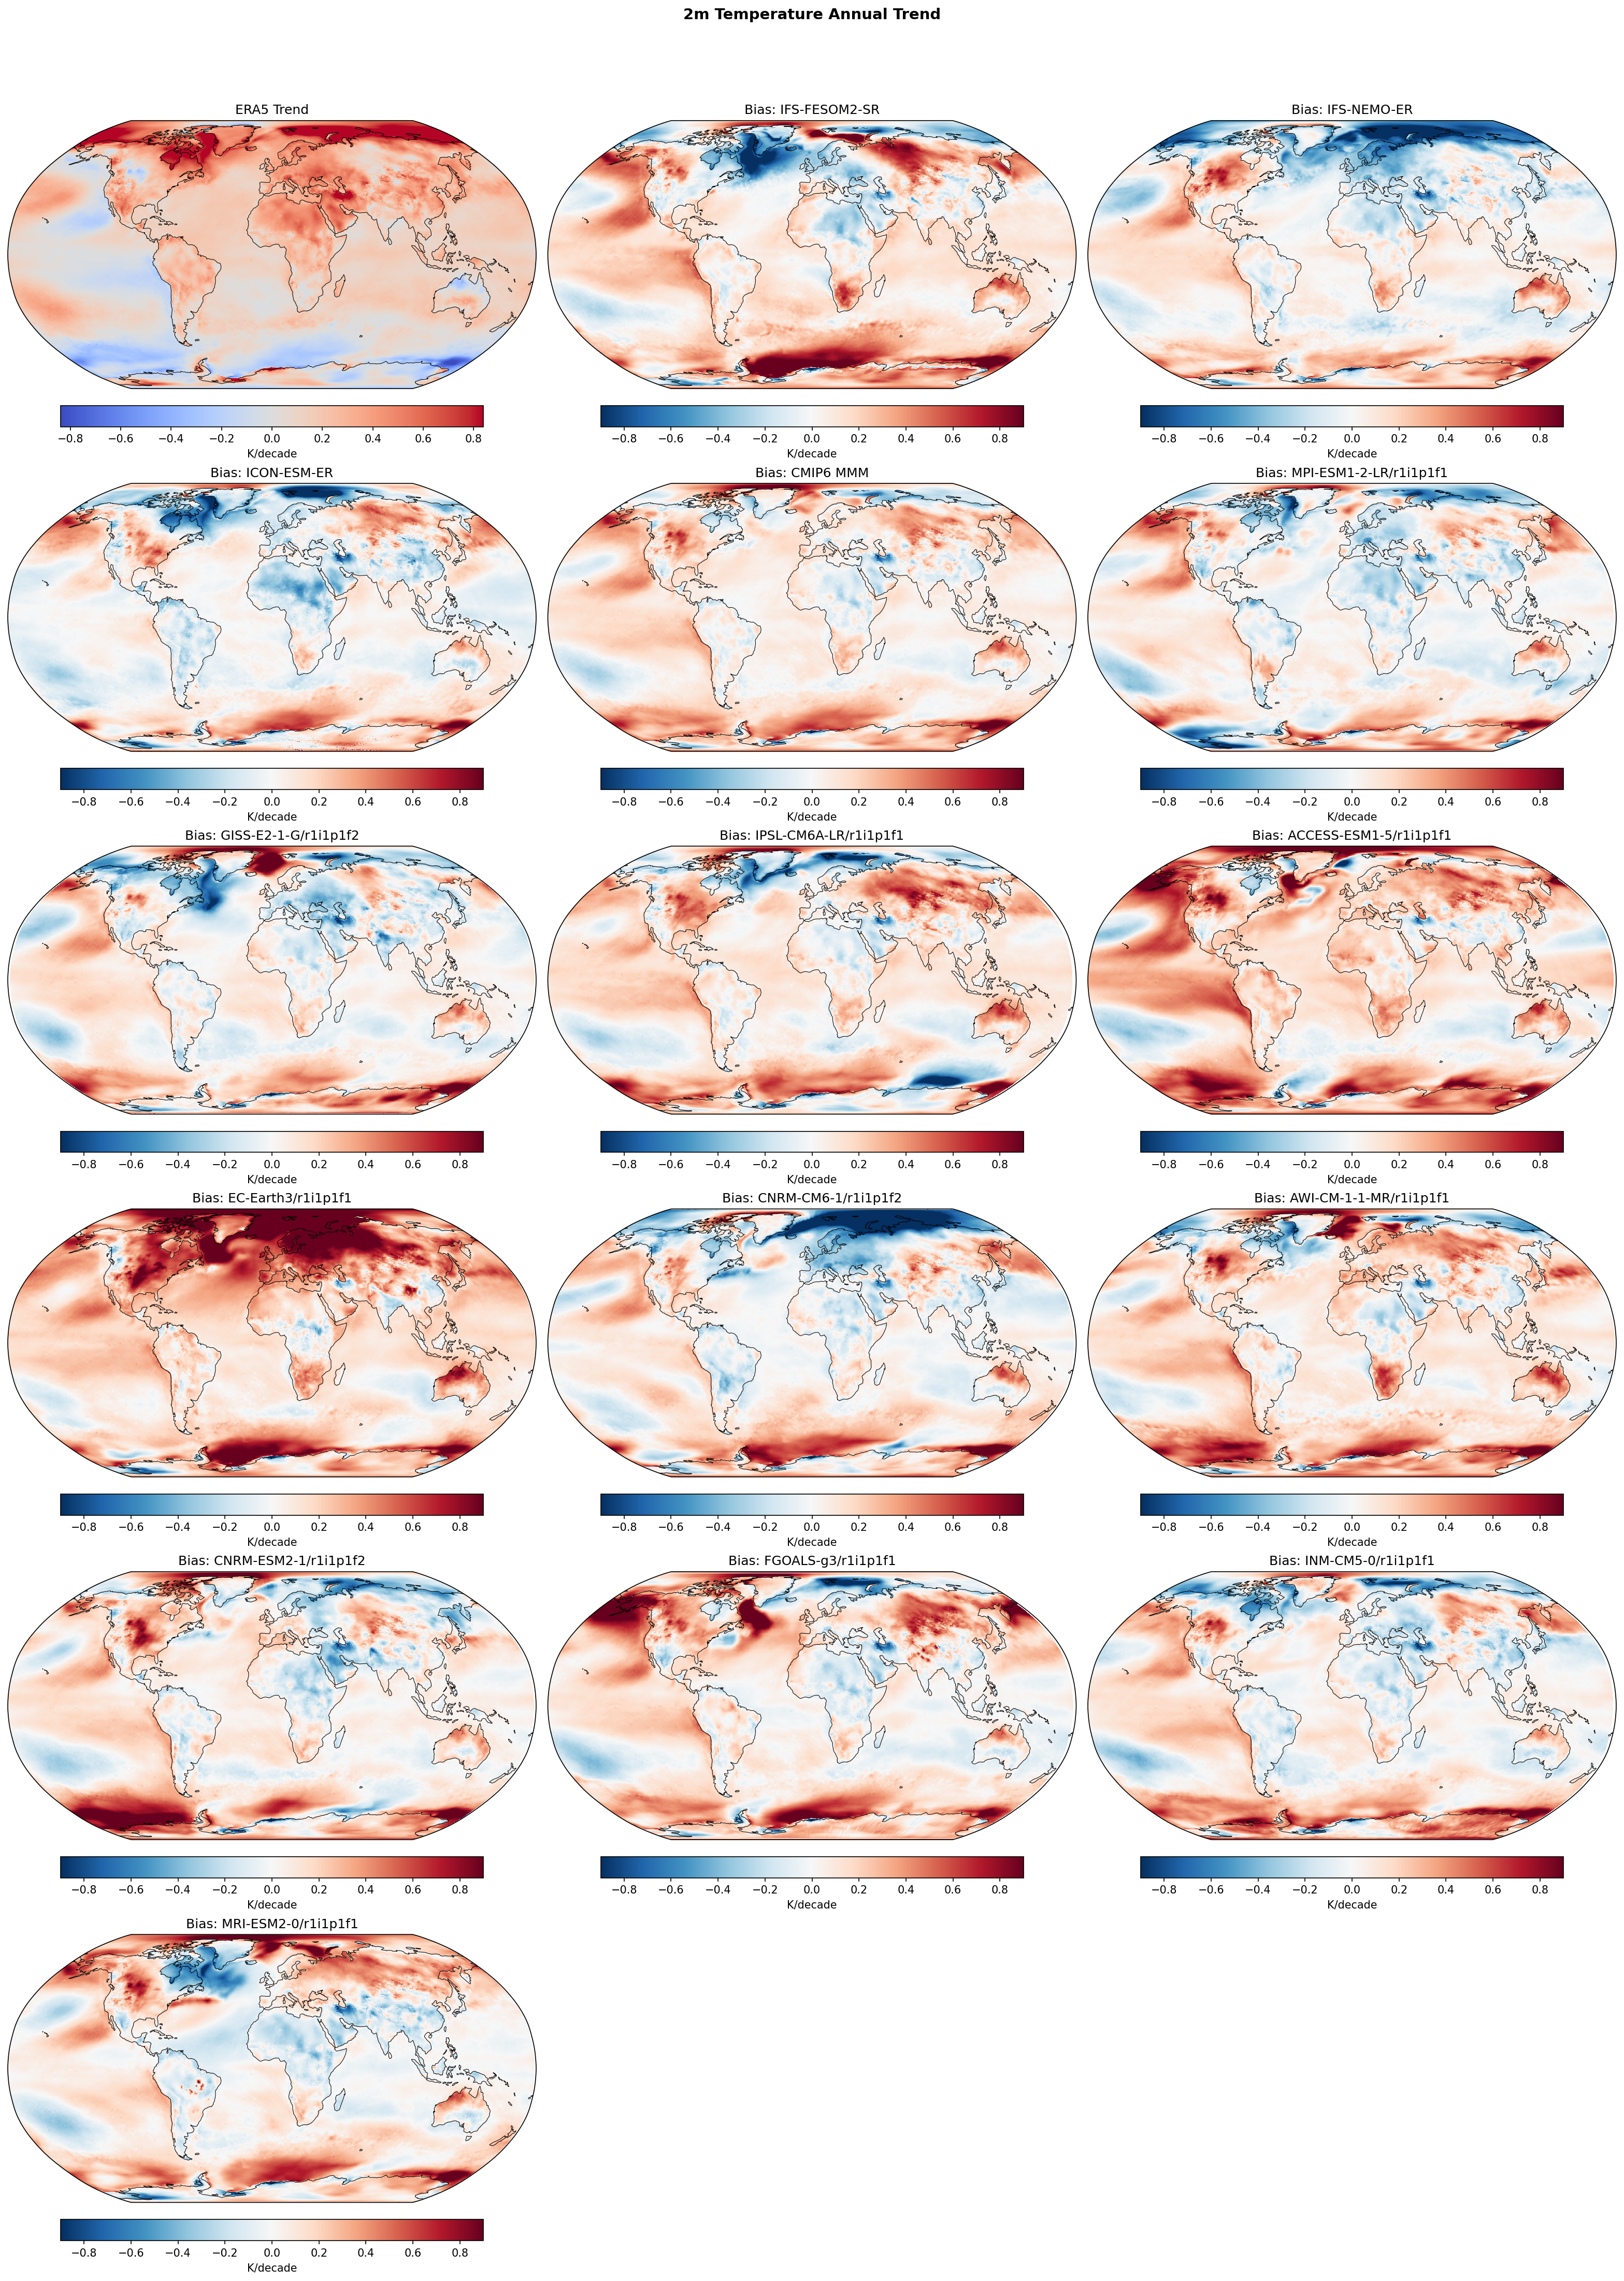
| Variables | tas |
|---|---|
| Models | IFS-FESOM2-SR, IFS-NEMO-ER, ICON-ESM-ER, HadGEM3-GC5, CMIP6 MMM, MPI-ESM1-2-LR/r1i1p1f1, GISS-E2-1-G/r1i1p1f2, IPSL-CM6A-LR/r1i1p1f1, ACCESS-ESM1-5/r1i1p1f1, EC-Earth3/r1i1p1f1, CNRM-CM6-1/r1i1p1f2, AWI-CM-1-1-MR/r1i1p1f1, CNRM-ESM2-1/r1i1p1f2, FGOALS-g3/r1i1p1f1, INM-CM5-0/r1i1p1f1, MRI-ESM2-0/r1i1p1f1 |
| Reference Dataset | ERA5 |
| Units | K/decade |
| Period | 1980–2014 |
| IFS-FESOM2-SR | Global Mean Trend: 0.27 · Global Mean Trend Diff: 0.12 · Trend Rmse: 0.27 |
| IFS-NEMO-ER | Global Mean Trend: 0.16 · Global Mean Trend Diff: 0.00 · Trend Rmse: 0.22 |
| ICON-ESM-ER | Global Mean Trend: 0.16 · Global Mean Trend Diff: 0.00 · Trend Rmse: 0.19 |
| HadGEM3-GC5 | Global Mean Trend: 0.31 · Global Mean Trend Diff: 0.16 · Trend Rmse: 0.29 |
| CMIP6 MMM | Global Mean Trend Diff: 0.09 · Trend Rmse: 0.19 |
| MPI-ESM1-2-LR/r1i1p1f1 | Global Mean Trend Diff: 0.02 · Trend Rmse: 0.18 |
| GISS-E2-1-G/r1i1p1f2 | Global Mean Trend Diff: 0.04 · Trend Rmse: 0.21 |
| IPSL-CM6A-LR/r1i1p1f1 | Global Mean Trend Diff: 0.10 · Trend Rmse: 0.23 |
| ACCESS-ESM1-5/r1i1p1f1 | Global Mean Trend Diff: 0.18 · Trend Rmse: 0.29 |
| EC-Earth3/r1i1p1f1 | Global Mean Trend Diff: 0.25 · Trend Rmse: 0.41 |
| CNRM-CM6-1/r1i1p1f2 | Global Mean Trend Diff: 0.02 · Trend Rmse: 0.28 |
| AWI-CM-1-1-MR/r1i1p1f1 | Global Mean Trend Diff: 0.13 · Trend Rmse: 0.24 |
| CNRM-ESM2-1/r1i1p1f2 | Global Mean Trend Diff: 0.08 · Trend Rmse: 0.23 |
| FGOALS-g3/r1i1p1f1 | Global Mean Trend Diff: 0.12 · Trend Rmse: 0.27 |
| INM-CM5-0/r1i1p1f1 | Global Mean Trend Diff: 0.05 · Trend Rmse: 0.21 |
| MRI-ESM2-0/r1i1p1f1 | Global Mean Trend Diff: 0.06 · Trend Rmse: 0.22 |
Summary high
This diagnostic compares 1980–2014 annual linear trends in 2m temperature from ERA5 reanalysis against four high-resolution EERIE models and a selection of CMIP6 models. While all models capture the sign of global warming, the EERIE models bifurcate: IFS-NEMO-ER and ICON-ESM-ER reproduce the observed warming rate with high accuracy, whereas IFS-FESOM2-SR and HadGEM3-GC5 significantly overestimate the global warming trend.
Key Findings
- ICON-ESM-ER and IFS-NEMO-ER show remarkable agreement with the observational global mean trend (bias ~0.005 K/decade), outperforming the CMIP6 Multi-Model Mean (bias ~0.095 K/decade) and achieving low spatial RMSE (~0.2 K/decade).
- HadGEM3-GC5 and IFS-FESOM2-SR exhibit strong positive trend biases (over-warming), with global rates 0.11–0.15 K/decade higher than observations, comparable to high-sensitivity CMIP6 models like EC-Earth3.
- A systematic 'red' bias exists in the Southern Ocean for many models (EC-Earth3, HadGEM3-GC5, ACCESS-ESM1-5), where models simulate warming despite ERA5 showing cooling or neutral trends; however, ICON-ESM-ER and IFS-NEMO-ER largely avoid this error.
Spatial Patterns
ERA5 shows strong Arctic amplification (>0.75 K/decade) and distinct cooling patches in the Southern Ocean and parts of the Pacific. The 'hot' models (HadGEM3-GC5, EC-Earth3) exaggerate Arctic warming further (intense red bias >0.5 K/decade in the polar cap) and fail to capture the Southern Ocean cooling. The North Atlantic 'warming hole' (observed weak/negative trend) is generally not well-resolved by the high-warming models, which tend to warm through this region.
Model Agreement
There is significant divergence among the high-resolution models. IFS-NEMO-ER and ICON-ESM-ER group with the moderate-warming CMIP6 models (e.g., MPI-ESM1-2-LR), while IFS-FESOM2-SR and HadGEM3-GC5 group with the high-warming CMIP6 models. The contrast between IFS-NEMO-ER (low bias) and IFS-FESOM2-SR (high bias) is particularly notable given they share the same atmospheric component, pointing to the ocean model's role in heat uptake.
Physical Interpretation
The excessive warming in HadGEM3-GC5 and EC-Earth3 is consistent with their known high Equilibrium Climate Sensitivity (ECS). The discrepancy between IFS-NEMO and IFS-FESOM suggests differences in ocean heat uptake efficiency; FESOM may be burying less heat or responding faster to forcing. The pervasive Southern Ocean warming bias in many models likely reflects difficulties in simulating the specific wind-driven overturning or sea-ice trends that have delayed warming in the real world.
Caveats
- The 35-year analysis period (1980-2014) is relatively short and subject to internal variability (e.g., IPO, AMO); single model realizations may not match the observed phasing of these modes, causing regional trend discrepancies.
- Biases in trends do not necessarily imply biases in mean state climatology, but rather in the transient response to forcing.
2m Temperature DJF Linear Trend
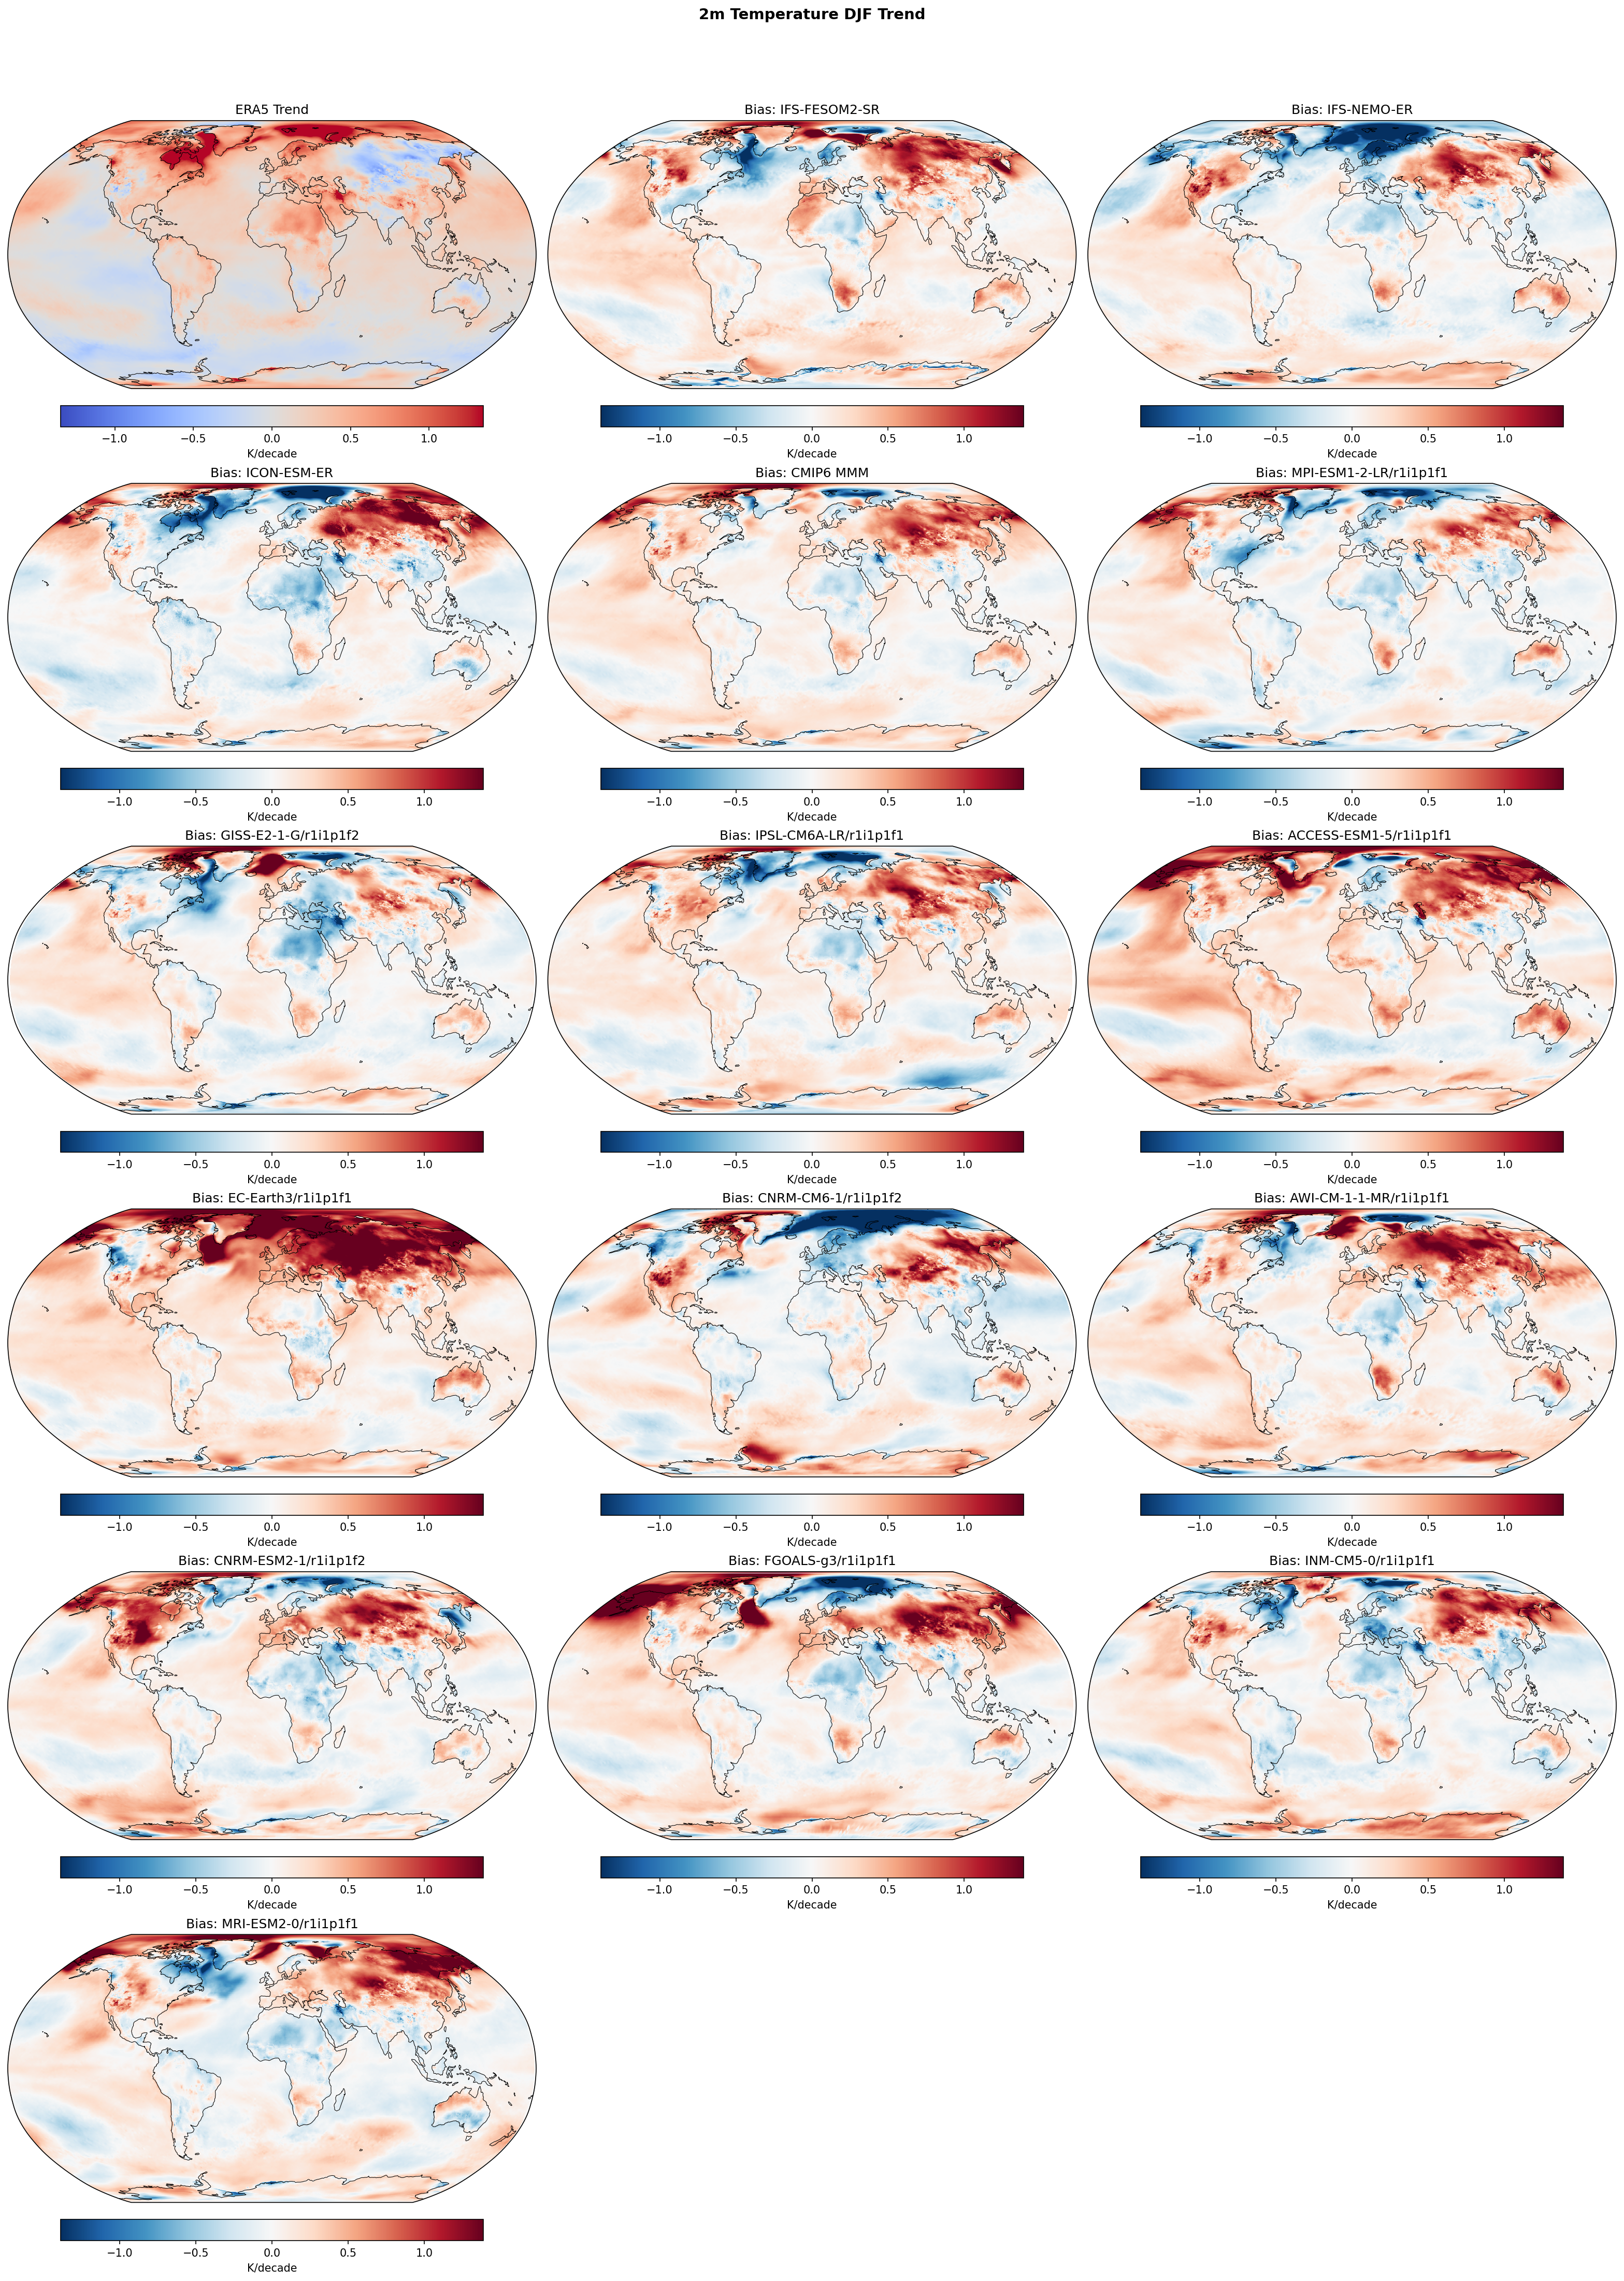
| Variables | tas |
|---|---|
| Models | IFS-FESOM2-SR, IFS-NEMO-ER, ICON-ESM-ER, HadGEM3-GC5, CMIP6 MMM, MPI-ESM1-2-LR/r1i1p1f1, GISS-E2-1-G/r1i1p1f2, IPSL-CM6A-LR/r1i1p1f1, ACCESS-ESM1-5/r1i1p1f1, EC-Earth3/r1i1p1f1, CNRM-CM6-1/r1i1p1f2, AWI-CM-1-1-MR/r1i1p1f1, CNRM-ESM2-1/r1i1p1f2, FGOALS-g3/r1i1p1f1, INM-CM5-0/r1i1p1f1, MRI-ESM2-0/r1i1p1f1 |
| Reference Dataset | ERA5 |
| Units | K/decade |
| Period | 1980–2014 |
| CMIP6 MMM | Global Mean Trend Diff: 0.11 · Trend Rmse: None |
| MPI-ESM1-2-LR/r1i1p1f1 | Global Mean Trend Diff: 0.03 · Trend Rmse: None |
| GISS-E2-1-G/r1i1p1f2 | Global Mean Trend Diff: 0.03 · Trend Rmse: None |
| IPSL-CM6A-LR/r1i1p1f1 | Global Mean Trend Diff: 0.08 · Trend Rmse: None |
| ACCESS-ESM1-5/r1i1p1f1 | Global Mean Trend Diff: 0.20 · Trend Rmse: None |
| EC-Earth3/r1i1p1f1 | Global Mean Trend Diff: 0.28 · Trend Rmse: None |
| CNRM-CM6-1/r1i1p1f2 | Global Mean Trend Diff: 0.03 · Trend Rmse: None |
| AWI-CM-1-1-MR/r1i1p1f1 | Global Mean Trend Diff: 0.14 · Trend Rmse: None |
| CNRM-ESM2-1/r1i1p1f2 | Global Mean Trend Diff: 0.10 · Trend Rmse: None |
| FGOALS-g3/r1i1p1f1 | Global Mean Trend Diff: 0.14 · Trend Rmse: None |
| INM-CM5-0/r1i1p1f1 | Global Mean Trend Diff: 0.06 · Trend Rmse: None |
| MRI-ESM2-0/r1i1p1f1 | Global Mean Trend Diff: 0.08 · Trend Rmse: None |
Summary high
This figure evaluates linear trends in winter (DJF) 2m temperature over the period 1980–2014, comparing ERA5 reanalysis with EERIE high-resolution models (IFS, ICON, HadGEM3) and a selection of CMIP6 models.
Key Findings
- Most models exhibit a widespread positive trend bias (red) in the Pacific Ocean, indicating they simulate warming trends where ERA5 observations show cooling (associated with the negative phase of the Interdecadal Pacific Oscillation).
- There is a systematic overestimation of Arctic warming (Arctic Amplification) in the models compared to ERA5, with HadGEM3-GC5 showing the most extreme positive bias in polar regions.
- IFS-FESOM2-SR, IFS-NEMO-ER, and ICON-ESM-ER display a distinct negative trend bias (blue) in the North Atlantic subpolar gyre, suggesting these models simulate a stronger 'warming hole' (cooling trend) than observed.
Spatial Patterns
ERA5 shows strong warming in the Arctic and Eurasia, but cooling in the Eastern Pacific and parts of the Southern Ocean. The model bias maps are dominated by positive values (over-warming) in the Arctic and Pacific. A notable exception is the North Atlantic, where the IFS and ICON models show a localized region of negative bias (cooling trend exceeding observations). HadGEM3-GC5 stands out with intense global warming trends, particularly at high latitudes in both hemispheres.
Model Agreement
There is high agreement across both EERIE and CMIP6 models regarding the sign of the bias in the Pacific (positive) and Arctic (positive). However, the magnitude varies, with HadGEM3-GC5 being a warm outlier. The EERIE models (IFS, ICON) align with the broader CMIP6 ensemble in failing to capture the specific spatial pattern of Pacific cooling, but they show a more pronounced North Atlantic cooling signal than the CMIP6 Multi-Model Mean.
Physical Interpretation
The widespread positive bias in the Pacific is likely due to the mismatch in internal variability phases; free-running coupled models do not synchronize with the observed 1980–2014 negative IPO/PDO phase and instead show the forced warming response. The excess Arctic warming suggests simulated sea-ice albedo feedbacks or surface fluxes may be too strong in winter. The North Atlantic cold bias in IFS/ICON models may indicate a stronger slowdown of the AMOC or deeper winter convection mixing than occurred in reality.
Caveats
- Trends are calculated over a relatively short 35-year period (1980–2014), which is heavily influenced by decadal internal variability (e.g., IPO), making it difficult to separate forced response errors from random phasing differences.
- HadGEM3-GC5's strong warming biases may be linked to its known high Equilibrium Climate Sensitivity (ECS).
2m Temperature JJA Linear Trend
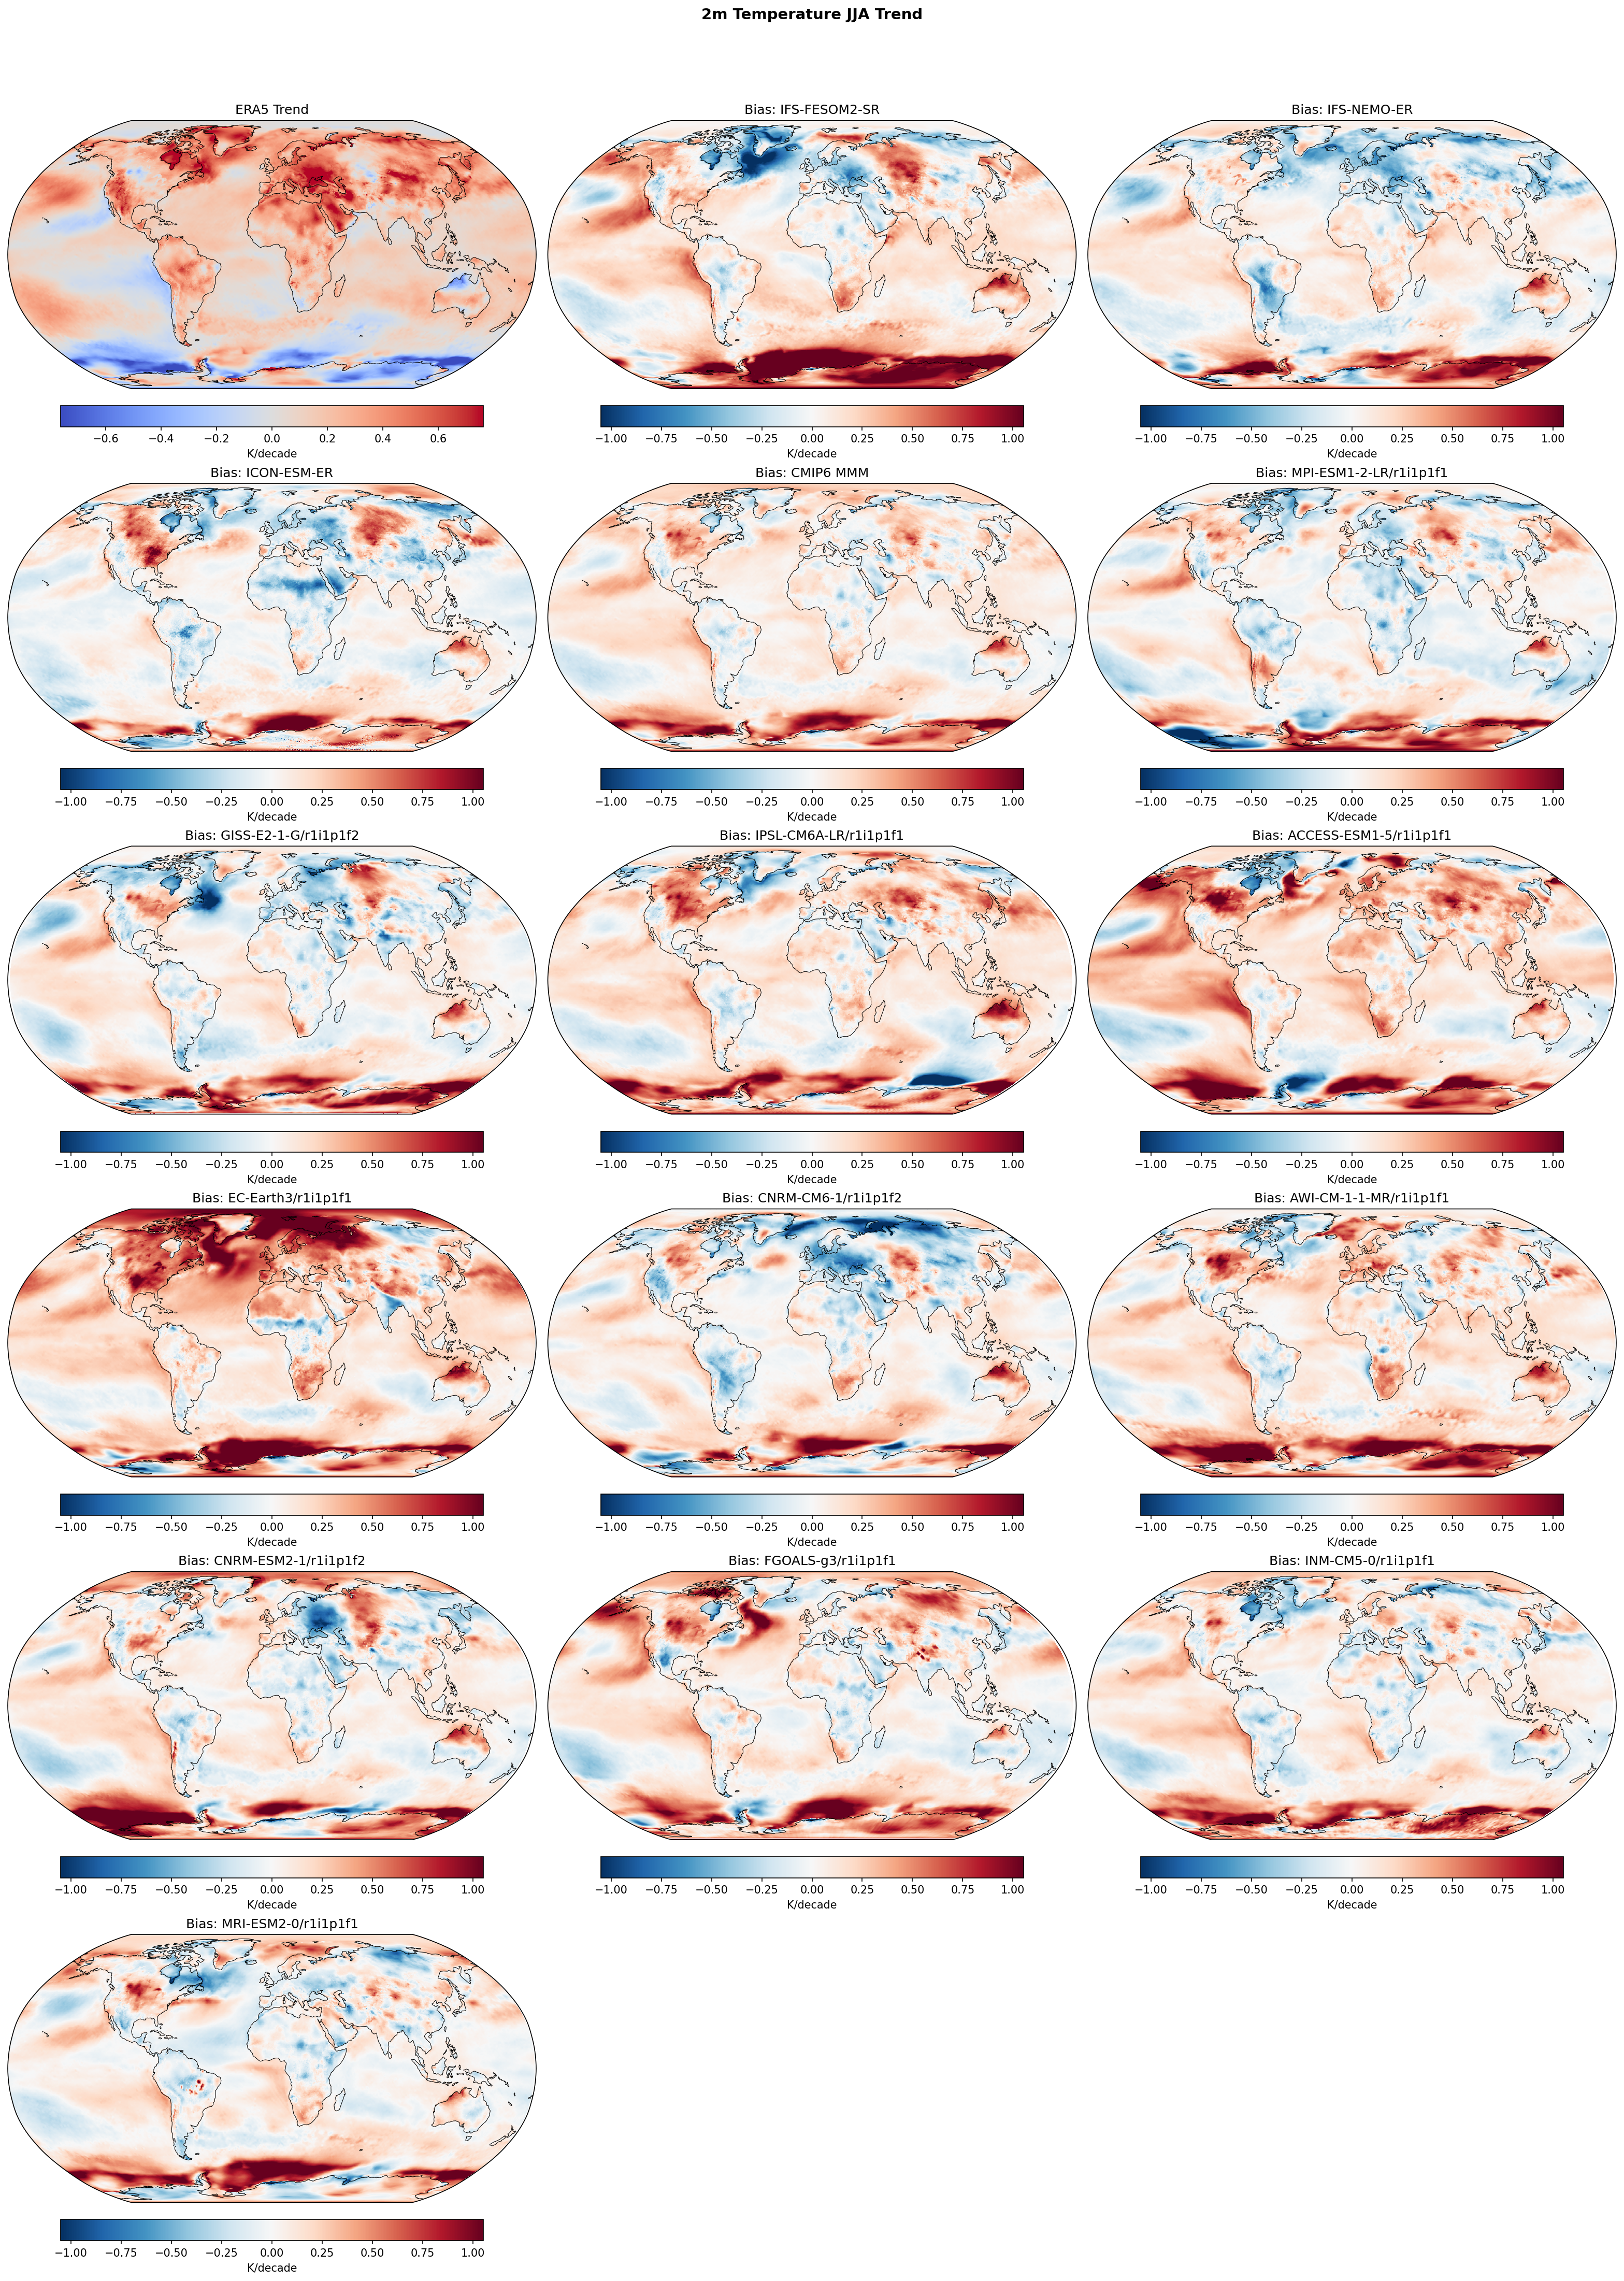
| Variables | tas |
|---|---|
| Models | IFS-FESOM2-SR, IFS-NEMO-ER, ICON-ESM-ER, HadGEM3-GC5, CMIP6 MMM, MPI-ESM1-2-LR/r1i1p1f1, GISS-E2-1-G/r1i1p1f2, IPSL-CM6A-LR/r1i1p1f1, ACCESS-ESM1-5/r1i1p1f1, EC-Earth3/r1i1p1f1, CNRM-CM6-1/r1i1p1f2, AWI-CM-1-1-MR/r1i1p1f1, CNRM-ESM2-1/r1i1p1f2, FGOALS-g3/r1i1p1f1, INM-CM5-0/r1i1p1f1, MRI-ESM2-0/r1i1p1f1 |
| Reference Dataset | ERA5 |
| Units | K/decade |
| Period | 1980–2014 |
| CMIP6 MMM | Global Mean Trend Diff: 0.10 · Trend Rmse: None |
| MPI-ESM1-2-LR/r1i1p1f1 | Global Mean Trend Diff: 0.03 · Trend Rmse: None |
| GISS-E2-1-G/r1i1p1f2 | Global Mean Trend Diff: 0.05 · Trend Rmse: None |
| IPSL-CM6A-LR/r1i1p1f1 | Global Mean Trend Diff: 0.12 · Trend Rmse: None |
| ACCESS-ESM1-5/r1i1p1f1 | Global Mean Trend Diff: 0.18 · Trend Rmse: None |
| EC-Earth3/r1i1p1f1 | Global Mean Trend Diff: 0.24 · Trend Rmse: None |
| CNRM-CM6-1/r1i1p1f2 | Global Mean Trend Diff: 0.04 · Trend Rmse: None |
| AWI-CM-1-1-MR/r1i1p1f1 | Global Mean Trend Diff: 0.14 · Trend Rmse: None |
| CNRM-ESM2-1/r1i1p1f2 | Global Mean Trend Diff: 0.09 · Trend Rmse: None |
| FGOALS-g3/r1i1p1f1 | Global Mean Trend Diff: 0.11 · Trend Rmse: None |
| INM-CM5-0/r1i1p1f1 | Global Mean Trend Diff: 0.07 · Trend Rmse: None |
| MRI-ESM2-0/r1i1p1f1 | Global Mean Trend Diff: 0.06 · Trend Rmse: None |
Summary high
This figure displays the linear trend in June-August (JJA) 2-meter temperature from 1980–2014, contrasting the ERA5 observational trend with the trend biases (model minus observation) of EERIE high-resolution models and a suite of CMIP6 models.
Key Findings
- Most models, including the high-resolution EERIE simulations (IFS-FESOM2-SR, HadGEM3-GC5), systematically overestimate warming trends (positive bias) in the polar regions, particularly the Arctic and Southern Ocean.
- HadGEM3-GC5 exhibits the most pronounced widespread warming bias among the EERIE models, similar to 'hot' CMIP6 models like ACCESS-ESM1-5 and EC-Earth3, with excessive warming trends over Northern Hemisphere land masses.
- The Southern Ocean stands out as a region of strong disagreement: ERA5 shows neutral or cooling trends, while almost all models simulate significant warming (red bias), indicating a failure to capture observed delayed warming in this region.
Spatial Patterns
ERA5 shows moderate warming over NH land and the Arctic, but cooling patches in the Southern Ocean. In contrast, model bias maps are dominated by red (positive trend difference) in the sea-ice zones of both hemispheres. The North Atlantic 'warming hole' is visible as a blue bias in several models (e.g., IFS-FESOM2-SR, ICON-ESM-ER), suggesting these models may simulate a stronger cooling trend or weaker warming than observed in this specific region.
Model Agreement
There is broad inter-model agreement on the sign of the bias in high latitudes (warming too fast). The high-resolution EERIE models do not distinctively outperform the standard CMIP6 ensemble regarding these trend biases. Low-sensitivity models like MPI-ESM1-2-LR and INM-CM5-0 show much smaller global trend biases (paler maps) compared to high-sensitivity models like ACCESS-ESM1-5.
Physical Interpretation
The positive trend bias in the JJA Arctic likely stems from sea ice-albedo feedbacks; while real-world temperatures are pinned near 0°C by melting ice, models retreating ice too fast allow temperatures to rise significantly. The pervasive Southern Ocean warming bias suggests models fail to represent the specific ocean dynamics (e.g., upwelling of deep, cold water or freshwater stratification) that have historically dampened surface warming in that region.
Caveats
- JJA temperatures in the Arctic are strongly constrained by the freezing point; trend biases here may reflect differences in sea ice cover transitions rather than pure atmospheric sensitivity.
- The 1980–2014 period is relatively short, making trends sensitive to decadal variability (e.g., IPO, AMO) which coupled models are not expected to phase-match with observations.
10m U Wind Annual Linear Trend
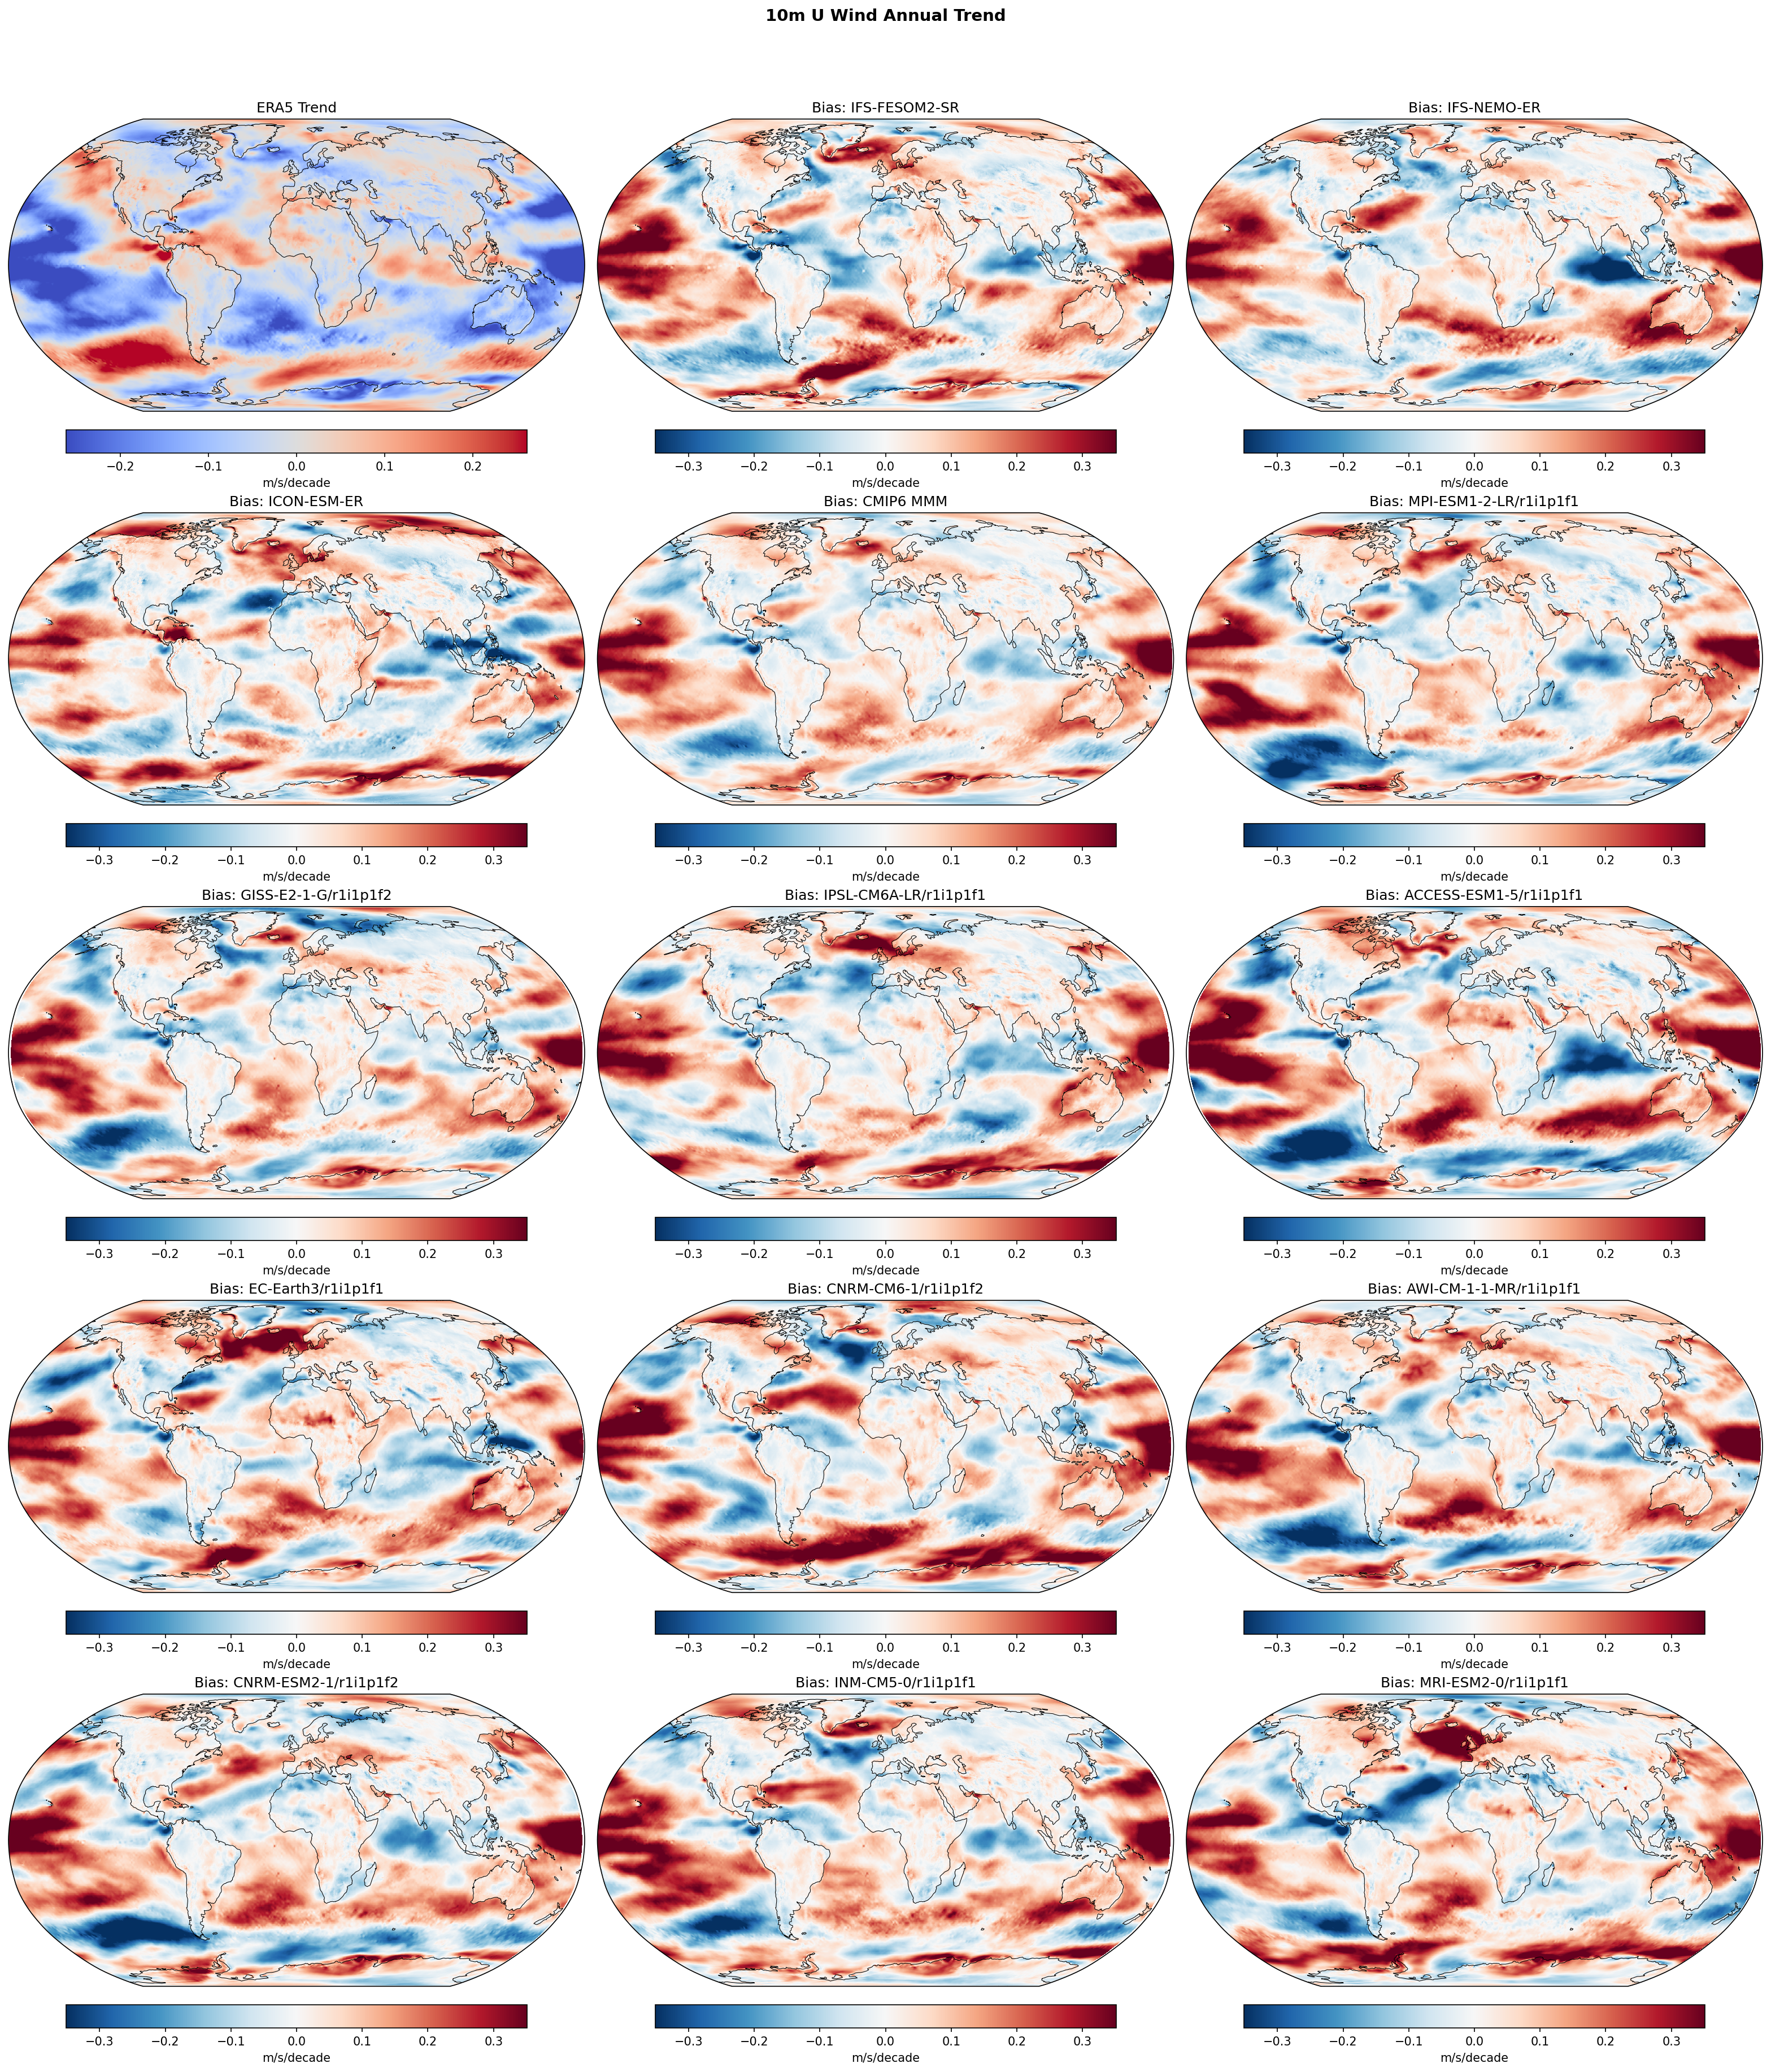
| Variables | uas |
|---|---|
| Models | IFS-FESOM2-SR, IFS-NEMO-ER, ICON-ESM-ER, HadGEM3-GC5, CMIP6 MMM, MPI-ESM1-2-LR/r1i1p1f1, GISS-E2-1-G/r1i1p1f2, IPSL-CM6A-LR/r1i1p1f1, ACCESS-ESM1-5/r1i1p1f1, EC-Earth3/r1i1p1f1, CNRM-CM6-1/r1i1p1f2, AWI-CM-1-1-MR/r1i1p1f1, CNRM-ESM2-1/r1i1p1f2, INM-CM5-0/r1i1p1f1, MRI-ESM2-0/r1i1p1f1 |
| Reference Dataset | ERA5 |
| Units | m/s/decade |
| Period | 1980–2014 |
| IFS-FESOM2-SR | Global Mean Trend: 0.01 · Global Mean Trend Diff: 0.04 · Trend Rmse: 0.13 |
| IFS-NEMO-ER | Global Mean Trend: -0.00 · Global Mean Trend Diff: 0.03 · Trend Rmse: 0.13 |
| ICON-ESM-ER | Global Mean Trend: -0.01 · Global Mean Trend Diff: 0.02 · Trend Rmse: 0.12 |
| HadGEM3-GC5 | Global Mean Trend: -0.00 · Global Mean Trend Diff: 0.03 · Trend Rmse: 0.14 |
| CMIP6 MMM | Global Mean Trend Diff: 0.03 · Trend Rmse: 0.11 |
| MPI-ESM1-2-LR/r1i1p1f1 | Global Mean Trend Diff: 0.03 · Trend Rmse: 0.13 |
| GISS-E2-1-G/r1i1p1f2 | Global Mean Trend Diff: 0.03 · Trend Rmse: 0.12 |
| IPSL-CM6A-LR/r1i1p1f1 | Global Mean Trend Diff: 0.03 · Trend Rmse: 0.13 |
| ACCESS-ESM1-5/r1i1p1f1 | Global Mean Trend Diff: 0.04 · Trend Rmse: 0.17 |
| EC-Earth3/r1i1p1f1 | Global Mean Trend Diff: 0.04 · Trend Rmse: 0.13 |
| CNRM-CM6-1/r1i1p1f2 | Global Mean Trend Diff: 0.05 · Trend Rmse: 0.15 |
| AWI-CM-1-1-MR/r1i1p1f1 | Global Mean Trend Diff: 0.03 · Trend Rmse: 0.14 |
| CNRM-ESM2-1/r1i1p1f2 | Global Mean Trend Diff: 0.03 · Trend Rmse: 0.14 |
| INM-CM5-0/r1i1p1f1 | Global Mean Trend Diff: 0.05 · Trend Rmse: 0.14 |
| MRI-ESM2-0/r1i1p1f1 | Global Mean Trend Diff: 0.03 · Trend Rmse: 0.14 |
Summary high
This figure evaluates annual linear trends in 10m zonal wind (1980–2014) from high-resolution EERIE simulations and CMIP6 models against ERA5 reanalysis. The dominant feature is a systematic, widespread failure across all models to capture the observed strengthening of the Pacific trade winds, resulting in a large positive trend bias in the tropics.
Key Findings
- Systematic Tropical Pacific Mismatch: ERA5 shows a strong negative trend (strengthening easterlies) in the equatorial Pacific, while all models (EERIE and CMIP6) exhibit a prominent positive bias (red), indicating they simulate weakening or stable trade winds instead of the observed intensification.
- Model Performance: Among the EERIE high-resolution models, ICON-ESM-ER achieves the lowest global trend RMSE (0.12), outperforming IFS-FESOM2-SR and HadGEM3-GC5 and matching the better-performing individual CMIP6 members.
- Southern Ocean Trends: ERA5 displays strengthening westerlies (positive trend) associated with the Southern Annular Mode. Models show mixed success; HadGEM3-GC5 exhibits strong dipole biases in the Southern Ocean sector, while the IFS variants show a broader positive bias difference relative to observations.
Spatial Patterns
The observational trend is characterized by a La Niña-like cooling pattern (strengthened easterlies) in the Pacific and strengthened westerlies in the Southern Ocean. The model bias maps are uniformly dominated by a coherent 'El Niño-like' positive difference in the Tropical Pacific, masking other regional discrepancies.
Model Agreement
There is high inter-model agreement regarding the Tropical Pacific error, with every simulation showing the same sign of bias. Disagreement is higher in the high latitudes; for instance, trends in the North Atlantic and Southern Ocean vary significantly in structure between ICON, IFS, and HadGEM3 configurations.
Physical Interpretation
The discrepancy is likely driven by internal climate variability: the observed period (1980–2014) coincided with a negative phase of the Interdecadal Pacific Oscillation (IPO), characterized by strengthening trade winds. Free-running coupled models do not synchronize with observed internal modes and often predict a GHG-forced weakening of the Walker circulation, exacerbating the trend difference.
Caveats
- The 35-year analysis period is dominated by multi-decadal internal variability (IPO), which uninitialized coupled models are not expected to reproduce in phase with observations.
- Biases shown are differences in linear trends (m/s/decade), not errors in the mean climatological state.
10m U Wind DJF Linear Trend
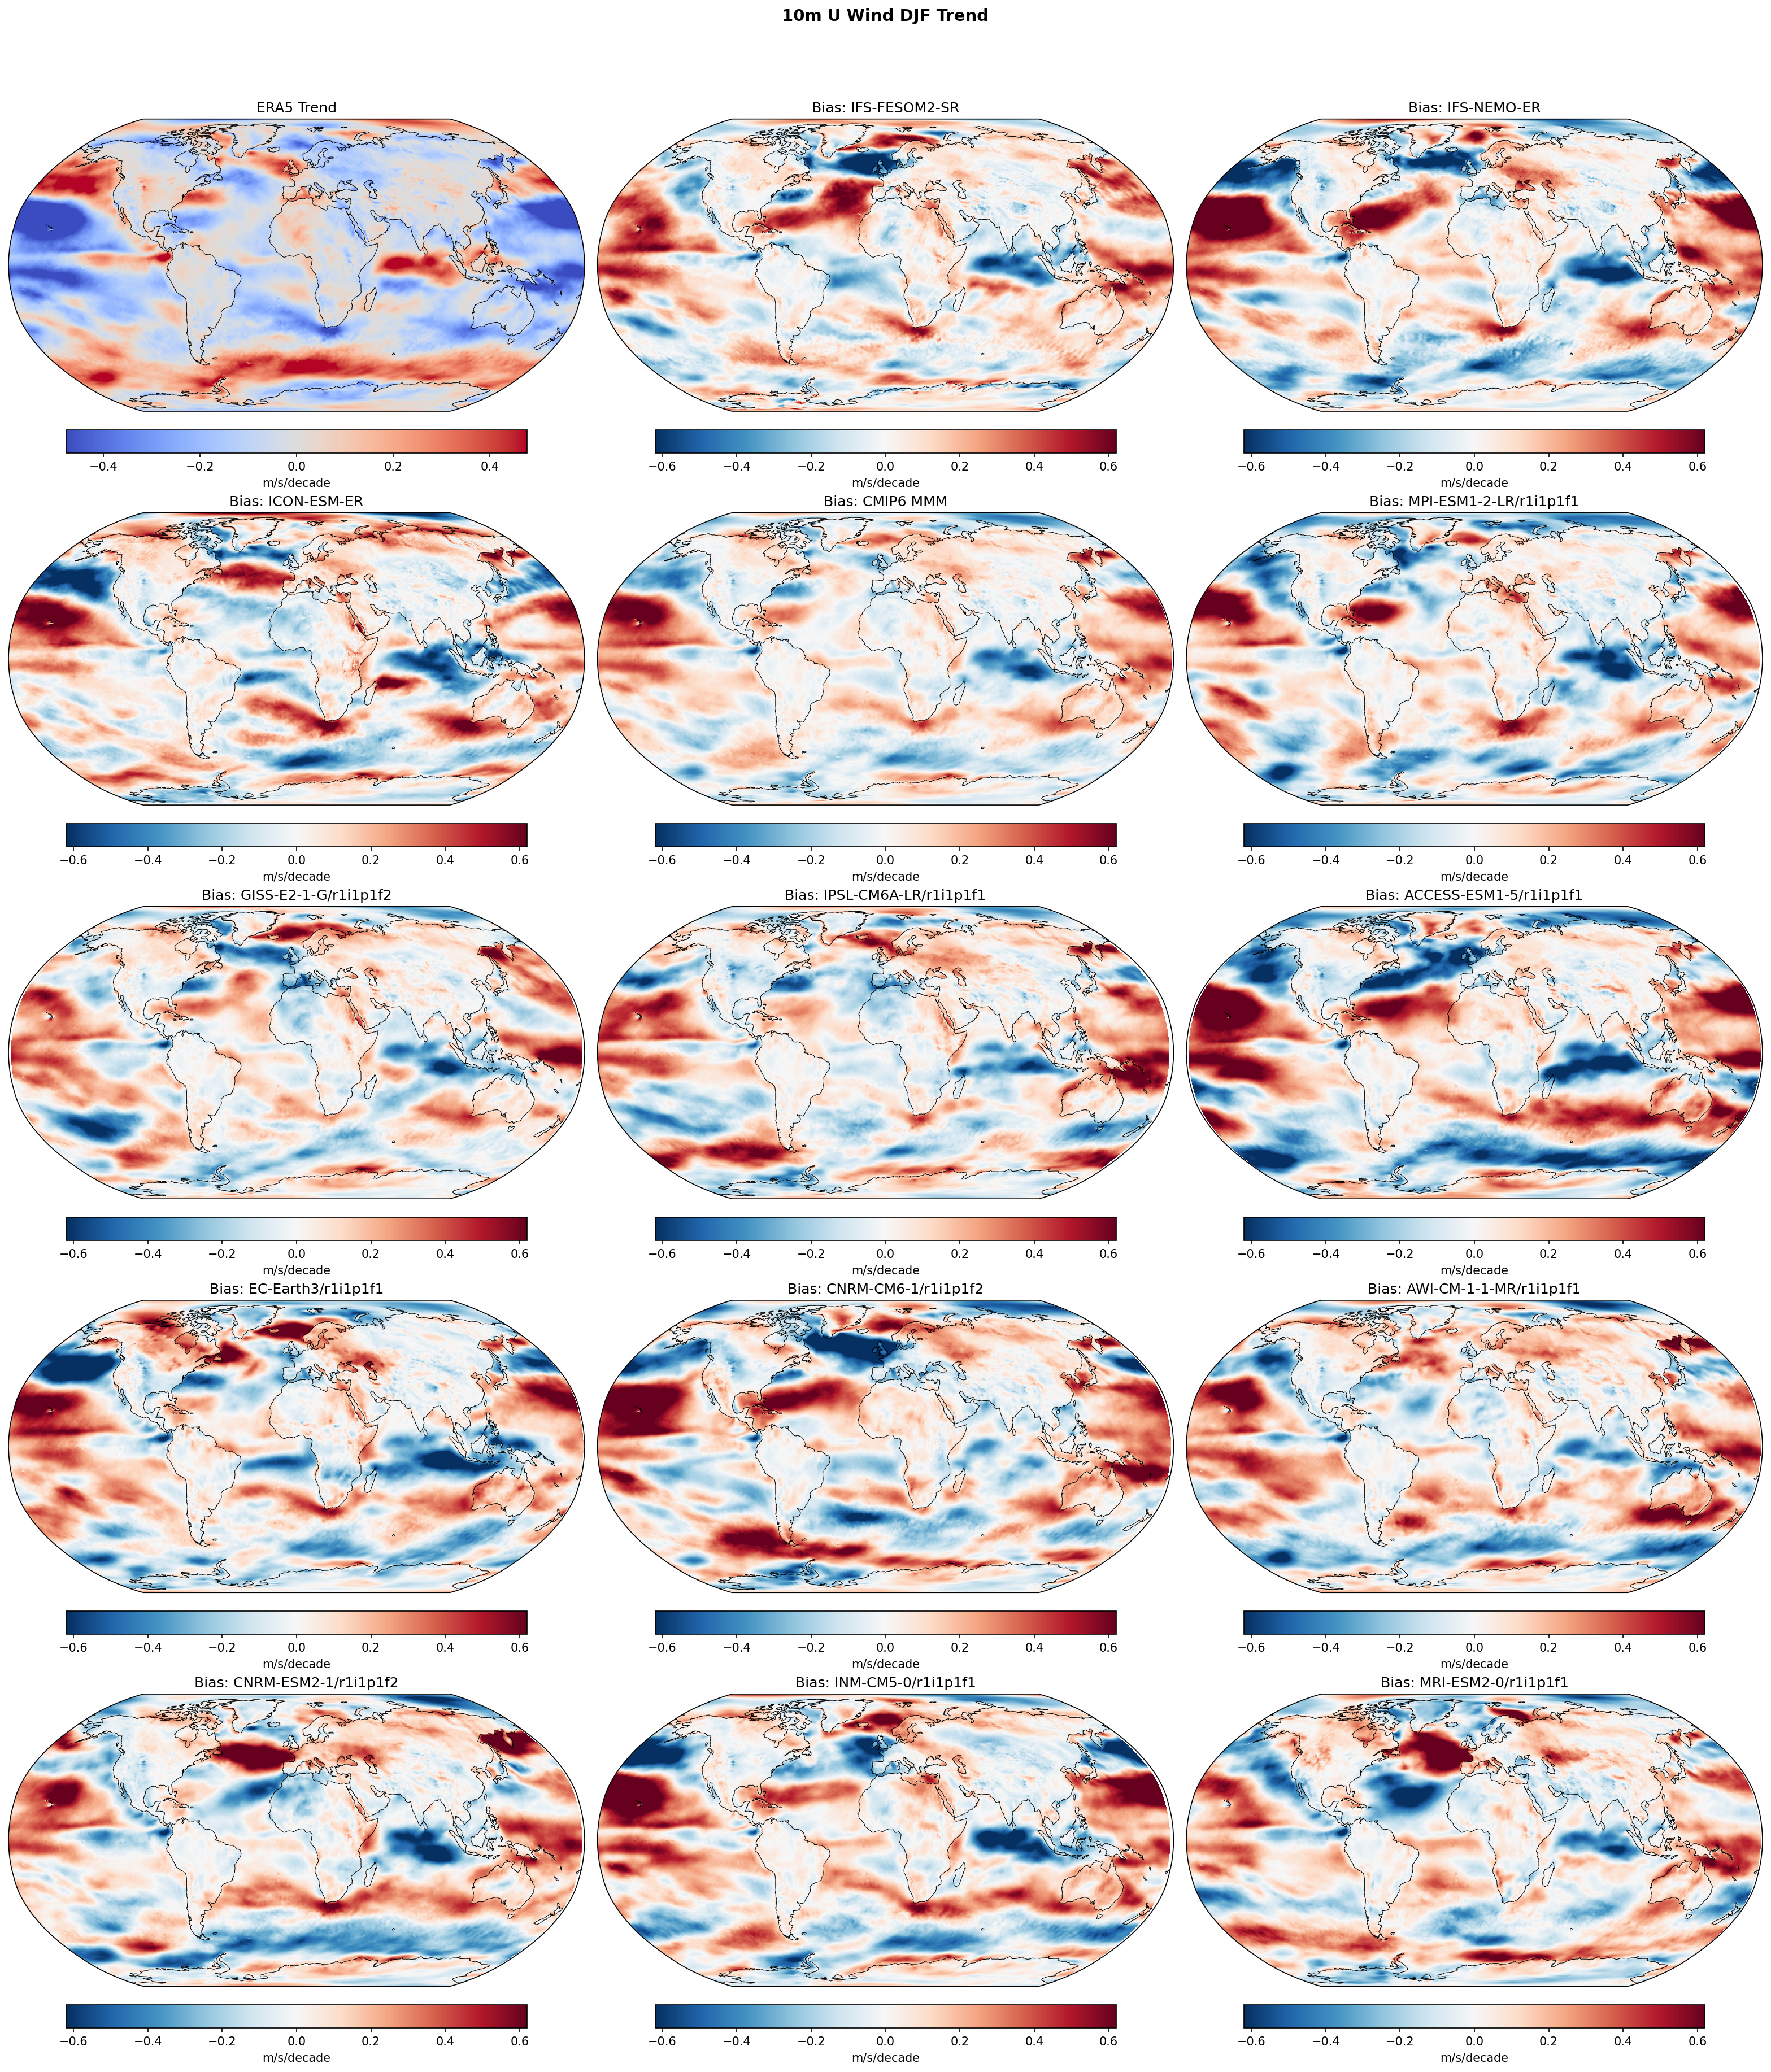
| Variables | uas |
|---|---|
| Models | IFS-FESOM2-SR, IFS-NEMO-ER, ICON-ESM-ER, HadGEM3-GC5, CMIP6 MMM, MPI-ESM1-2-LR/r1i1p1f1, GISS-E2-1-G/r1i1p1f2, IPSL-CM6A-LR/r1i1p1f1, ACCESS-ESM1-5/r1i1p1f1, EC-Earth3/r1i1p1f1, CNRM-CM6-1/r1i1p1f2, AWI-CM-1-1-MR/r1i1p1f1, CNRM-ESM2-1/r1i1p1f2, INM-CM5-0/r1i1p1f1, MRI-ESM2-0/r1i1p1f1 |
| Reference Dataset | ERA5 |
| Units | m/s/decade |
| Period | 1980–2014 |
| CMIP6 MMM | Global Mean Trend Diff: 0.03 · Trend Rmse: None |
| MPI-ESM1-2-LR/r1i1p1f1 | Global Mean Trend Diff: 0.01 · Trend Rmse: None |
| GISS-E2-1-G/r1i1p1f2 | Global Mean Trend Diff: 0.03 · Trend Rmse: None |
| IPSL-CM6A-LR/r1i1p1f1 | Global Mean Trend Diff: 0.03 · Trend Rmse: None |
| ACCESS-ESM1-5/r1i1p1f1 | Global Mean Trend Diff: 0.03 · Trend Rmse: None |
| EC-Earth3/r1i1p1f1 | Global Mean Trend Diff: 0.02 · Trend Rmse: None |
| CNRM-CM6-1/r1i1p1f2 | Global Mean Trend Diff: 0.06 · Trend Rmse: None |
| AWI-CM-1-1-MR/r1i1p1f1 | Global Mean Trend Diff: 0.04 · Trend Rmse: None |
| CNRM-ESM2-1/r1i1p1f2 | Global Mean Trend Diff: 0.03 · Trend Rmse: None |
| INM-CM5-0/r1i1p1f1 | Global Mean Trend Diff: 0.05 · Trend Rmse: None |
| MRI-ESM2-0/r1i1p1f1 | Global Mean Trend Diff: 0.03 · Trend Rmse: None |
Summary high
This figure compares the linear trend in DJF 10m zonal wind (U) over 1980–2014 between ERA5 observations and a suite of high-resolution (EERIE) and CMIP6 models. The most prominent feature is a systematic discrepancy in the tropical Pacific, where models fail to capture the observed strengthening of the easterly trade winds.
Key Findings
- ERA5 displays a strengthening of the Pacific Walker circulation (negative U trend/stronger easterlies in the central/east Pacific) and strengthening westerlies in the North Atlantic and Southern Ocean, consistent with La Niña-like cooling and positive NAM/SAM trends.
- Nearly all models, including the high-resolution EERIE simulations (IFS, ICON, HadGEM3) and the CMIP6 MMM, exhibit a widespread positive trend bias (red) in the tropical Pacific. This indicates they simulate weakening trades or fail to capture the magnitude of the observed strengthening.
- ICON-ESM-ER and IFS-NEMO-ER show negative trend biases in the North Atlantic storm track region, suggesting they underestimate the observed strengthening of westerlies (positive NAO trend) relative to ERA5.
- In the Southern Ocean, models show mixed bias patterns, with ICON-ESM-ER displaying a notable negative bias (blue) south of Australia, contrasting with the generally positive biases seen in other regions or models.
Spatial Patterns
ERA5 shows a distinct La Niña-like trend pattern (negative U trends in the tropical Pacific) and positive trends in the mid-latitude storm tracks. The model bias maps are dominated by a large-scale positive bias in the tropical Pacific, effectively cancelling out the observed negative trend. High-latitude biases are more regionally heterogeneous.
Model Agreement
There is high inter-model agreement regarding the sign of the error in the tropical Pacific; the systematic positive bias is present in the CMIP6 Multi-Model Mean and almost all individual models (both standard and high resolution). This suggests a shared deficiency in capturing the recent historical evolution of tropical atmospheric circulation.
Physical Interpretation
The systematic Pacific bias likely reflects the 'pattern effect' or the discrepancy between the observed La Niña-like SST trends (strengthening trades) and the model-simulated response to historical forcing, which tends to be more El Niño-like (weakening trades) or spatially uniform. The mismatch may stem from internal variability (e.g., IPO phasing) not synchronized in free-running coupled models, or errors in forcing/response sensitivity.
Caveats
- Trends are calculated over a relatively short 35-year period (1980-2014), making them highly sensitive to multi-decadal internal variability (e.g., IPO, AMO).
- Model-observation differences in trends do not necessarily imply model structural error if the observed trend is dominated by internal variability phases not constrained in the models.
10m U Wind JJA Linear Trend
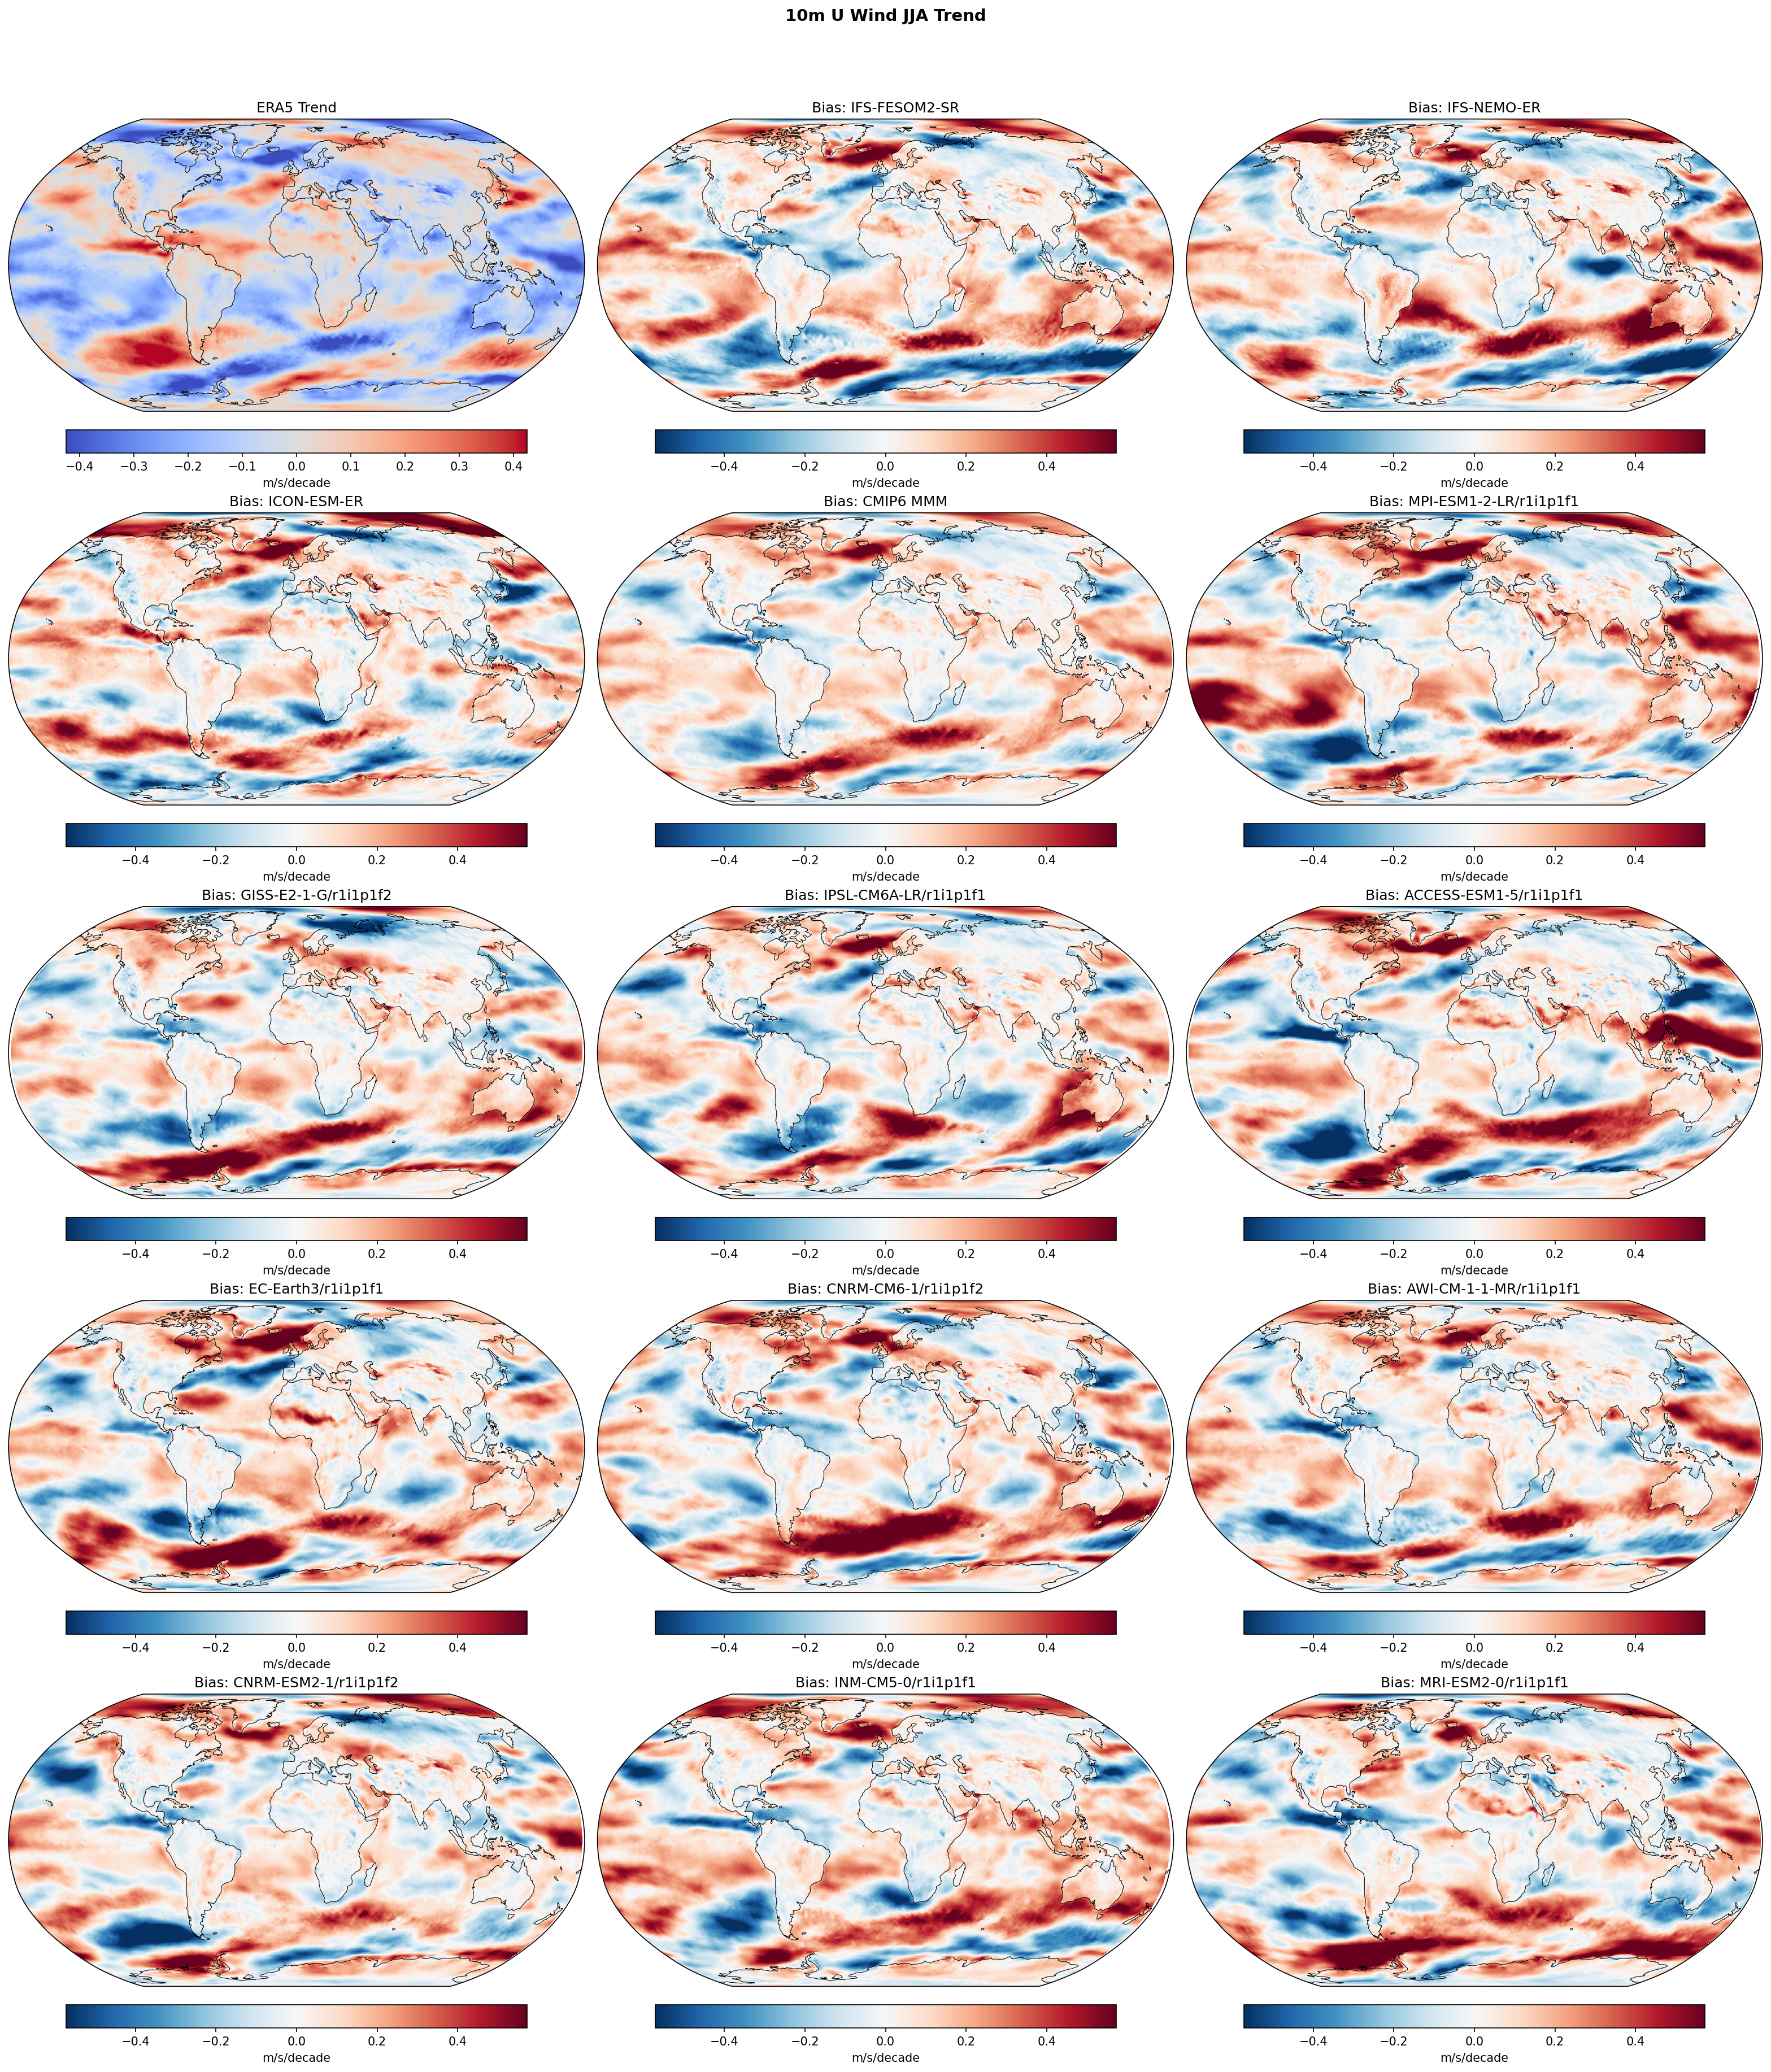
| Variables | uas |
|---|---|
| Models | IFS-FESOM2-SR, IFS-NEMO-ER, ICON-ESM-ER, HadGEM3-GC5, CMIP6 MMM, MPI-ESM1-2-LR/r1i1p1f1, GISS-E2-1-G/r1i1p1f2, IPSL-CM6A-LR/r1i1p1f1, ACCESS-ESM1-5/r1i1p1f1, EC-Earth3/r1i1p1f1, CNRM-CM6-1/r1i1p1f2, AWI-CM-1-1-MR/r1i1p1f1, CNRM-ESM2-1/r1i1p1f2, INM-CM5-0/r1i1p1f1, MRI-ESM2-0/r1i1p1f1 |
| Reference Dataset | ERA5 |
| Units | m/s/decade |
| Period | 1980–2014 |
| CMIP6 MMM | Global Mean Trend Diff: 0.04 · Trend Rmse: None |
| MPI-ESM1-2-LR/r1i1p1f1 | Global Mean Trend Diff: 0.05 · Trend Rmse: None |
| GISS-E2-1-G/r1i1p1f2 | Global Mean Trend Diff: 0.04 · Trend Rmse: None |
| IPSL-CM6A-LR/r1i1p1f1 | Global Mean Trend Diff: 0.03 · Trend Rmse: None |
| ACCESS-ESM1-5/r1i1p1f1 | Global Mean Trend Diff: 0.04 · Trend Rmse: None |
| EC-Earth3/r1i1p1f1 | Global Mean Trend Diff: 0.05 · Trend Rmse: None |
| CNRM-CM6-1/r1i1p1f2 | Global Mean Trend Diff: 0.05 · Trend Rmse: None |
| AWI-CM-1-1-MR/r1i1p1f1 | Global Mean Trend Diff: 0.04 · Trend Rmse: None |
| CNRM-ESM2-1/r1i1p1f2 | Global Mean Trend Diff: 0.03 · Trend Rmse: None |
| INM-CM5-0/r1i1p1f1 | Global Mean Trend Diff: 0.06 · Trend Rmse: None |
| MRI-ESM2-0/r1i1p1f1 | Global Mean Trend Diff: 0.04 · Trend Rmse: None |
Summary high
This figure evaluates linear trends in JJA 10m zonal wind (U-component) over 1980–2014, comparing high-resolution EERIE models and CMIP6 models against ERA5 reanalysis.
Key Findings
- Systematic discrepancy in the Tropical Pacific: ERA5 shows a strong trend of strengthening easterlies (negative values), while almost all models exhibit a positive bias (red), indicating a failure to capture this strengthening.
- Southern Hemisphere westerly jet trends show significant structural mismatches; IFS variants (NEMO/FESOM) show positive biases in the mid-latitudes (~40°S–50°S) and negative biases poleward, suggesting a trend that is equatorward of the observed intensification.
- HadGEM3-GC5 displays a distinct dipole bias in the Southern Ocean with excessive westerly acceleration at very high latitudes (>60°S) compared to ERA5.
- High-resolution models (IFS, ICON, HadGEM3) do not alleviate the Tropical Pacific trend bias found in standard CMIP6 models.
Spatial Patterns
The observational panel (ERA5) is characterized by strengthening easterlies (blue) in the equatorial Pacific and strengthening westerlies (red) in the Southern Ocean (approx. 55°S–60°S). The bias maps are dominated by a large 'red' pattern in the Tropical Pacific, representing the model-observation difference where models lack the observed easterly intensification. In the Southern Hemisphere, biases appear as zonal bands, indicating shifts in the latitude of the westerly jet trends.
Model Agreement
There is high inter-model agreement regarding the sign of the bias in the Tropical Pacific; virtually every model (high-res and CMIP6) misses the magnitude of the observed trade wind strengthening. Disagreement is higher in the Southern Ocean, where IFS models and HadGEM3-GC5 show opposing latitudinal bias patterns (equatorward vs poleward shift of the trend).
Physical Interpretation
The widespread positive bias in the Tropical Pacific indicates that coupled models fail to reproduce the observed strengthening of the Walker Circulation and trade winds during this period (often associated with the negative phase of the Interdecadal Pacific Oscillation). This is a known issue in climate modelling that affects ocean heat uptake and transient climate sensitivity. The zonal banding in the Southern Hemisphere biases reflects errors in the latitudinal position or shift of the eddy-driven jet stream response to external forcing (e.g., ozone recovery, GHGs) or internal variability.
Caveats
- Trends over short periods (35 years) in coupled models are heavily influenced by internal climate variability (e.g., IPO/PDO phases). Mismatch with observations may result from random phasing differences rather than purely systematic model physics errors.
- Biases are shown as 'Model minus Obs trend', so a positive bias in a region of negative observed trend (like the Pacific trades) implies the model trend is either weaker, zero, or positive.
10m V Wind Annual Linear Trend
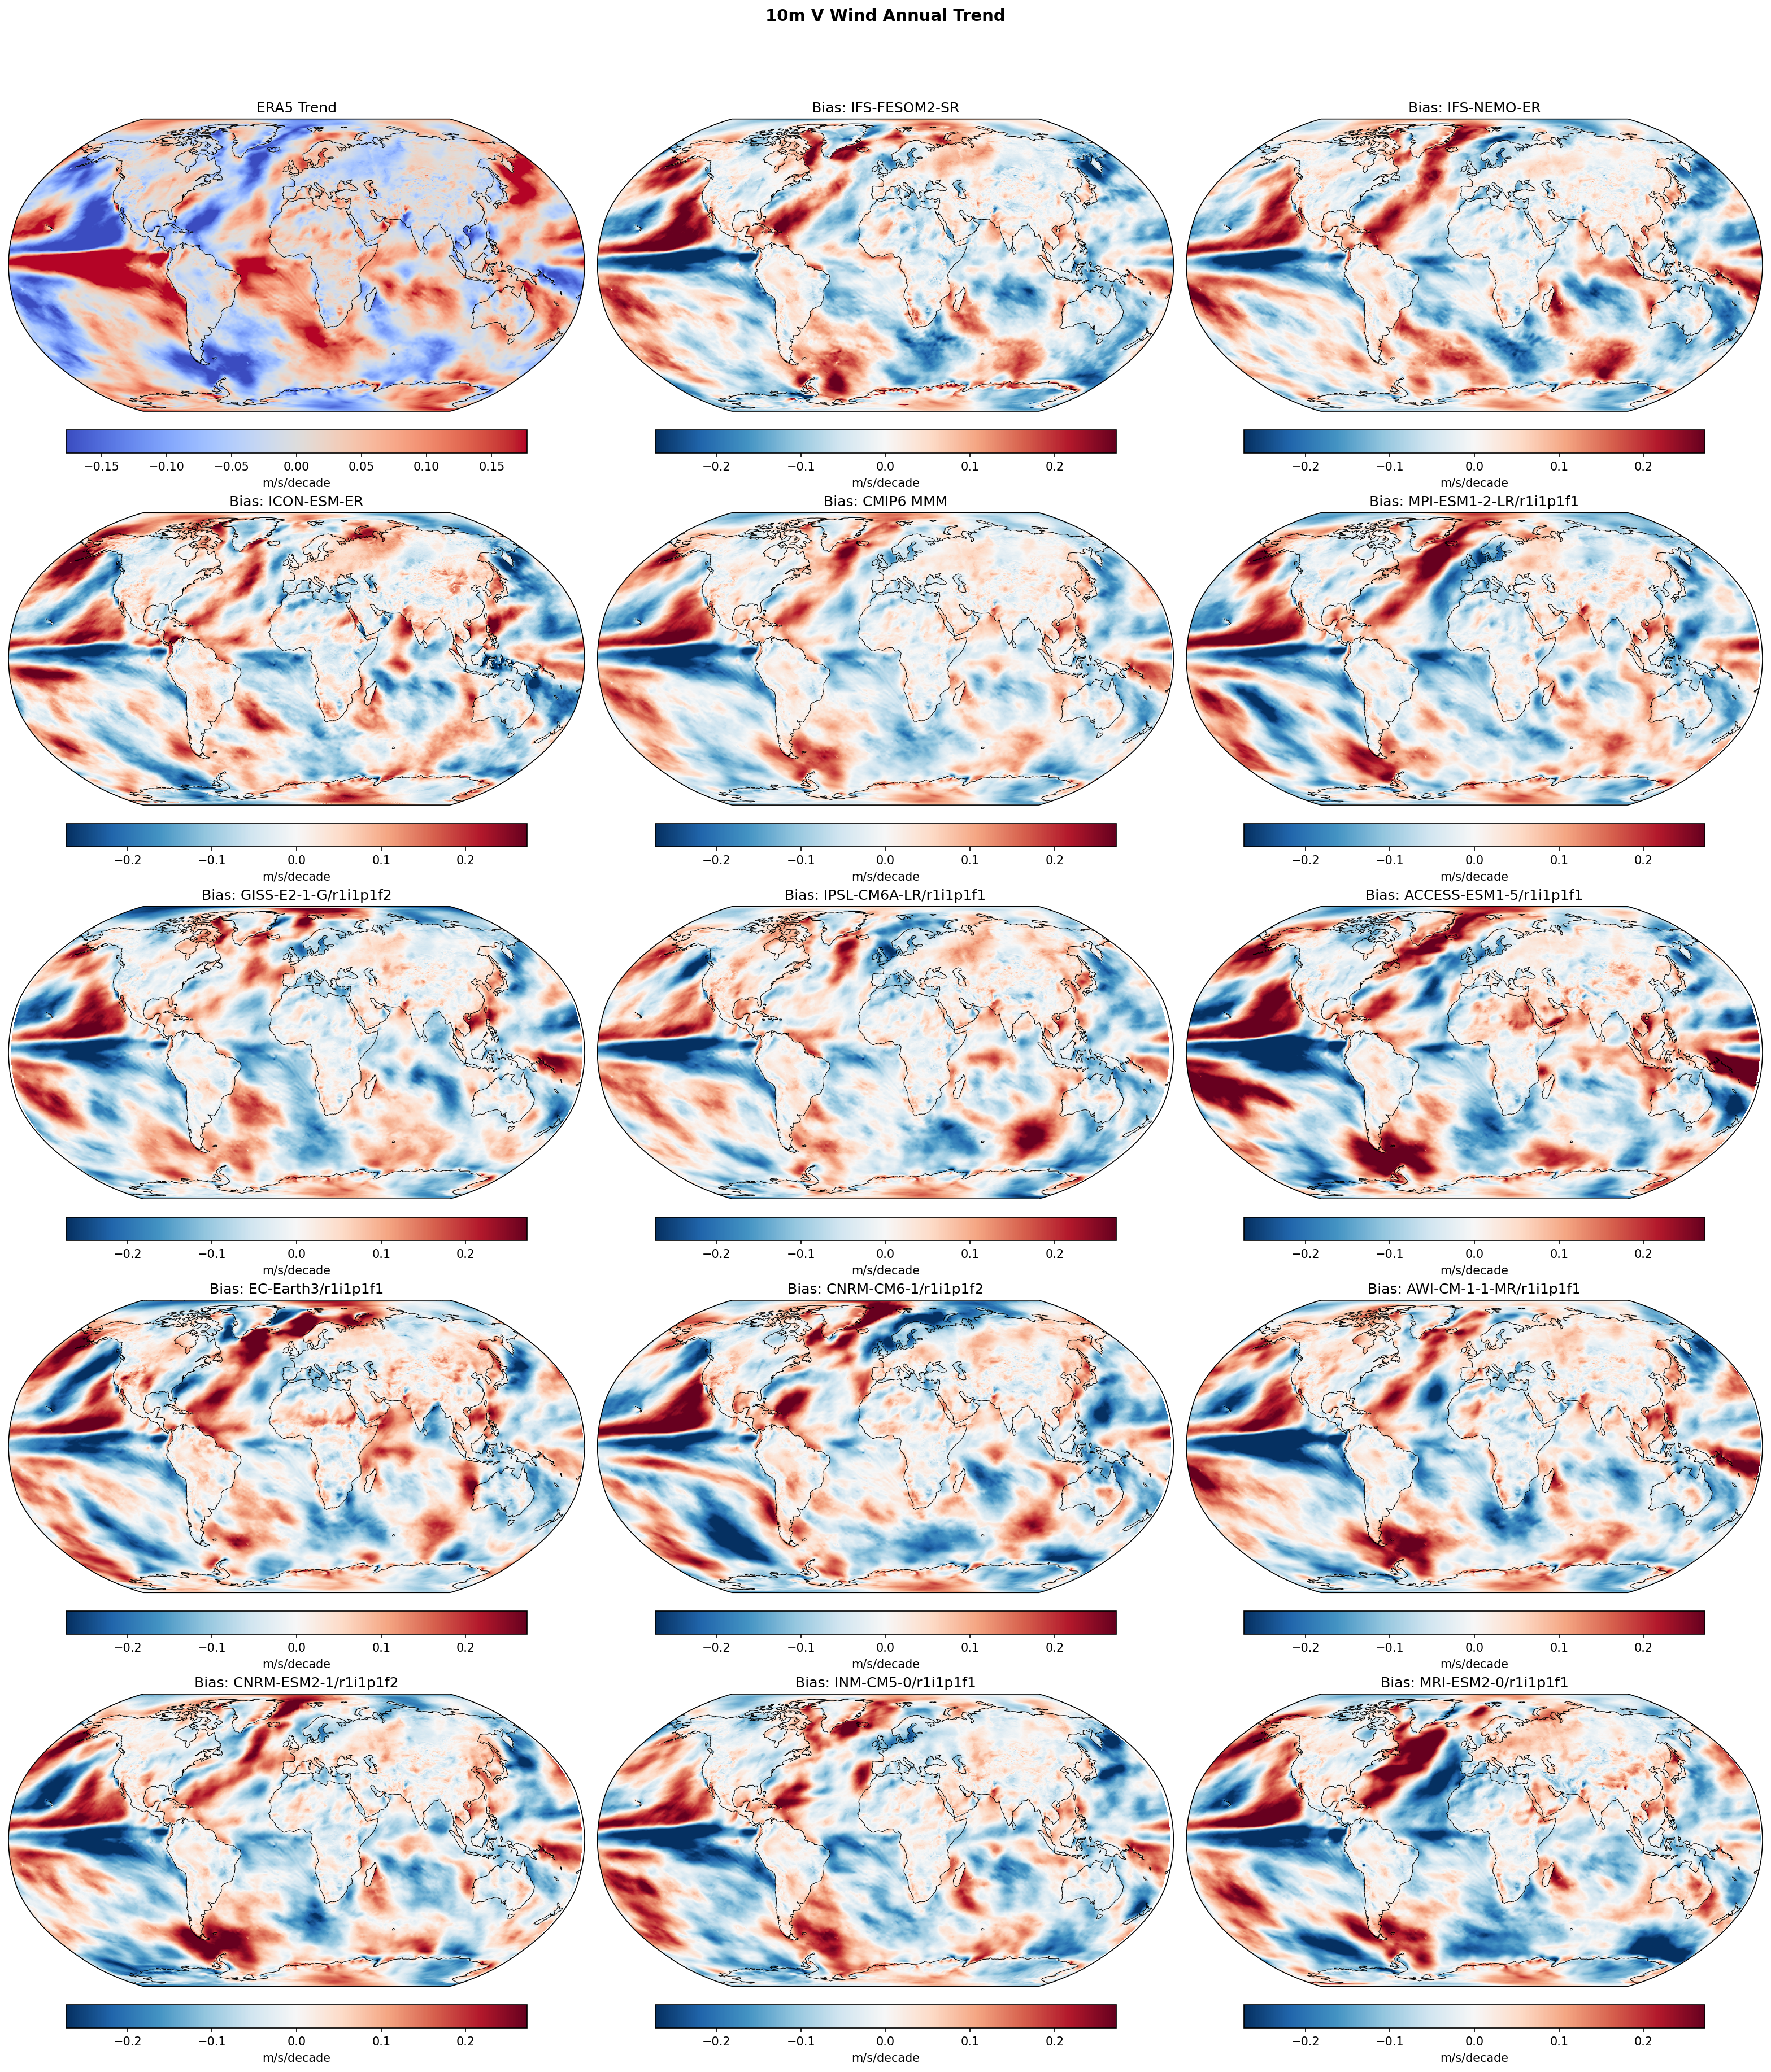
| Variables | vas |
|---|---|
| Models | IFS-FESOM2-SR, IFS-NEMO-ER, ICON-ESM-ER, HadGEM3-GC5, CMIP6 MMM, MPI-ESM1-2-LR/r1i1p1f1, GISS-E2-1-G/r1i1p1f2, IPSL-CM6A-LR/r1i1p1f1, ACCESS-ESM1-5/r1i1p1f1, EC-Earth3/r1i1p1f1, CNRM-CM6-1/r1i1p1f2, AWI-CM-1-1-MR/r1i1p1f1, CNRM-ESM2-1/r1i1p1f2, INM-CM5-0/r1i1p1f1, MRI-ESM2-0/r1i1p1f1 |
| Reference Dataset | ERA5 |
| Units | m/s/decade |
| Period | 1980–2014 |
| IFS-FESOM2-SR | Global Mean Trend: 0.00 · Global Mean Trend Diff: -0.01 · Trend Rmse: 0.10 |
| IFS-NEMO-ER | Global Mean Trend: 0.01 · Global Mean Trend Diff: -0.00 · Trend Rmse: 0.10 |
| ICON-ESM-ER | Global Mean Trend: 0.01 · Global Mean Trend Diff: -0.00 · Trend Rmse: 0.10 |
| HadGEM3-GC5 | Global Mean Trend: 0.01 · Global Mean Trend Diff: -0.00 · Trend Rmse: 0.10 |
| CMIP6 MMM | Global Mean Trend Diff: -0.01 · Trend Rmse: 0.09 |
| MPI-ESM1-2-LR/r1i1p1f1 | Global Mean Trend Diff: -0.00 · Trend Rmse: 0.10 |
| GISS-E2-1-G/r1i1p1f2 | Global Mean Trend Diff: -0.01 · Trend Rmse: 0.10 |
| IPSL-CM6A-LR/r1i1p1f1 | Global Mean Trend Diff: -0.01 · Trend Rmse: 0.09 |
| ACCESS-ESM1-5/r1i1p1f1 | Global Mean Trend Diff: 0.00 · Trend Rmse: 0.13 |
| EC-Earth3/r1i1p1f1 | Global Mean Trend Diff: 0.00 · Trend Rmse: 0.11 |
| CNRM-CM6-1/r1i1p1f2 | Global Mean Trend Diff: -0.01 · Trend Rmse: 0.11 |
| AWI-CM-1-1-MR/r1i1p1f1 | Global Mean Trend Diff: -0.01 · Trend Rmse: 0.11 |
| CNRM-ESM2-1/r1i1p1f2 | Global Mean Trend Diff: -0.01 · Trend Rmse: 0.10 |
| INM-CM5-0/r1i1p1f1 | Global Mean Trend Diff: -0.01 · Trend Rmse: 0.10 |
| MRI-ESM2-0/r1i1p1f1 | Global Mean Trend Diff: -0.01 · Trend Rmse: 0.12 |
Summary high
This diagnostic compares 1980–2014 annual linear trends in 10m meridional (V) wind between ERA5 reanalysis and a suite of high-resolution (EERIE) and standard CMIP6 coupled models. The figure reveals a stark, systematic failure across all models to reproduce the observed intensification of meridional atmospheric circulation in the Tropical Pacific.
Key Findings
- Systematic Tropical Pacific Bias: All models display a large-scale bias dipole in the Tropical Pacific (positive bias in the west/central, negative in the east) which opposes the observed trend pattern.
- Underestimation of Trade Wind Intensification: ERA5 shows strengthening meridional trade wind components (negative trend/northerly in NH, positive trend/southerly in SH), while models show weak or opposite trends, resulting in biases that effectively mirror the observational signal.
- Resolution Independence: The high-resolution EERIE models (IFS-FESOM2, IFS-NEMO, ICON-ESM, HadGEM3) exhibit the same systematic error patterns as the coarser CMIP6 Multi-Model Mean, implying that increased horizontal resolution does not resolve this specific trend discrepancy.
- High Error Magnitude: Trend bias magnitudes (>0.2 m/s/decade) frequently exceed the observed signal, leading to high RMSE values (0.09–0.13 m/s/decade) across the ensemble.
Spatial Patterns
ERA5 exhibits a distinct pattern of strengthening meridional flow in the tropics, with strong negative trends (blue) in the Northern Hemisphere tropical Pacific and positive trends (red) in the Southern Hemisphere/Equatorial Pacific, consistent with intensifying trade wind convergence. The model bias maps are dominated by the inverse of this pattern: widespread positive anomalies in the NH tropics and negative anomalies in the SH tropics. This indicates that the models either have no trend or a weak reversal, failing to capture the strong observed intensification.
Model Agreement
There is exceptionally high agreement between the high-resolution EERIE models and the CMIP6 ensemble regarding the spatial structure of the error. While individual ensemble members (e.g., ACCESS-ESM1-5) show higher noise levels or magnitude differences, the fundamental Pacific bias pattern is ubiquitous. No single model significantly outperforms the others in capturing the ERA5 trend morphology.
Physical Interpretation
The results illustrate the well-documented 'pattern effect' or discrepancy in historical tropical Pacific trends. Over this period, the real world experienced a La Niña-like cooling trend associated with a strengthening of the Walker and Hadley circulations (intensified trade winds). Coupled models typically fail to simulate this forced response or internal variability phase, instead producing uniform warming or weakening circulation. The consistency across resolutions suggests this bias stems from fundamental deficiencies in coupled feedbacks or the phasing of decadal variability (e.g., IPO) rather than atmospheric resolution limits.
Caveats
- The analysis period (1980–2014) is dominated by decadal internal variability (e.g., IPO/PDO). Free-running coupled models are not expected to phase-match unforced internal variability with observations, contributing to the mismatch.
- The systematic nature of the mismatch across the entire multi-model ensemble suggests a common forcing or feedback deficiency, rather than random noise alone.
10m V Wind DJF Linear Trend
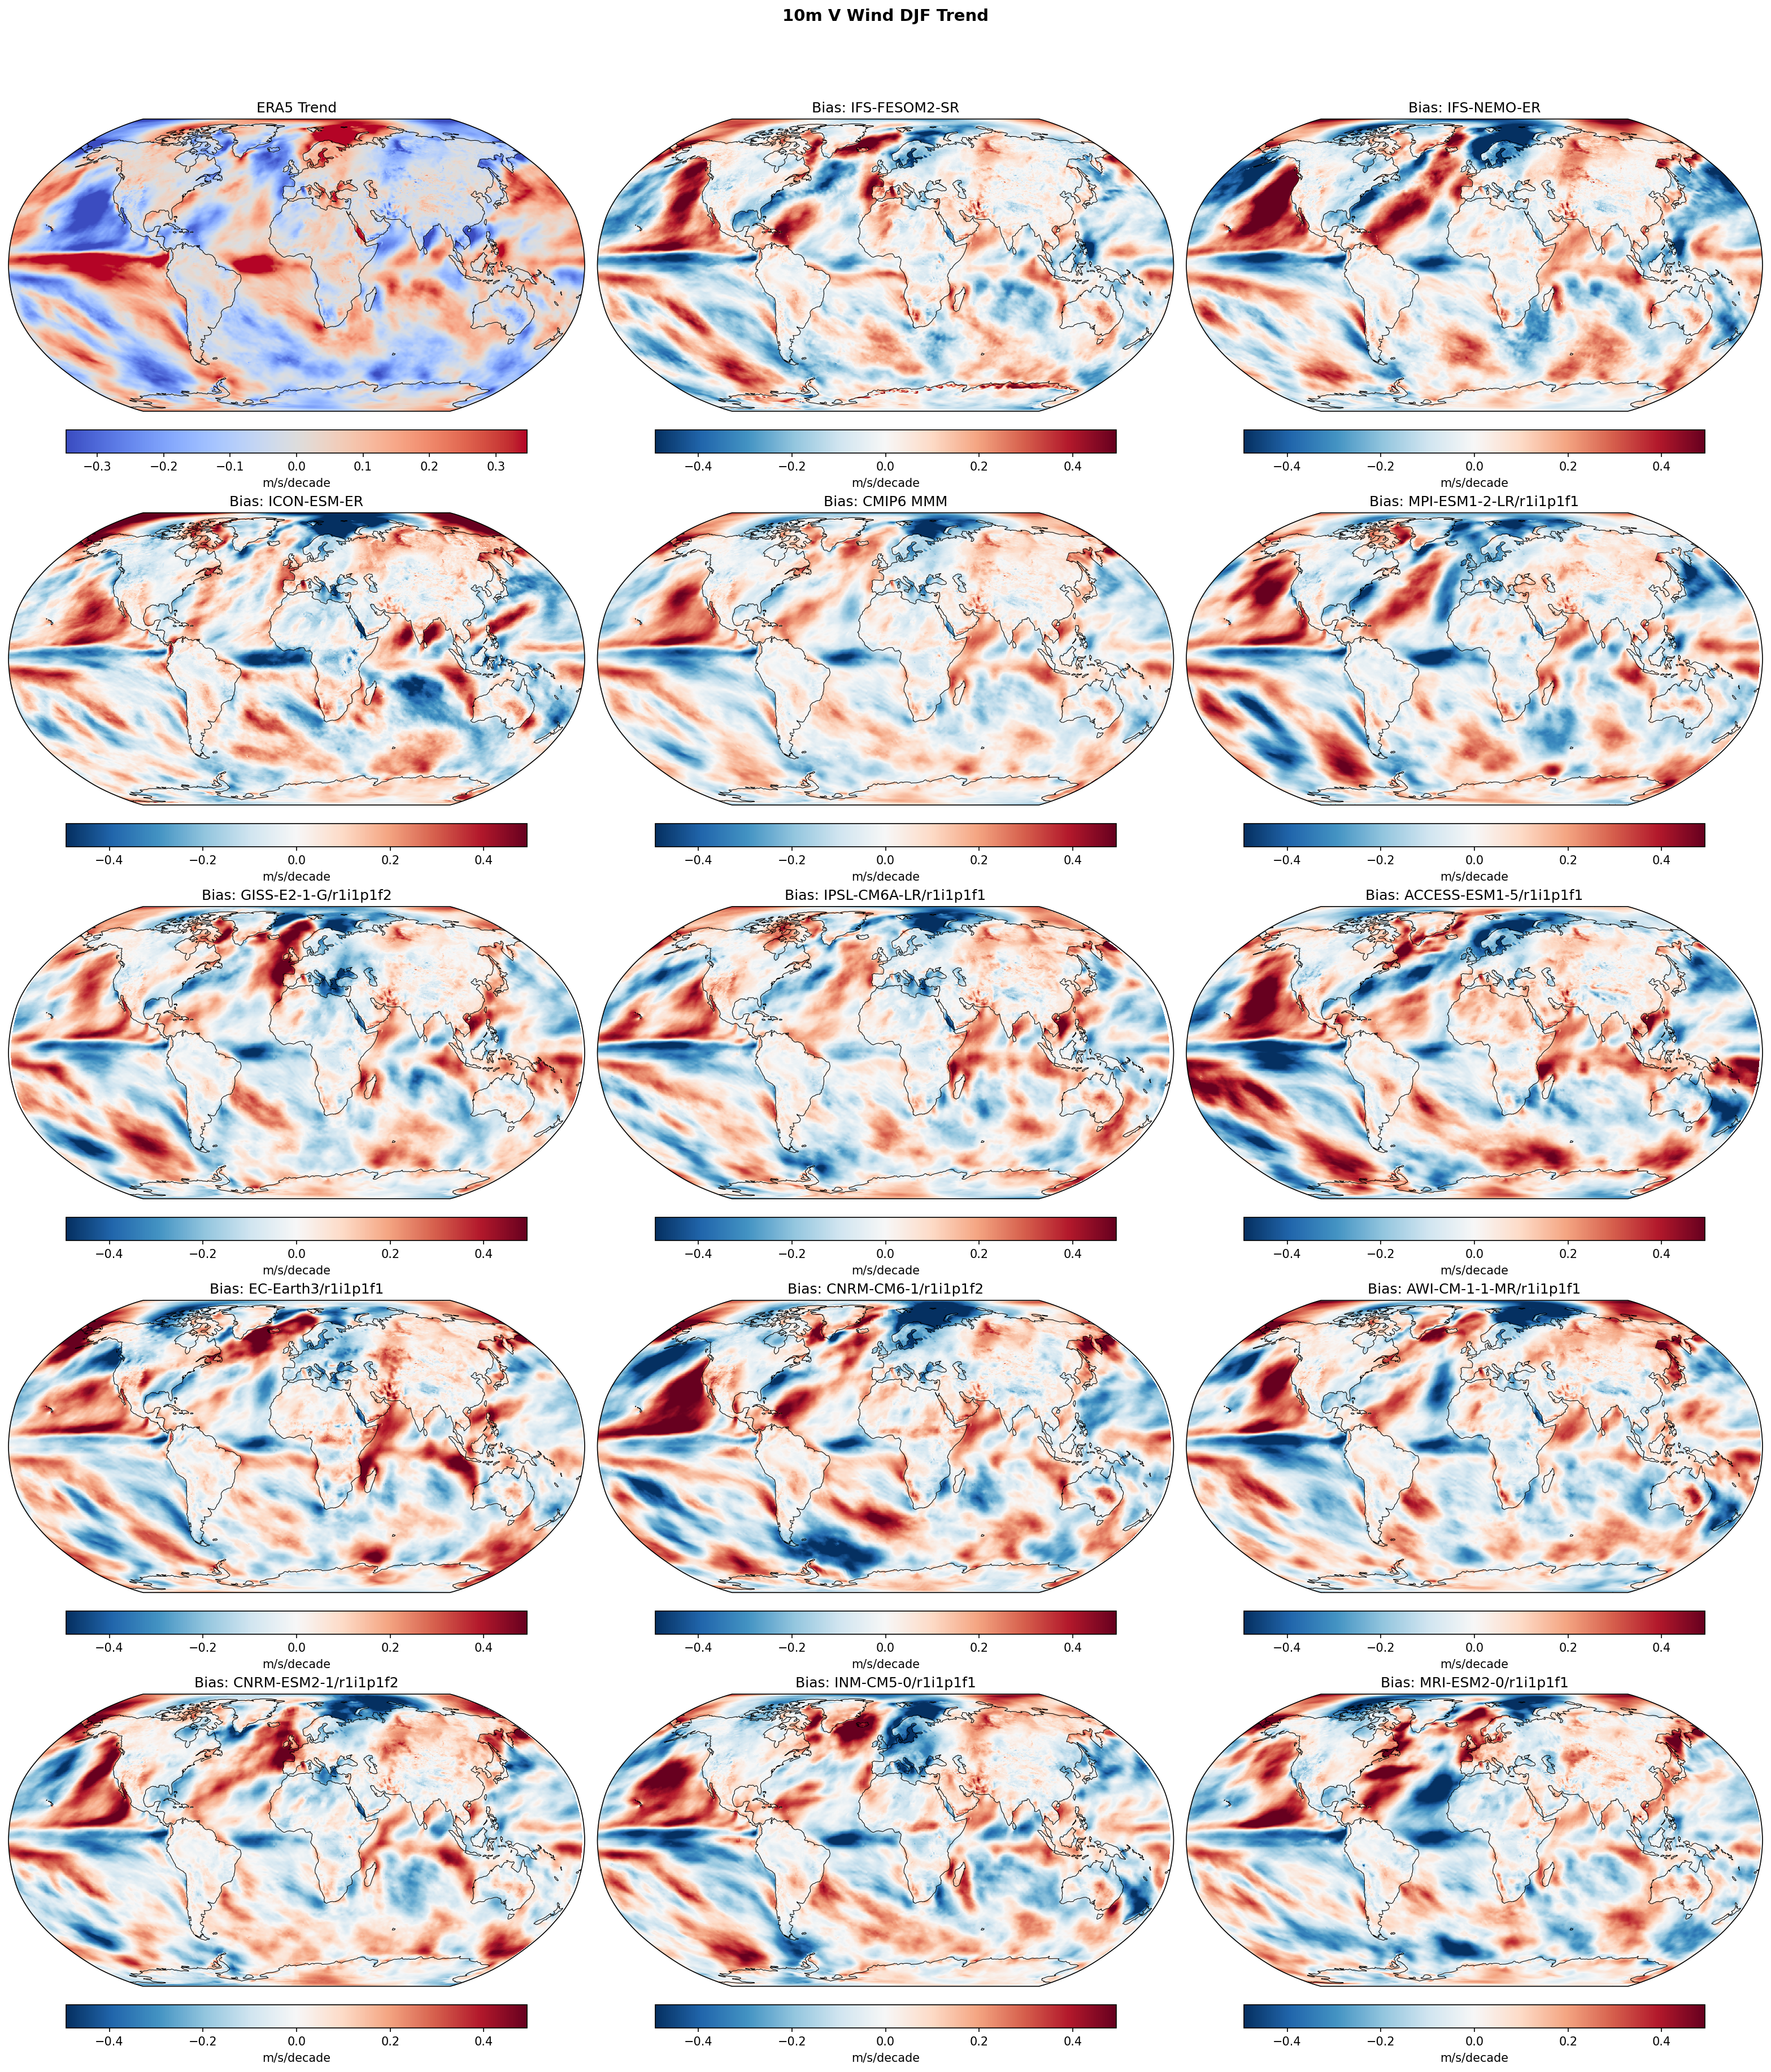
| Variables | vas |
|---|---|
| Models | IFS-FESOM2-SR, IFS-NEMO-ER, ICON-ESM-ER, HadGEM3-GC5, CMIP6 MMM, MPI-ESM1-2-LR/r1i1p1f1, GISS-E2-1-G/r1i1p1f2, IPSL-CM6A-LR/r1i1p1f1, ACCESS-ESM1-5/r1i1p1f1, EC-Earth3/r1i1p1f1, CNRM-CM6-1/r1i1p1f2, AWI-CM-1-1-MR/r1i1p1f1, CNRM-ESM2-1/r1i1p1f2, INM-CM5-0/r1i1p1f1, MRI-ESM2-0/r1i1p1f1 |
| Reference Dataset | ERA5 |
| Units | m/s/decade |
| Period | 1980–2014 |
| CMIP6 MMM | Global Mean Trend Diff: 0.01 · Trend Rmse: None |
| MPI-ESM1-2-LR/r1i1p1f1 | Global Mean Trend Diff: 0.00 · Trend Rmse: None |
| GISS-E2-1-G/r1i1p1f2 | Global Mean Trend Diff: 0.01 · Trend Rmse: None |
| IPSL-CM6A-LR/r1i1p1f1 | Global Mean Trend Diff: 0.01 · Trend Rmse: None |
| ACCESS-ESM1-5/r1i1p1f1 | Global Mean Trend Diff: 0.02 · Trend Rmse: None |
| EC-Earth3/r1i1p1f1 | Global Mean Trend Diff: 0.02 · Trend Rmse: None |
| CNRM-CM6-1/r1i1p1f2 | Global Mean Trend Diff: 0.01 · Trend Rmse: None |
| AWI-CM-1-1-MR/r1i1p1f1 | Global Mean Trend Diff: 0.00 · Trend Rmse: None |
| CNRM-ESM2-1/r1i1p1f2 | Global Mean Trend Diff: 0.01 · Trend Rmse: None |
| INM-CM5-0/r1i1p1f1 | Global Mean Trend Diff: 0.01 · Trend Rmse: None |
| MRI-ESM2-0/r1i1p1f1 | Global Mean Trend Diff: -0.00 · Trend Rmse: None |
Summary high
This figure evaluates the linear trends in DJF 10m meridional (V) wind over the period 1980–2014, comparing high-resolution EERIE models and CMIP6 models against ERA5 reanalysis.
Key Findings
- There is a widespread and substantial disagreement between modeled and observed wind trends, with trend difference magnitudes (up to ±0.4 m/s/decade) often exceeding the observed signal (±0.3 m/s/decade).
- The spatial patterns of the trend differences (Model minus Obs) are strikingly similar across all models, including the CMIP6 Multi-Model Mean (MMM), and largely resemble the inverse of the observed ERA5 trends.
- High-resolution models (IFS-FESOM2-SR, IFS-NEMO-ER, ICON-ESM-ER, HadGEM3-GC5) perform similarly to the standard-resolution CMIP6 ensemble, showing no distinct improvement in capturing these specific decadal circulation trends.
Spatial Patterns
ERA5 shows distinct regional trend features, such as a strong positive trend (strengthened northward flow) in the central equatorial Pacific and a negative trend off the North American west coast. The model difference maps consistently show the opposite: a strong negative bias in the equatorial Pacific and a positive bias in the northeast Pacific. This 'inverse' pattern indicates that the models generally produce weak or spatially uncorrelated trends compared to the strong, coherent features in observations.
Model Agreement
Inter-model agreement is very high regarding the error pattern; essentially all models differ from observations in the same way. The trend difference maps for the EERIE high-res models are visually nearly identical to the CMIP6 MMM and individual CMIP6 members, suggesting the discrepancy is not resolution-dependent.
Physical Interpretation
The large discrepancies and the 'inverse observation' pattern in the difference maps strongly suggest that the observed circulation trends over this 35-year period are dominated by specific phases of internal climate variability (e.g., the Interdecadal Pacific Oscillation or PDO) rather than a uniform forced response. Since free-running coupled models generate their own independent internal variability phases, they are not expected to synchronize with the observed historical realization unless the trend is strongly radiatively forced, which does not appear to be the dominant driver for these wind changes.
Caveats
- A 35-year period is relatively short for diagnosing forced circulation trends against the noise of internal multidecadal variability.
- Disagreement in trend maps for free-running models is expected and does not necessarily imply model deficiency in physics, but rather a phase mismatch in internal modes.
10m V Wind JJA Linear Trend
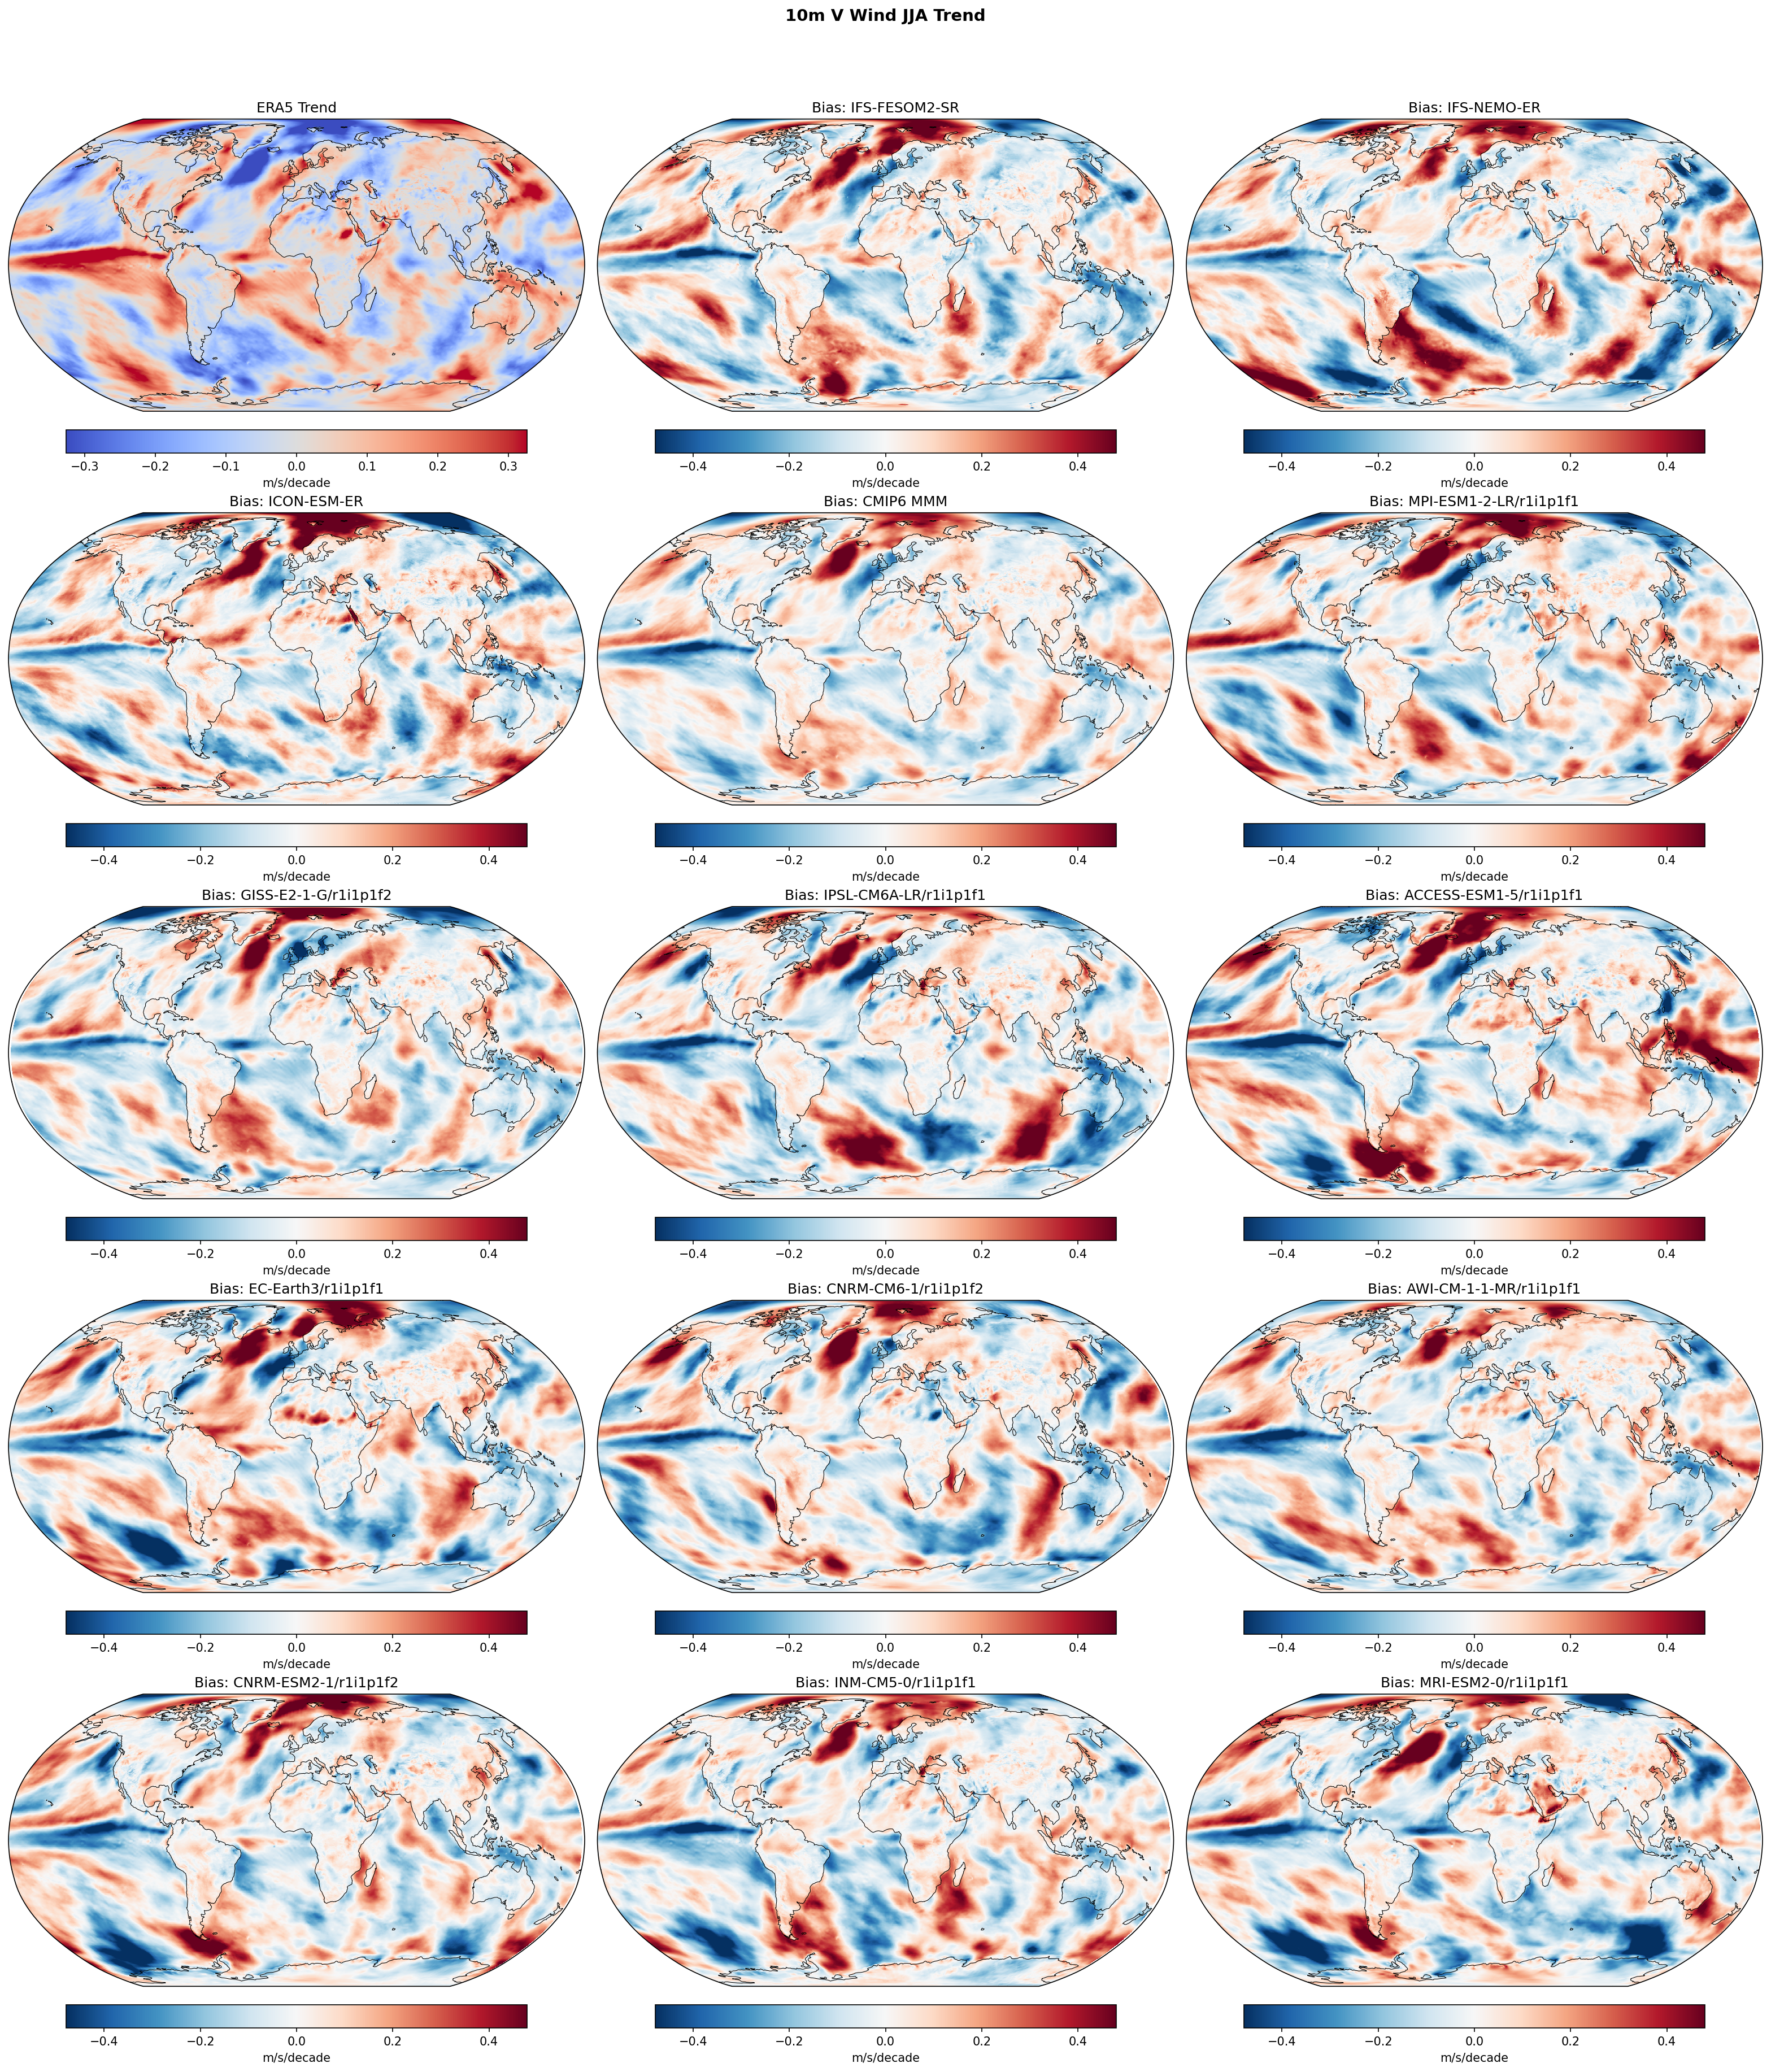
| Variables | vas |
|---|---|
| Models | IFS-FESOM2-SR, IFS-NEMO-ER, ICON-ESM-ER, HadGEM3-GC5, CMIP6 MMM, MPI-ESM1-2-LR/r1i1p1f1, GISS-E2-1-G/r1i1p1f2, IPSL-CM6A-LR/r1i1p1f1, ACCESS-ESM1-5/r1i1p1f1, EC-Earth3/r1i1p1f1, CNRM-CM6-1/r1i1p1f2, AWI-CM-1-1-MR/r1i1p1f1, CNRM-ESM2-1/r1i1p1f2, INM-CM5-0/r1i1p1f1, MRI-ESM2-0/r1i1p1f1 |
| Reference Dataset | ERA5 |
| Units | m/s/decade |
| Period | 1980–2014 |
| CMIP6 MMM | Global Mean Trend Diff: -0.01 · Trend Rmse: None |
| MPI-ESM1-2-LR/r1i1p1f1 | Global Mean Trend Diff: 0.00 · Trend Rmse: None |
| GISS-E2-1-G/r1i1p1f2 | Global Mean Trend Diff: -0.01 · Trend Rmse: None |
| IPSL-CM6A-LR/r1i1p1f1 | Global Mean Trend Diff: -0.01 · Trend Rmse: None |
| ACCESS-ESM1-5/r1i1p1f1 | Global Mean Trend Diff: 0.01 · Trend Rmse: None |
| EC-Earth3/r1i1p1f1 | Global Mean Trend Diff: -0.00 · Trend Rmse: None |
| CNRM-CM6-1/r1i1p1f2 | Global Mean Trend Diff: -0.01 · Trend Rmse: None |
| AWI-CM-1-1-MR/r1i1p1f1 | Global Mean Trend Diff: -0.00 · Trend Rmse: None |
| CNRM-ESM2-1/r1i1p1f2 | Global Mean Trend Diff: -0.01 · Trend Rmse: None |
| INM-CM5-0/r1i1p1f1 | Global Mean Trend Diff: -0.01 · Trend Rmse: None |
| MRI-ESM2-0/r1i1p1f1 | Global Mean Trend Diff: -0.02 · Trend Rmse: None |
Summary high
This figure evaluates the linear trend in June-August (JJA) 10m meridional (V) wind over the period 1980–2014, comparing ERA5 reanalysis with EERIE high-resolution coupled models and the CMIP6 ensemble.
Key Findings
- There is substantial disagreement between modeled and observed trends, with difference magnitudes (up to ±0.4 m/s/decade) often exceeding the magnitude of the observed trends themselves.
- A systematic bias appears in the Eastern Equatorial Pacific, where ERA5 shows a strong positive trend (strengthening southerly cross-equatorial flow) that models consistently underestimate (indicated by negative values in difference maps).
- High-resolution EERIE models (IFS-FESOM2, IFS-NEMO, ICON-ESM) display similar bias patterns to the standard-resolution CMIP6 Multi-Model Mean, suggesting that resolution alone does not resolve the discrepancy in historical circulation trends.
- IFS-FESOM2-SR and IFS-NEMO-ER show very similar error structures, indicating that the atmospheric component or common forcing dominates the trend response over differences in ocean grid discretization.
Spatial Patterns
ERA5 shows a complex pattern of trends, including strengthening southerlies (positive trend) in the eastern Tropical Pacific and strengthening monsoon flows in the western Indian Ocean. The model difference maps are dominated by large-scale dipole features. Most notably, a 'blue' (negative difference) band stretches across the Eastern Pacific in almost all models and the CMIP6 MMM, indicating models fail to capture the observed intensification of the Hadley circulation branch or cross-equatorial flow in this region. HadGEM3-GC5 exhibits a distinct, strong positive trend difference in the North Atlantic compared to other models.
Model Agreement
Agreement between models and observations is generally low for these decadal trends. Inter-model agreement is variable; the EERIE models show biases of similar magnitude and spatial scale to individual CMIP6 ensemble members. The CMIP6 MMM difference map retains significant structure (especially in the Pacific), implying a systematic divergence between the theoretical forced response and the observed realization of the 1980–2014 period.
Physical Interpretation
The pervasive discrepancy in the Tropical Pacific likely relates to the known issue where climate models generally produce an El Niño-like warming trend (weakening Walker circulation/trades) or weaker gradients, whereas observations for this period show a La Niña-like cooling trend with strengthening trade winds and cross-equatorial flow. The JJA timing highlights issues with the boreal summer Hadley circulation and ITCZ positioning. The dominance of internal variability (e.g., IPO, AMO phases) in 35-year trends means that free-running coupled models are not expected to match the phase of observed natural variability, leading to large 'biases' that are partly phase mismatches rather than purely structural errors.
Caveats
- Trends over short periods (35 years) are heavily influenced by internal climate variability; disagreement with observations is expected for free-running coupled models that do not assimilate observed ocean states.
- The 'Bias' label in trend difference maps conflates structural model error with internal variability mismatches.