Temperature 2m Temperature (Berkeley Earth) CMIP6
CMIP6 Multi-Model Mean Context
Comparison with CMIP6 ensemble mean from 11 members.
Contributing models: ACCESS-ESM1-5, AWI-CM-1-1-MR, CNRM-CM6-1, CNRM-ESM2-1, EC-Earth3, FGOALS-g3, GISS-E2-1-G, INM-CM5-0, IPSL-CM6A-LR, MPI-ESM1-2-LR, MRI-ESM2-0
Synthesis
Related diagnostics
2m Temperature Annual Mean Bias
| Variables | tas |
|---|---|
| Models | IFS-FESOM2-SR, IFS-NEMO-ER, ICON-ESM-ER, HadGEM3-GC5, CMIP6 MMM, MPI-ESM1-2-LR/r1i1p1f1, GISS-E2-1-G/r1i1p1f2, IPSL-CM6A-LR/r1i1p1f1, ACCESS-ESM1-5/r1i1p1f1, EC-Earth3/r1i1p1f1, CNRM-CM6-1/r1i1p1f2, AWI-CM-1-1-MR/r1i1p1f1, CNRM-ESM2-1/r1i1p1f2, FGOALS-g3/r1i1p1f1, INM-CM5-0/r1i1p1f1, MRI-ESM2-0/r1i1p1f1 |
| Reference Dataset | Berkeley Earth |
| Units | K |
| Period | 1980–2014 |
| IFS-FESOM2-SR | Pattern Correlation: 0.99 · Std Ratio: 0.96 · Rmse: 1.99 · Global Mean Bias: -0.54 · Arctic Bias: -2.32 · Tropical Bias: -0.83 · Antarctic Bias: 2.13 |
| IFS-NEMO-ER | Pattern Correlation: 0.99 · Std Ratio: 1.04 · Rmse: 2.62 · Global Mean Bias: -1.84 · Arctic Bias: -5.20 · Tropical Bias: -1.42 · Antarctic Bias: -3.08 |
| ICON-ESM-ER | Pattern Correlation: 0.99 · Std Ratio: 0.91 · Rmse: 2.61 · Global Mean Bias: -0.89 · Arctic Bias: 1.58 · Tropical Bias: -2.21 · Antarctic Bias: 1.13 |
| HadGEM3-GC5 | Pattern Correlation: 0.99 · Std Ratio: 1.01 · Rmse: 1.53 · Global Mean Bias: 0.20 · Arctic Bias: -0.74 · Tropical Bias: 0.16 · Antarctic Bias: 0.24 |
Summary high
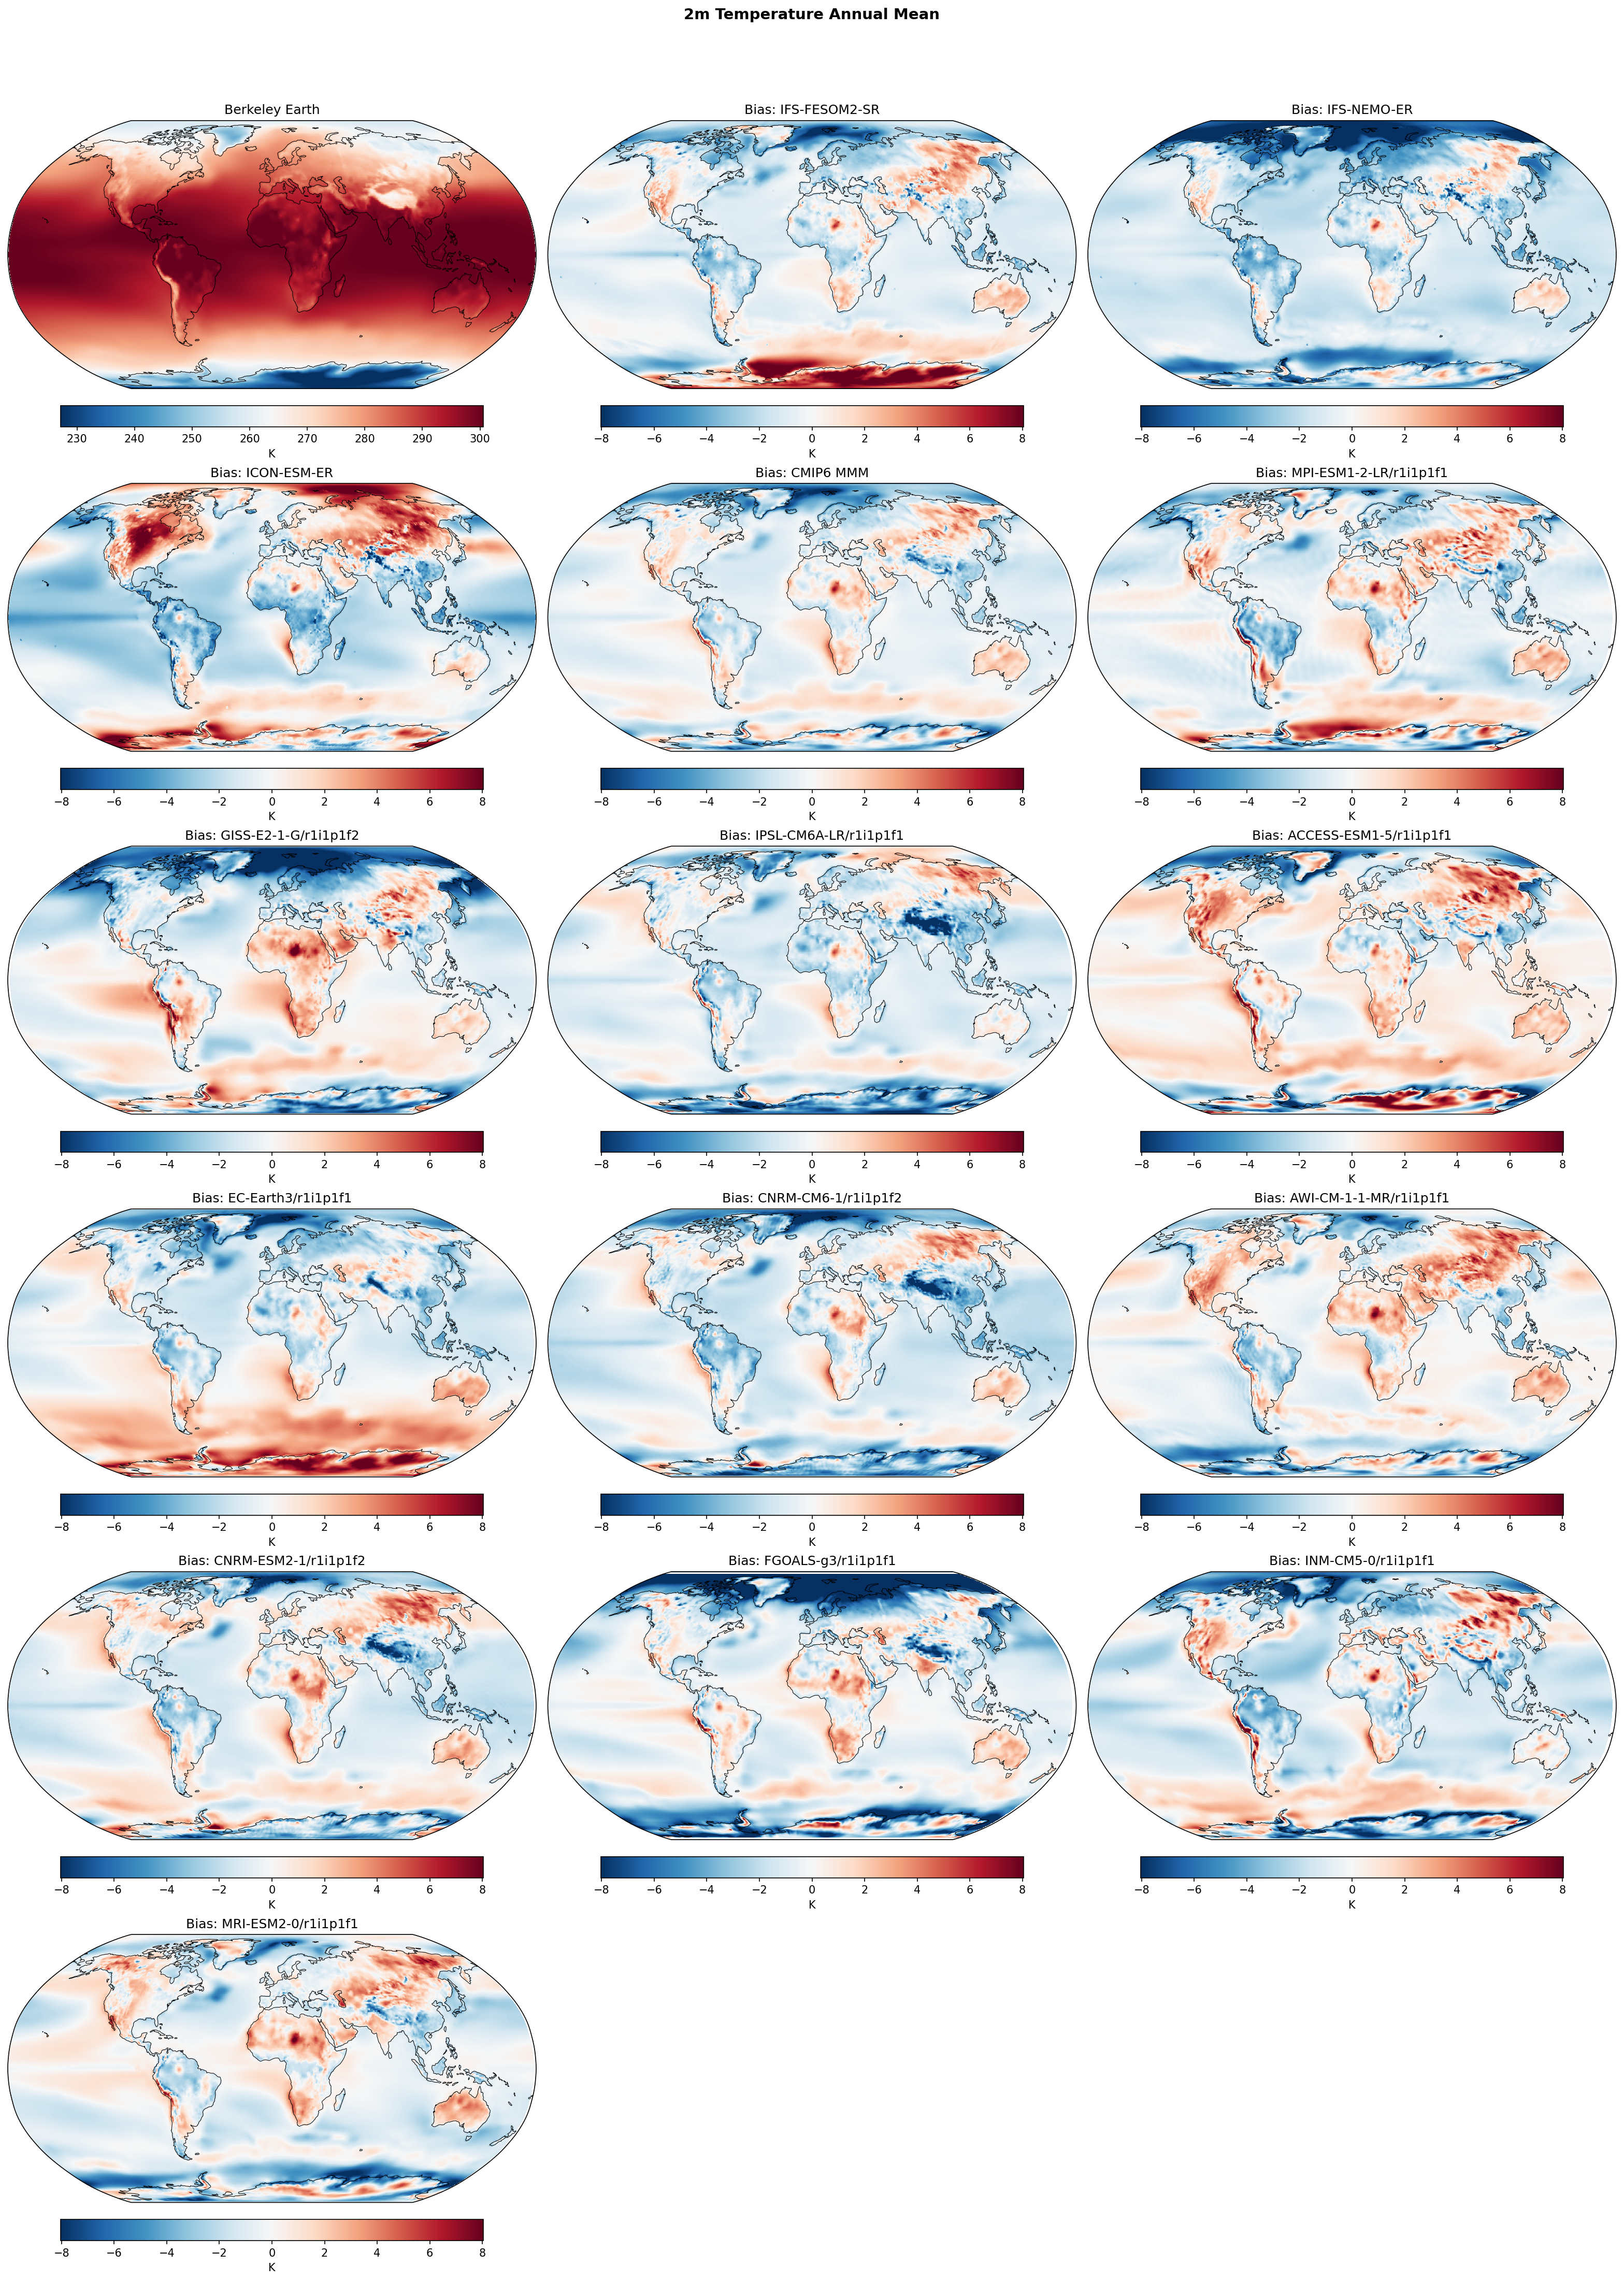
This diagnostic evaluates annual mean 2m temperature biases in high-resolution EERIE simulations (IFS-FESOM2-SR, IFS-NEMO-ER, ICON-ESM-ER) and CMIP6 models against Berkeley Earth climatology (1980–2014). The models exhibit strikingly different bias regimes, ranging from systematic global cooling to distinct latitudinal gradients.
Key Findings
- IFS-NEMO-ER exhibits a severe, systematic cold bias globally (mean: -1.84 K), which is amplified in the polar regions (Arctic: -5.2 K; Antarctic: -3.1 K).
- ICON-ESM-ER displays a 'cold tropics / warm poles' bias structure, characterized by strong warm biases over high-latitude continents (Siberia, N. America) and broad cooling in the tropics (-2.2 K).
- IFS-FESOM2-SR achieves the lowest RMSE (1.99 K) and best pattern correlation (0.99) among the EERIE models, but shows opposing polar biases: significantly warm over Antarctica (+2.1 K) and cold in the Arctic (-2.3 K).
Spatial Patterns
The CMIP6 Multi-Model Mean (MMM) shows the classic 'warm Southern Ocean' bias and 'cold North Atlantic' warming hole. IFS-FESOM2-SR reproduces the warm Antarctic bias but has a generally cooler global ocean. In contrast, IFS-NEMO-ER is dominated by blue (cold) biases everywhere, erasing the warm Southern Ocean feature entirely. ICON-ESM-ER is unique with its intense warm biases restricted largely to high-latitude land masses and sea ice zones, contrasting with a deep blue tropical band.
Model Agreement
There is low agreement among the three EERIE models, which diverge significantly in their mean state. IFS-FESOM2-SR aligns most closely with the observational mean state (despite regional biases), while IFS-NEMO-ER is an outlier with its strong global cold offset. CMIP6 individual models show high variability, but the EERIE models span nearly the full range of CMIP6 behavior (from cold IPSL-like patterns to warm ACCESS-like features).
Physical Interpretation
IFS-NEMO-ER's global coldness suggests a fundamental top-of-atmosphere energy imbalance, likely due to excessive planetary albedo (too many clouds or too extensive/bright sea ice). The strong land-warming in ICON-ESM-ER at high latitudes points to deficiencies in land-surface coupling, specifically snow albedo feedbacks or stable boundary layer parameterizations (insufficient decoupling in winter). The divergence between IFS-NEMO (cold Antarctic) and IFS-FESOM (warm Antarctic), which likely share atmospheric physics, highlights the critical role of the ocean/sea-ice component and resolution in regulating Southern Hemisphere surface temperatures.
Caveats
- Resolution differences (SR vs ER) complicate direct comparisons; IFS-NEMO-ER and ICON-ESM-ER are eddy-rich (~10km), while IFS-FESOM2-SR is standard resolution (~25km), which may influence the tuning status.
- Observational uncertainty in Antarctic temperatures is higher than in other regions.
2m Temperature DJF Bias
| Variables | tas |
|---|---|
| Models | IFS-FESOM2-SR, IFS-NEMO-ER, ICON-ESM-ER, HadGEM3-GC5, CMIP6 MMM, MPI-ESM1-2-LR/r1i1p1f1, GISS-E2-1-G/r1i1p1f2, IPSL-CM6A-LR/r1i1p1f1, ACCESS-ESM1-5/r1i1p1f1, EC-Earth3/r1i1p1f1, CNRM-CM6-1/r1i1p1f2, AWI-CM-1-1-MR/r1i1p1f1, CNRM-ESM2-1/r1i1p1f2, FGOALS-g3/r1i1p1f1, INM-CM5-0/r1i1p1f1, MRI-ESM2-0/r1i1p1f1 |
| Reference Dataset | Berkeley Earth |
| Units | K |
| Period | 1980–2014 |
Summary high
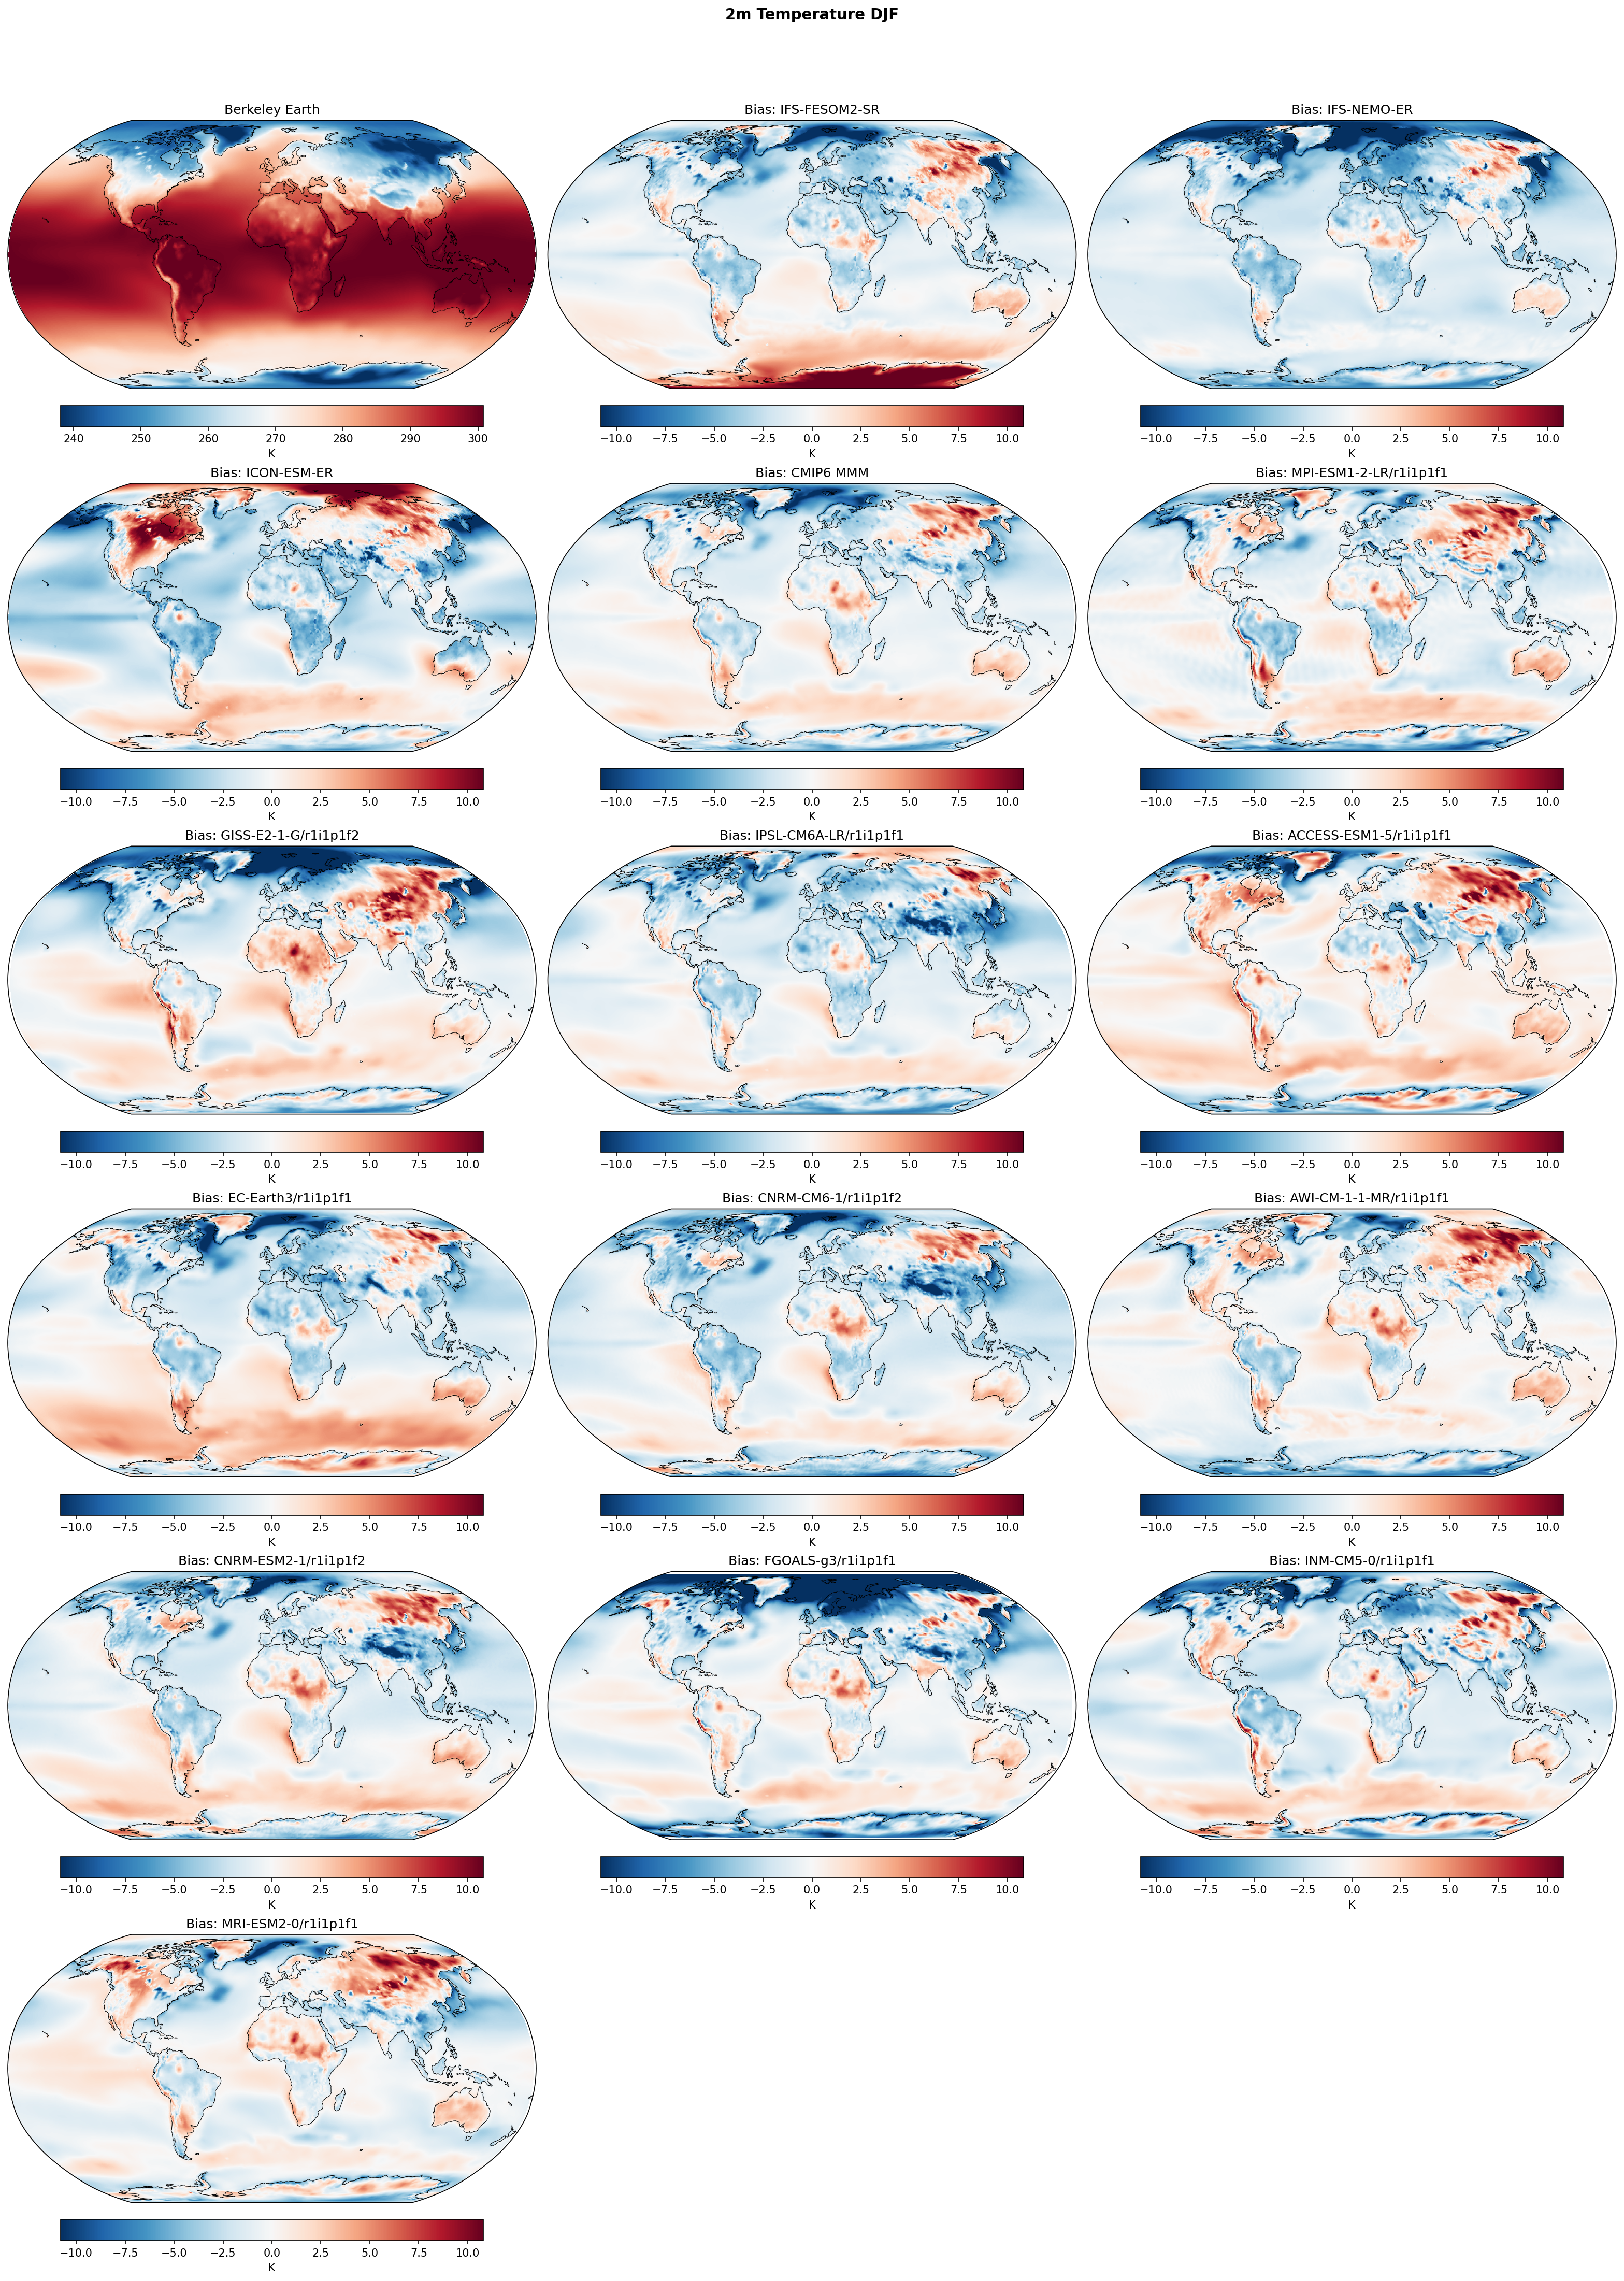
This figure evaluates December-January-February (DJF) 2m temperature biases in EERIE simulations and CMIP6 models relative to Berkeley Earth climatology. The EERIE models exhibit divergent biases in Northern Hemisphere (NH) winter, with IFS variants showing continental cooling while ICON-ESM-ER and HadGEM3-GC5 show widespread continental warming.
Key Findings
- A striking dichotomy exists in NH winter continental biases: IFS-FESOM2-SR and IFS-NEMO-ER display widespread cold biases over North America and Eurasia, whereas ICON-ESM-ER and HadGEM3-GC5 exhibit strong warm biases in these same regions.
- IFS models show distinct warm biases over tropical land masses, particularly the Amazon Basin and Central Africa, likely indicative of precipitation deficits and reduced evaporative cooling.
- HadGEM3-GC5 and the CMIP6 Multi-Model Mean (MMM) exhibit a pronounced warm bias over the Southern Ocean, a longstanding bias in coupled models often linked to cloud phase errors; IFS models show reduced biases in this region.
- ICON-ESM-ER displays a strong, localized cold bias in the North Atlantic subpolar gyre region, contrasting with the intense warm bias over adjacent Northeastern Canada.
- In the Arctic, most models, including IFS and ICON, show warm biases, though the spatial extent varies, with GISS-E2-1-G (CMIP6) showing the most extreme high-latitude warming.
Spatial Patterns
The most dominant spatial pattern is the land-sea contrast and the hemispheric asymmetry. Biases are strongest over NH continents (winter) and the Southern Ocean (summer). The IFS models share a 'cold-continent/warm-Arctic' dipole in the NH, while ICON and HadGEM3 tend towards 'warm-continent' patterns.
Model Agreement
The two IFS variants (FESOM2-SR and NEMO-ER) show very high agreement, indicating that atmospheric physics rather than ocean discretization drives the dominant surface temperature biases. There is significant inter-model disagreement regarding the sign of NH continental winter temperature biases (IFS vs. ICON/HadGEM).
Physical Interpretation
The divergence in NH winter continental temperatures likely stems from differences in snow albedo parameterizations and stable boundary layer physics; cold biases (IFS) suggest strong decoupling or high albedo, while warm biases (ICON/HadGEM) suggest excessive mixing or insufficient snow cooling. The tropical warm biases in IFS are typical of 'dry bias' feedbacks where lack of rain reduces evapotranspiration. The Southern Ocean warm bias in HadGEM3 is historically linked to insufficient reflection by supercooled liquid clouds.
Caveats
- The analysis is restricted to DJF, so seasonal compensation (e.g., summer biases) is not visible.
- Biases over sea ice regions (Arctic/Antarctic) involve coupled ice-atmosphere interactions that are difficult to disentangle from simple temperature maps.
2m Temperature JJA Bias
| Variables | tas |
|---|---|
| Models | IFS-FESOM2-SR, IFS-NEMO-ER, ICON-ESM-ER, HadGEM3-GC5, CMIP6 MMM, MPI-ESM1-2-LR/r1i1p1f1, GISS-E2-1-G/r1i1p1f2, IPSL-CM6A-LR/r1i1p1f1, ACCESS-ESM1-5/r1i1p1f1, EC-Earth3/r1i1p1f1, CNRM-CM6-1/r1i1p1f2, AWI-CM-1-1-MR/r1i1p1f1, CNRM-ESM2-1/r1i1p1f2, FGOALS-g3/r1i1p1f1, INM-CM5-0/r1i1p1f1, MRI-ESM2-0/r1i1p1f1 |
| Reference Dataset | Berkeley Earth |
| Units | K |
| Period | 1980–2014 |
Summary high
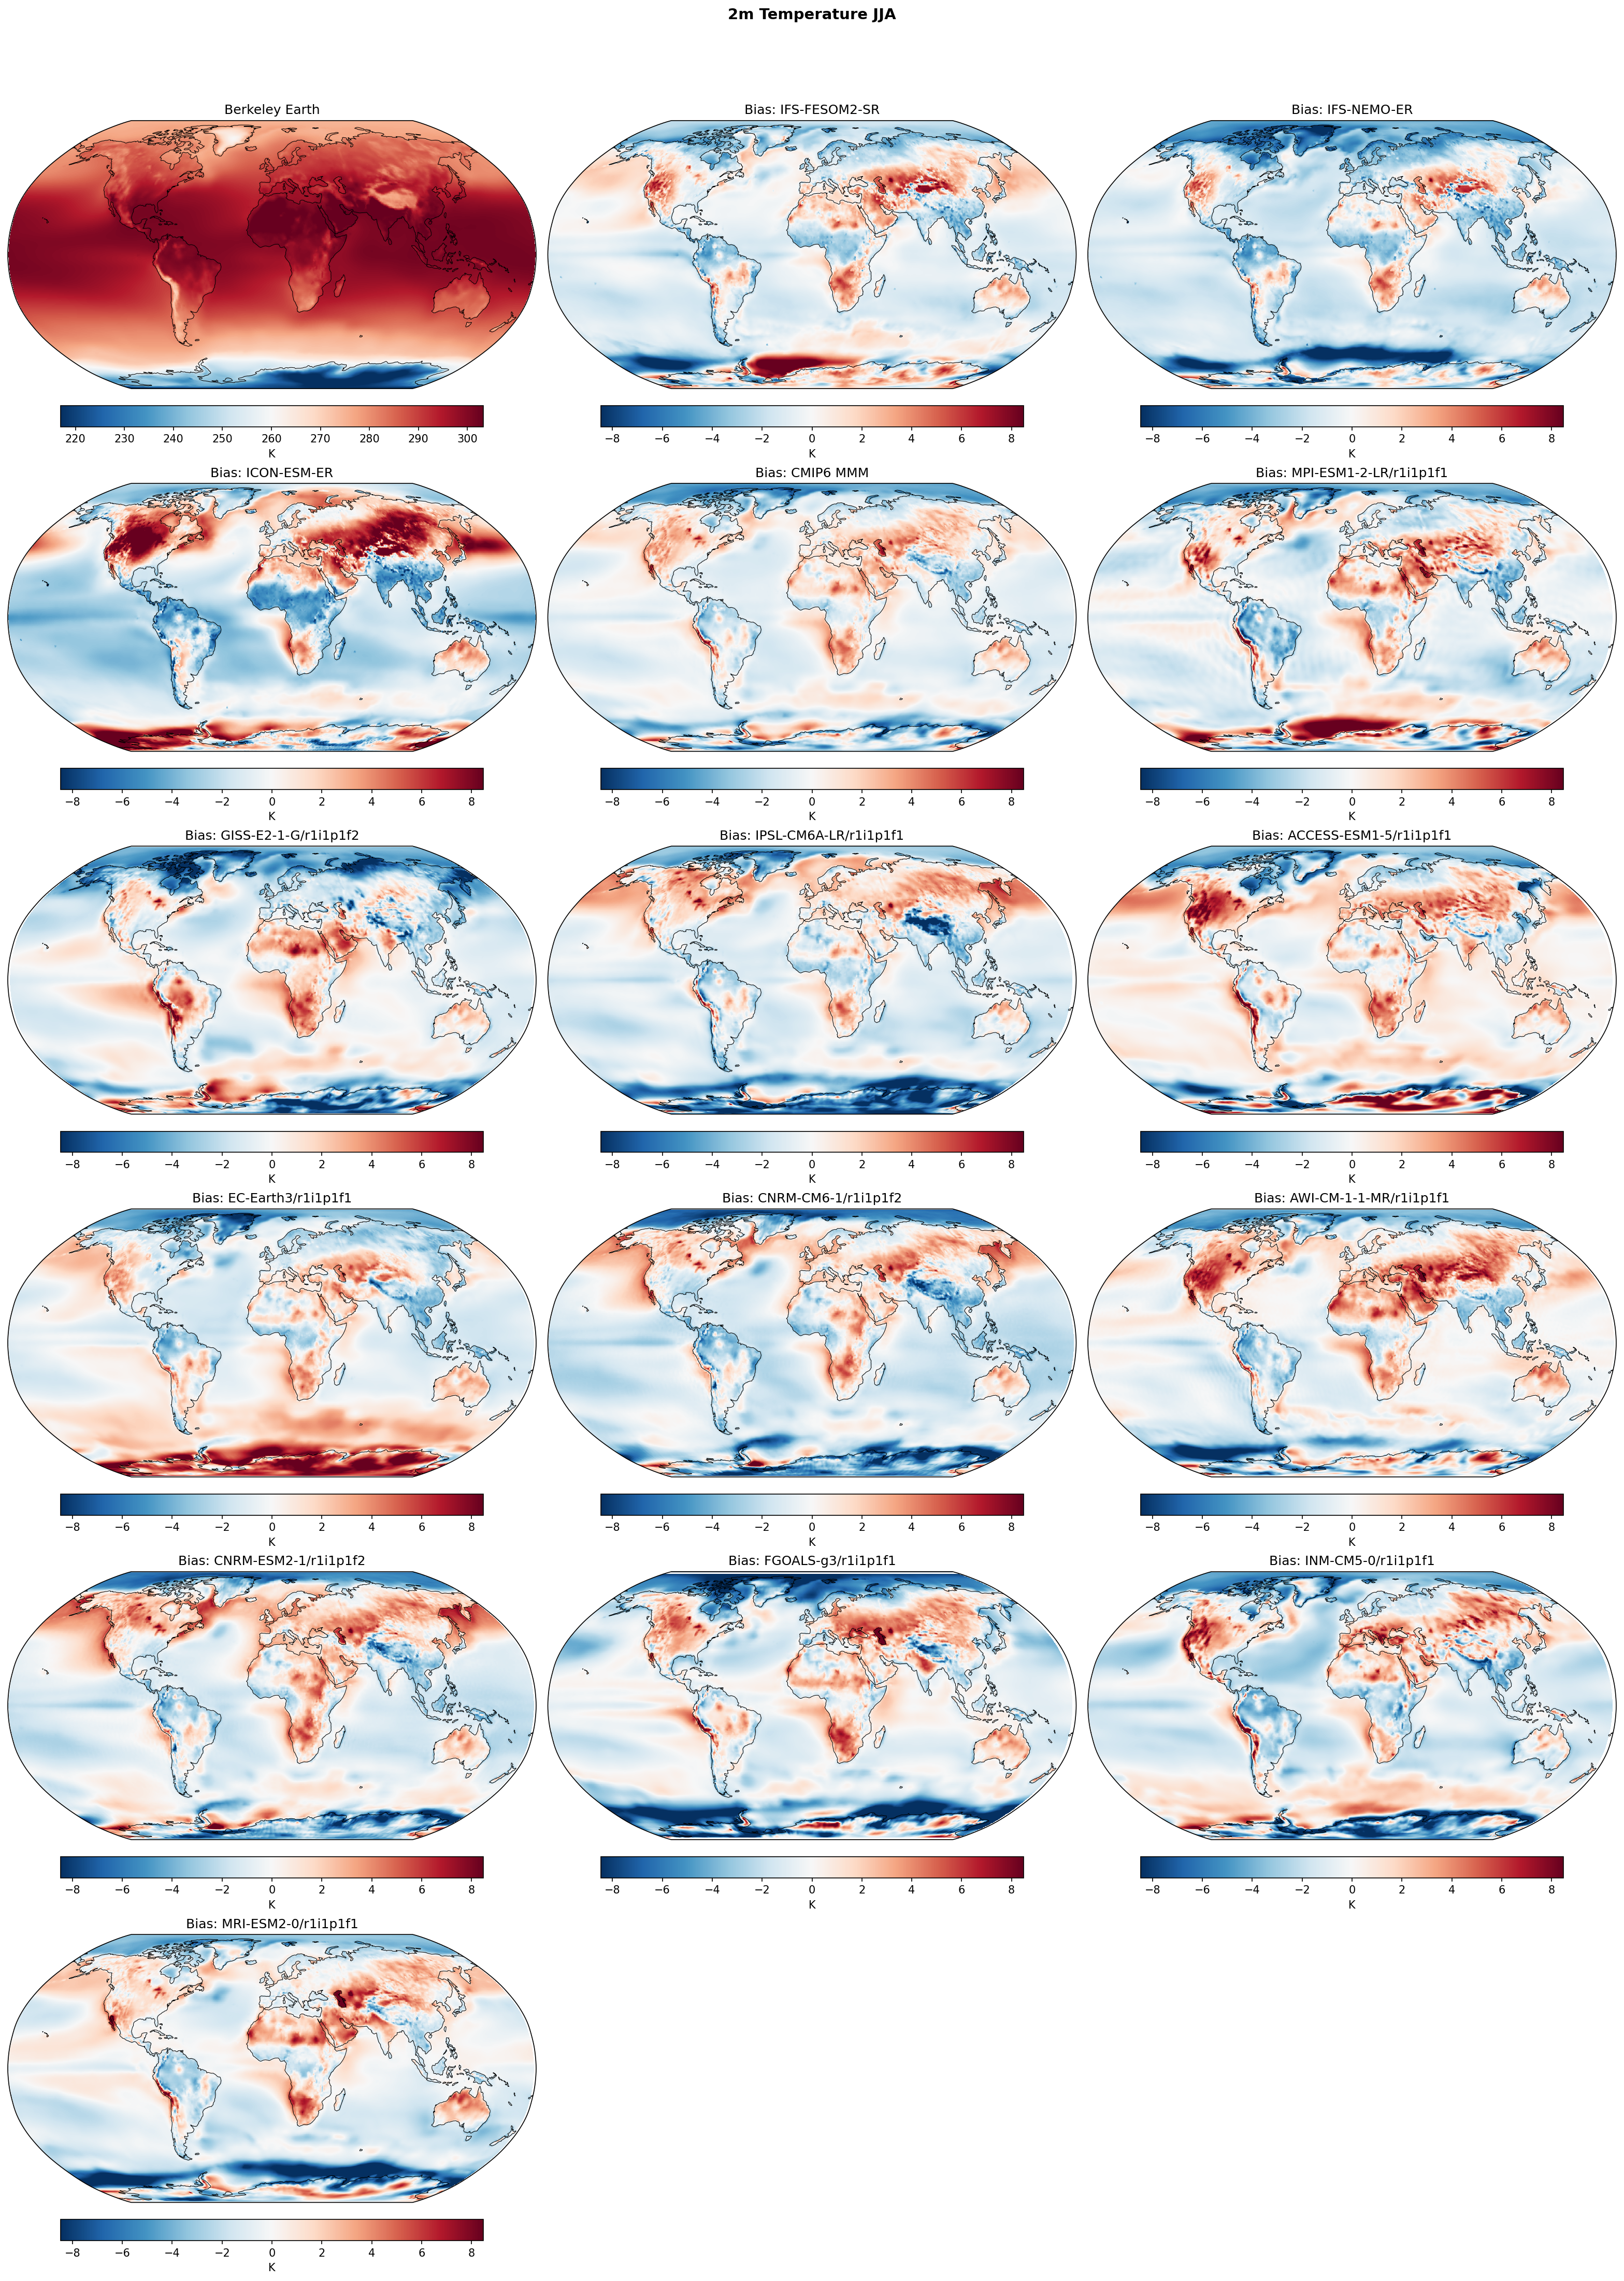
This figure evaluates June-July-August (JJA) 2m temperature biases relative to Berkeley Earth for high-resolution EERIE models (IFS, ICON, HadGEM3) alongside the CMIP6 ensemble. The analysis reveals persistent systemic biases, including widespread Northern Hemisphere continental warm biases and a prominent cold anomaly in the North Atlantic, with notable inter-model divergence in the Southern Ocean.
Key Findings
- A persistent cold bias ('warming hole') exists in the North Atlantic south of Greenland across almost all models, including high-resolution simulations, likely linked to AMOC and North Atlantic Current representation.
- Northern Hemisphere landmasses, particularly North America, exhibit widespread warm biases (2–6 K) in summer (JJA) in ICON-ESM-ER, HadGEM3-GC5, and the CMIP6 MMM; however, IFS models show a contrasting cold bias over Central Eurasia.
- Southern Ocean biases diverge significantly: IFS variants and HadGEM3-GC5 show strong warm biases (up to >6 K) during the SH winter, whereas ICON-ESM-ER displays a pronounced cold bias in the same region.
- Tropical Pacific biases vary, with IFS models showing a cold bias extending along the equator (strengthened cold tongue), while the CMIP6 MMM retains classic warm biases in eastern boundary upwelling regions (e.g., off Peru and Africa), which appear somewhat reduced in magnitude in the eddy-rich IFS simulations.
Spatial Patterns
The maps display a characteristic hemispheric asymmetry in biases. The Northern Hemisphere (summer) is dominated by continental warm biases in models like ICON and HadGEM3, while the Southern Hemisphere (winter) shows marked zonal banding in biases over the Southern Ocean. The North Atlantic cold blob is a spatially robust feature across the multi-model ensemble.
Model Agreement
High agreement exists regarding the North Atlantic cold bias and the broad warm bias over North America. There is significant disagreement in the Southern Ocean (IFS/HadGEM3 warm vs. ICON cold) and Eurasian landmasses (ICON/HadGEM3 warm vs. IFS cold). IFS-FESOM2-SR and IFS-NEMO-ER show remarkably similar patterns, suggesting the atmospheric component dominates the surface flux errors.
Physical Interpretation
The NH summer warm biases likely stem from deficiencies in land-surface coupling (e.g., premature soil drying reducing evaporative cooling) or cloud radiative effect errors (excessive incoming shortwave). The North Atlantic cold bias is classically associated with AMOC strength or incorrect Gulf Stream separation. Southern Ocean warm biases in winter (JJA) suggest insufficient sea ice formation or excessive vertical mixing bringing warm deep water to the surface, possibly exacerbated by cloud phase errors.
Caveats
- Berkeley Earth interpolates over oceans using SSTs and air temperature relationships; coastal or sea-ice edge discrepancies might be influenced by interpolation artifacts.
- JJA represents summer in NH and winter in SH, so different physical mechanisms (radiative vs. sea-ice/insulation) drive the biases in each hemisphere.
2m Temperature Seasonal Cycle
| Variables | tas |
|---|---|
| Models | IFS-FESOM2-SR, IFS-NEMO-ER, ICON-ESM-ER, HadGEM3-GC5, MPI-ESM1-2-LR, GISS-E2-1-G, IPSL-CM6A-LR, ACCESS-ESM1-5, EC-Earth3, CNRM-CM6-1, AWI-CM-1-1-MR, CNRM-ESM2-1, FGOALS-g3, INM-CM5-0, MRI-ESM2-0 |
| Reference Dataset | Berkeley Earth |
| Units | K |
| Period | 1980–2014 |
Summary high
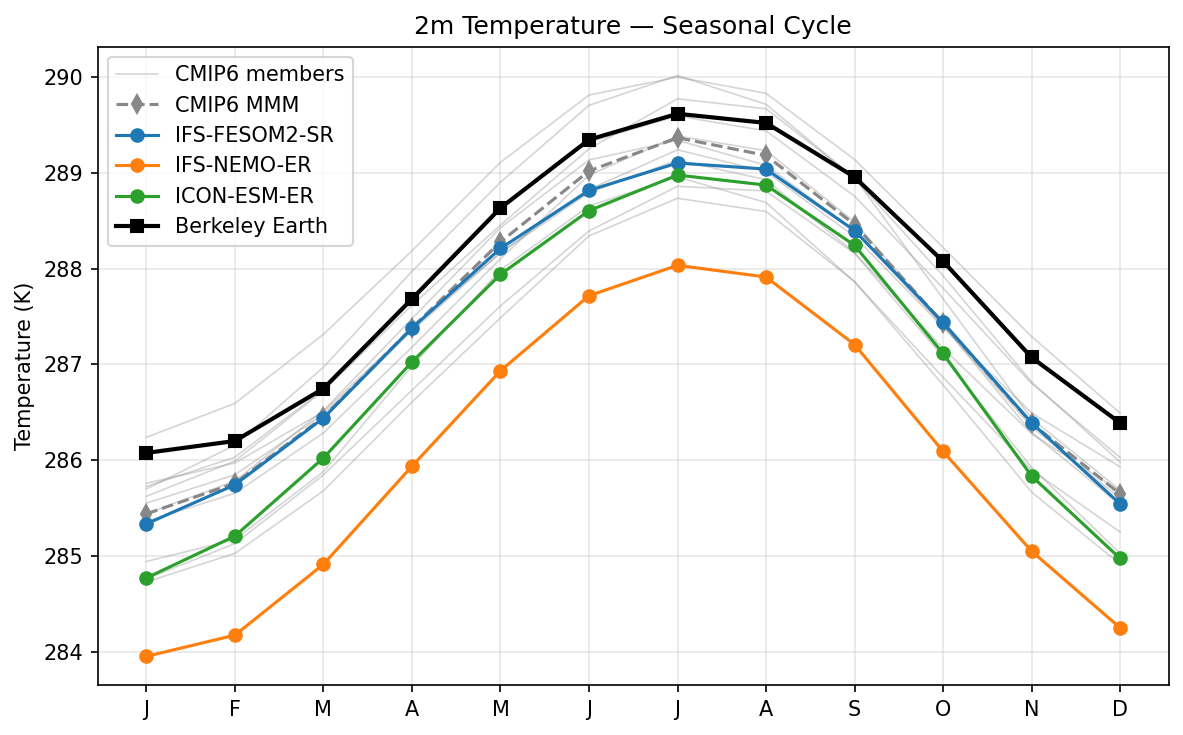
The figure illustrates the climatological seasonal cycle of global mean 2m temperature for EERIE models compared to Berkeley Earth observations and the CMIP6 ensemble.
Key Findings
- All models correctly capture the phase of the seasonal cycle, driven by Northern Hemisphere landmass dominance, with a minimum in January and maximum in July.
- IFS-NEMO-ER exhibits a severe systematic cold bias of approximately 2 K throughout the year compared to observations.
- HadGEM3-GC5 matches observations well in boreal winter but overestimates summer temperatures, resulting in an exaggerated seasonal amplitude.
- IFS-FESOM2-SR and ICON-ESM-ER show a consistent cold bias of ~0.5–1.0 K, tracking closely with or slightly below the CMIP6 Multi-Model Mean.
Spatial Patterns
While spatially aggregated, the seasonal signal reflects the hemispheric asymmetry in land-ocean distribution; the global peak in July confirms the dominance of the Northern Hemisphere land cycle in determining global mean temperature variability.
Model Agreement
High agreement on phase across all models. Significant disagreement on the mean state, with a spread of over 2 K between the warmest (HadGEM3-GC5) and coldest (IFS-NEMO-ER) models. Most high-resolution models (except HadGEM3) lie below the observational reference.
Physical Interpretation
The amplified seasonal cycle in HadGEM3-GC5 suggests excessive summertime warming over Northern Hemisphere landmasses, possibly linked to land-surface coupling or cloud radiative feedbacks. The pervasive cold bias in IFS-NEMO-ER points to a fundamental deficit in the global energy budget or initialization issues, rather than a seasonal process error. The general cold bias of the CMIP6 MMM and several EERIE models relative to Berkeley Earth may also reflect differences in observational coverage (e.g., polar gaps) or near-surface temperature definitions.
Caveats
- Global mean values can obscure compensating regional biases (e.g., Arctic warming vs. tropical cooling).
- Differences in 2m temperature diagnostics over ice/ocean between models and the Berkeley Earth extrapolation methodology may contribute to mean-state offsets.
Taylor Diagram — 2m Temperature
| Variables | tas |
|---|---|
| Models | IFS-FESOM2-SR, IFS-NEMO-ER, ICON-ESM-ER, HadGEM3-GC5, CMIP6 MMM |
| Reference Dataset | Berkeley Earth |
| Units | K |
| Period | 1980–2014 |
| IFS-FESOM2-SR_ANN | Corr: 0.99 · Std Ratio: 0.96 |
| IFS-FESOM2-SR_DJF | Corr: 0.98 · Std Ratio: 0.98 |
| IFS-FESOM2-SR_JJA | Corr: 0.99 · Std Ratio: 1.00 |
| IFS-NEMO-ER_ANN | Corr: 0.99 · Std Ratio: 1.04 |
| IFS-NEMO-ER_DJF | Corr: 0.99 · Std Ratio: 1.05 |
| IFS-NEMO-ER_JJA | Corr: 0.99 · Std Ratio: 1.04 |
| ICON-ESM-ER_ANN | Corr: 0.99 · Std Ratio: 0.91 |
| ICON-ESM-ER_DJF | Corr: 0.98 · Std Ratio: 0.93 |
| ICON-ESM-ER_JJA | Corr: 0.97 · Std Ratio: 0.96 |
| HadGEM3-GC5_ANN | Corr: 0.99 · Std Ratio: 1.01 |
| HadGEM3-GC5_DJF | Corr: 0.99 · Std Ratio: 1.02 |
| HadGEM3-GC5_JJA | Corr: 0.99 · Std Ratio: 1.01 |
Summary high
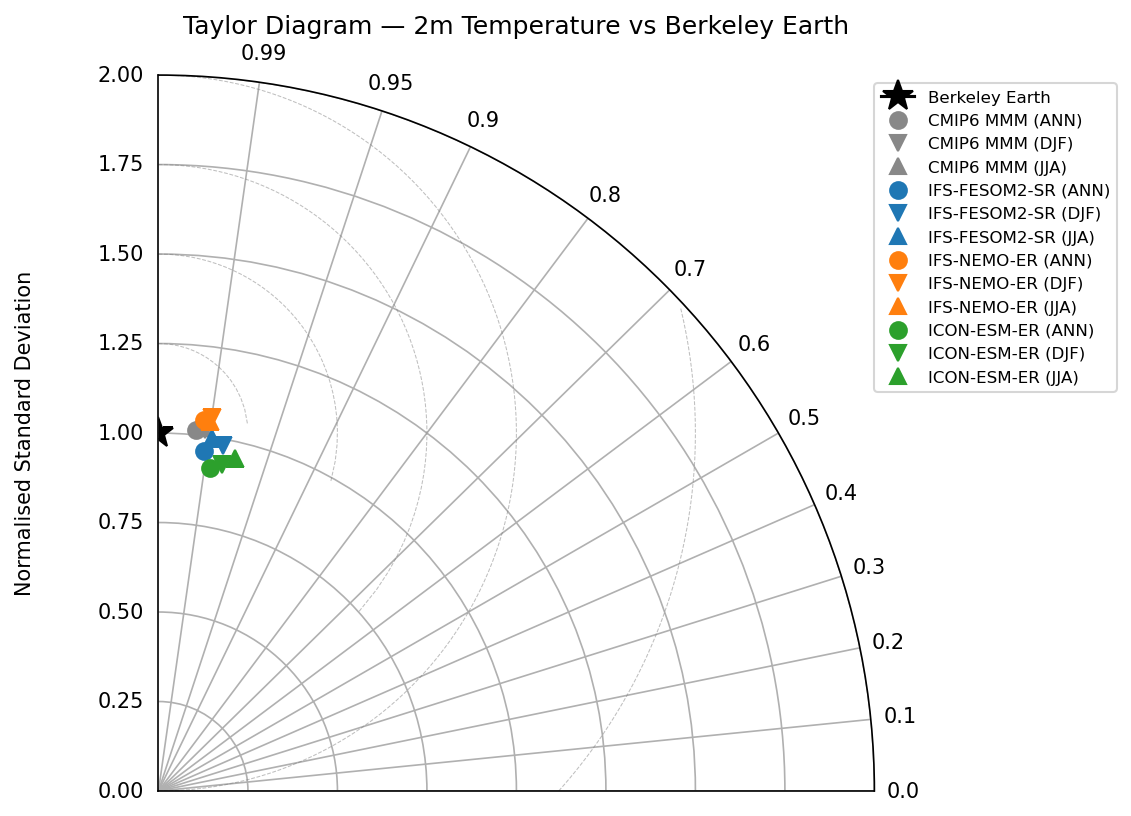
This Taylor diagram assesses the spatial fidelity of modeled 2m temperature climatologies against Berkeley Earth, demonstrating that all evaluated high-resolution models capture global patterns with high skill (correlations > 0.97). HadGEM3-GC5 performs best, nearly overlapping with the observational reference, while other models diverge primarily in the amplitude of their spatial variance.
Key Findings
- HadGEM3-GC5 shows exceptional agreement with observations, effectively matching the reference point with annual correlations >0.994 and a normalized standard deviation within 0.5% of unity.
- ICON-ESM-ER systematically underestimates spatial standard deviation (ratio ~0.91–0.95), indicating it produces 'flatter' spatial temperature gradients (e.g., weaker pole-to-equator contrast) than observed.
- IFS-NEMO-ER tends to overestimate spatial variability (ratio ~1.04–1.05), whereas IFS-FESOM2-SR and the CMIP6 MMM are slightly under-dispersive (ratios < 1.0).
Spatial Patterns
The diagram reveals a distinct clustering by model family regarding spatial variance: IFS-NEMO exhibits amplified gradients (outside the reference arc), while ICON and IFS-FESOM exhibit damped gradients (inside the reference arc). Seasonal performance (triangles) generally shows slightly lower correlations and larger RMS errors compared to the annual mean (circles), but differences are small.
Model Agreement
Inter-model agreement on pattern correlation is very high (>0.97 for all), reflecting the robust capture of the fundamental latitudinal temperature gradient. The primary divergence is in the normalized standard deviation (radial axis), with a clear ordering of spatial variance intensity: IFS-NEMO > Obs > HadGEM3 > IFS-FESOM > ICON.
Physical Interpretation
Since 2m temperature patterns are dominated by solar forcing (latitude) and land-sea contrast, the high correlations are expected. Deviations in standard deviation likely stem from the strength of the simulated equator-to-pole gradient. ICON's low variance implies a reduced gradient (potentially due to warm polar biases or insufficient continental cooling), while IFS-NEMO's high variance suggests a steeper gradient or more extreme regional anomalies.
Caveats
- Taylor diagrams center the data, removing the mean bias. A model could appear perfect here (at 1.0, 1.0) despite having a large global mean cold or warm bias.
- Global 2m temperature is a first-order variable strongly constrained by geometry; high skill scores are standard for GCMs.
2m Temperature Global Mean Time Series
| Variables | tas |
|---|---|
| Models | IFS-FESOM2-SR, IFS-NEMO-ER, ICON-ESM-ER, HadGEM3-GC5, MPI-ESM1-2-LR, GISS-E2-1-G, IPSL-CM6A-LR, ACCESS-ESM1-5, EC-Earth3, CNRM-CM6-1, AWI-CM-1-1-MR, CNRM-ESM2-1, FGOALS-g3, INM-CM5-0, MRI-ESM2-0 |
| Reference Dataset | Berkeley Earth |
| Units | K |
| Period | 1980–2014 |
Summary high
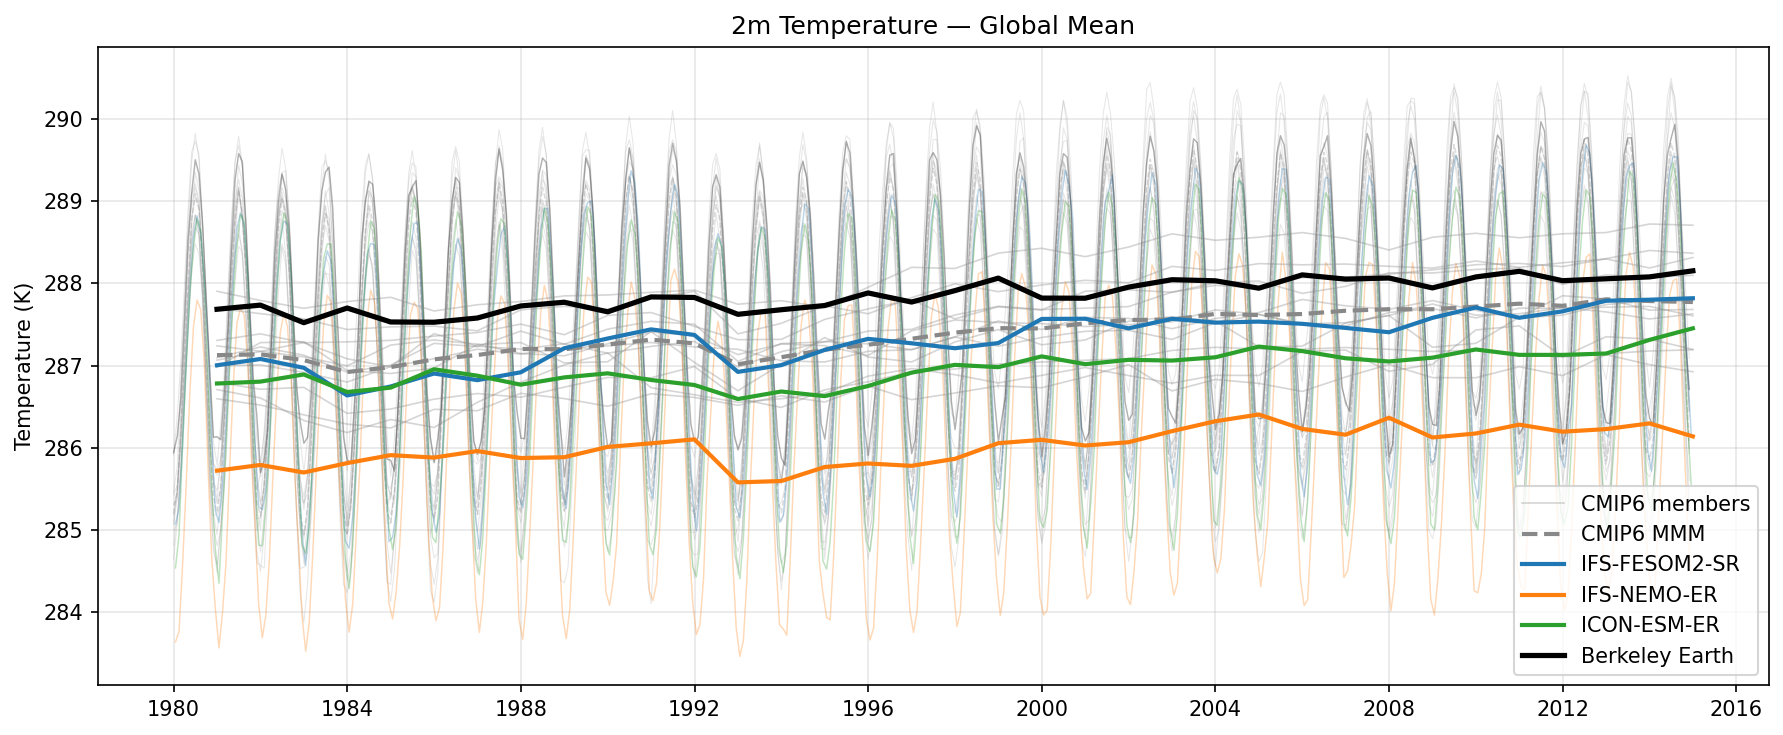
Global mean 2m temperature time series (1980–2014) comparing four high-resolution coupled models against Berkeley Earth observations and the CMIP6 ensemble. Most evaluated models exhibit a systematic cold bias of 0.5–2.0 K, while HadGEM3-GC5 aligns closely with observations but exhibits a stronger warming trend.
Key Findings
- IFS-NEMO-ER, ICON-ESM-ER, and IFS-FESOM2-SR show distinct cold biases relative to Berkeley Earth, with IFS-NEMO-ER being the coldest (~2 K bias).
- HadGEM3-GC5 starts with a mean state very close to observations (~287.7 K) but warms faster than the observed rate after 2000, ending roughly 0.5 K warmer.
- All models clearly reproduce the transient cooling associated with the 1991 Mt. Pinatubo eruption.
- IFS-FESOM2-SR is systematically warmer (~1 K) than IFS-NEMO-ER, despite sharing the same atmospheric component, highlighting the ocean model's role in setting the global mean thermal state.
Spatial Patterns
N/A (Global mean time series). Temporally, the seasonal cycle amplitude appears consistent across models. The Mt. Pinatubo cooling event (1991–1993) is a distinct temporal feature captured by all simulations.
Model Agreement
There is a large spread in the absolute global mean temperature (approx. 2.5 K range) between the coldest (IFS-NEMO-ER) and warmest (HadGEM3-GC5) models. However, the inter-annual variability and general warming trends are broadly consistent, with HadGEM3-GC5 showing the highest sensitivity.
Physical Interpretation
The widespread cold bias (relative to Berkeley Earth) suggests potential issues in global energy budget tuning (e.g., planetary albedo) or ocean heat uptake efficiency. The divergence between IFS-NEMO and IFS-FESOM indicates that ocean formulation (grid/mixing) strongly influences the equilibrium surface temperature. The accelerated warming in HadGEM3-GC5 suggests higher climate sensitivity or weaker aerosol cooling offsets compared to the other models.
Caveats
- Global mean metrics can mask significant compensating regional biases (e.g., warm Southern Ocean vs cold Northern Hemisphere).
- Differences in definition between model TAS (2m air temperature) and observational blending of air/SST can contribute to apparent biases.
2m Temperature Trends (Antarctic (<50°S))
| Variables | tas |
|---|---|
| Models | IFS-FESOM2-SR, IFS-NEMO-ER, ICON-ESM-ER, HadGEM3-GC5, CMIP6 MMM |
| Reference Dataset | Berkeley Earth |
| Units | K |
| Period | 1980–2014 |
| Method | Linear OLS regression per grid point, x10 for K/decade |
Summary high
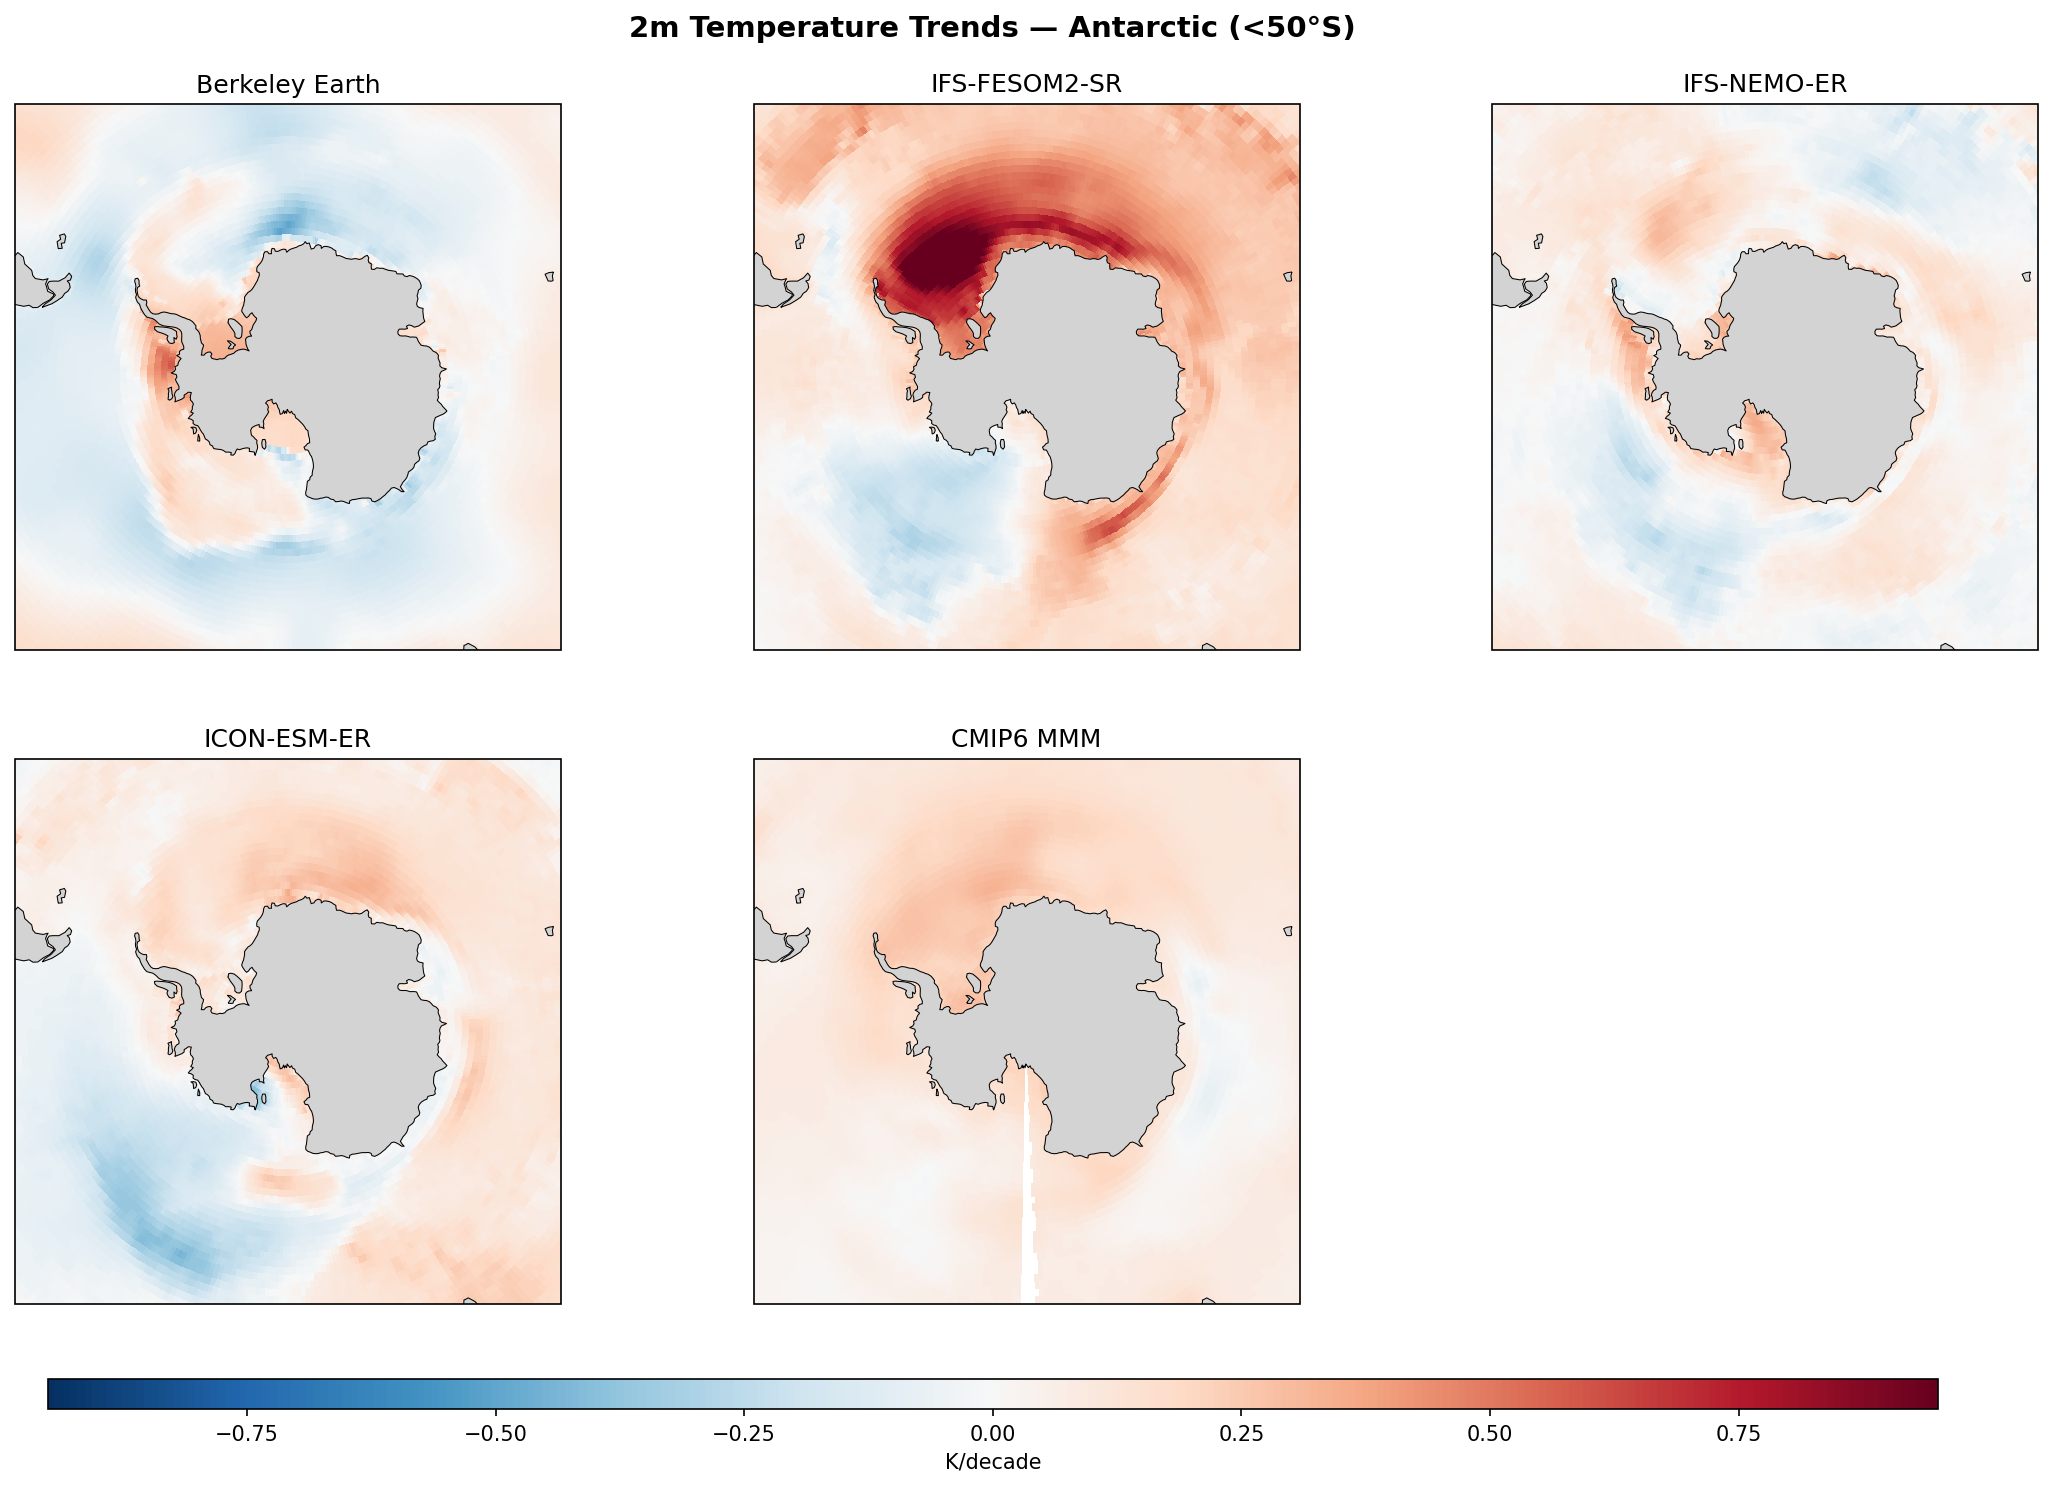
This figure evaluates linear trends in Antarctic (<50°S) 2m temperature (1980–2014) for four high-resolution models and the CMIP6 multi-model mean against Berkeley Earth observations. It highlights significant discrepancies in regional warming patterns and the presence of intense, likely spurious, localized warming features in specific models.
Key Findings
- Berkeley Earth observations show a heterogeneous trend pattern: slight warming over the Antarctic Peninsula and parts of the Southern Ocean, contrasting with cooling in the Ross Sea and Pacific sector.
- IFS-FESOM2-SR exhibits a massive, unrealistic warming trend (>1.0 K/decade) centered in the Weddell Sea, diverging sharply from observations.
- HadGEM3-GC5 displays a similarly intense, unobserved warming feature off the coast of East Antarctica (Australian sector), while ICON-ESM-ER shows strong cooling in the Pacific/Ross Sea sector.
- The CMIP6 Multi-Model Mean (MMM) shows a smooth, weak background warming, failing to capture the observed regional cooling dynamics, likely due to averaging out internal variability.
Spatial Patterns
Observations reveal a zonal asymmetry (dipole) with cooling in the Pacific sector and weak warming elsewhere. In contrast, the high-resolution models produce highly localized, intense trend features: IFS-FESOM2-SR in the Weddell Gyre, HadGEM3-GC5 in the Indian Ocean sector, and ICON-ESM-ER amplifying the Ross Sea cooling. IFS-NEMO-ER presents the most muted patterns, lacking the extreme hotspots of its counterparts.
Model Agreement
Inter-model agreement is poor. The models disagree on the sign and location of peak trends. While IFS-NEMO-ER and ICON-ESM-ER capture the general lack of strong warming better than others, IFS-FESOM2-SR and HadGEM3-GC5 contain large regional outliers not seen in observations or the CMIP6 ensemble.
Physical Interpretation
The extreme localized warming hotspots in IFS-FESOM2-SR (Weddell Sea) and HadGEM3-GC5 (East Antarctica) are characteristic signatures of excessive open-ocean deep convection (polynyas). In these models, the breakdown of stratification likely brings warm Circumpolar Deep Water to the surface, melting sea ice and releasing heat to the atmosphere. The observed cooling in the Ross Sea is dynamically driven (likely by the Southern Annular Mode and Amundsen Sea Low variability), a feature partially captured by ICON-ESM-ER but smoothed out in the CMIP6 MMM.
Caveats
- The analysis period (1980–2014) is dominated by strong internal variability in the Antarctic, making single model realizations difficult to compare directly to observations without ensemble contexts.
- Deep convection events (polynyas) can be intermittent; a linear trend might exaggerate the signal if a polynya opened or closed near the start/end of the period.
2m Temperature Trends (Arctic (>50°N))
| Variables | tas |
|---|---|
| Models | IFS-FESOM2-SR, IFS-NEMO-ER, ICON-ESM-ER, HadGEM3-GC5, CMIP6 MMM |
| Reference Dataset | Berkeley Earth |
| Units | K |
| Period | 1980–2014 |
| Method | Linear OLS regression per grid point, x10 for K/decade |
Summary high
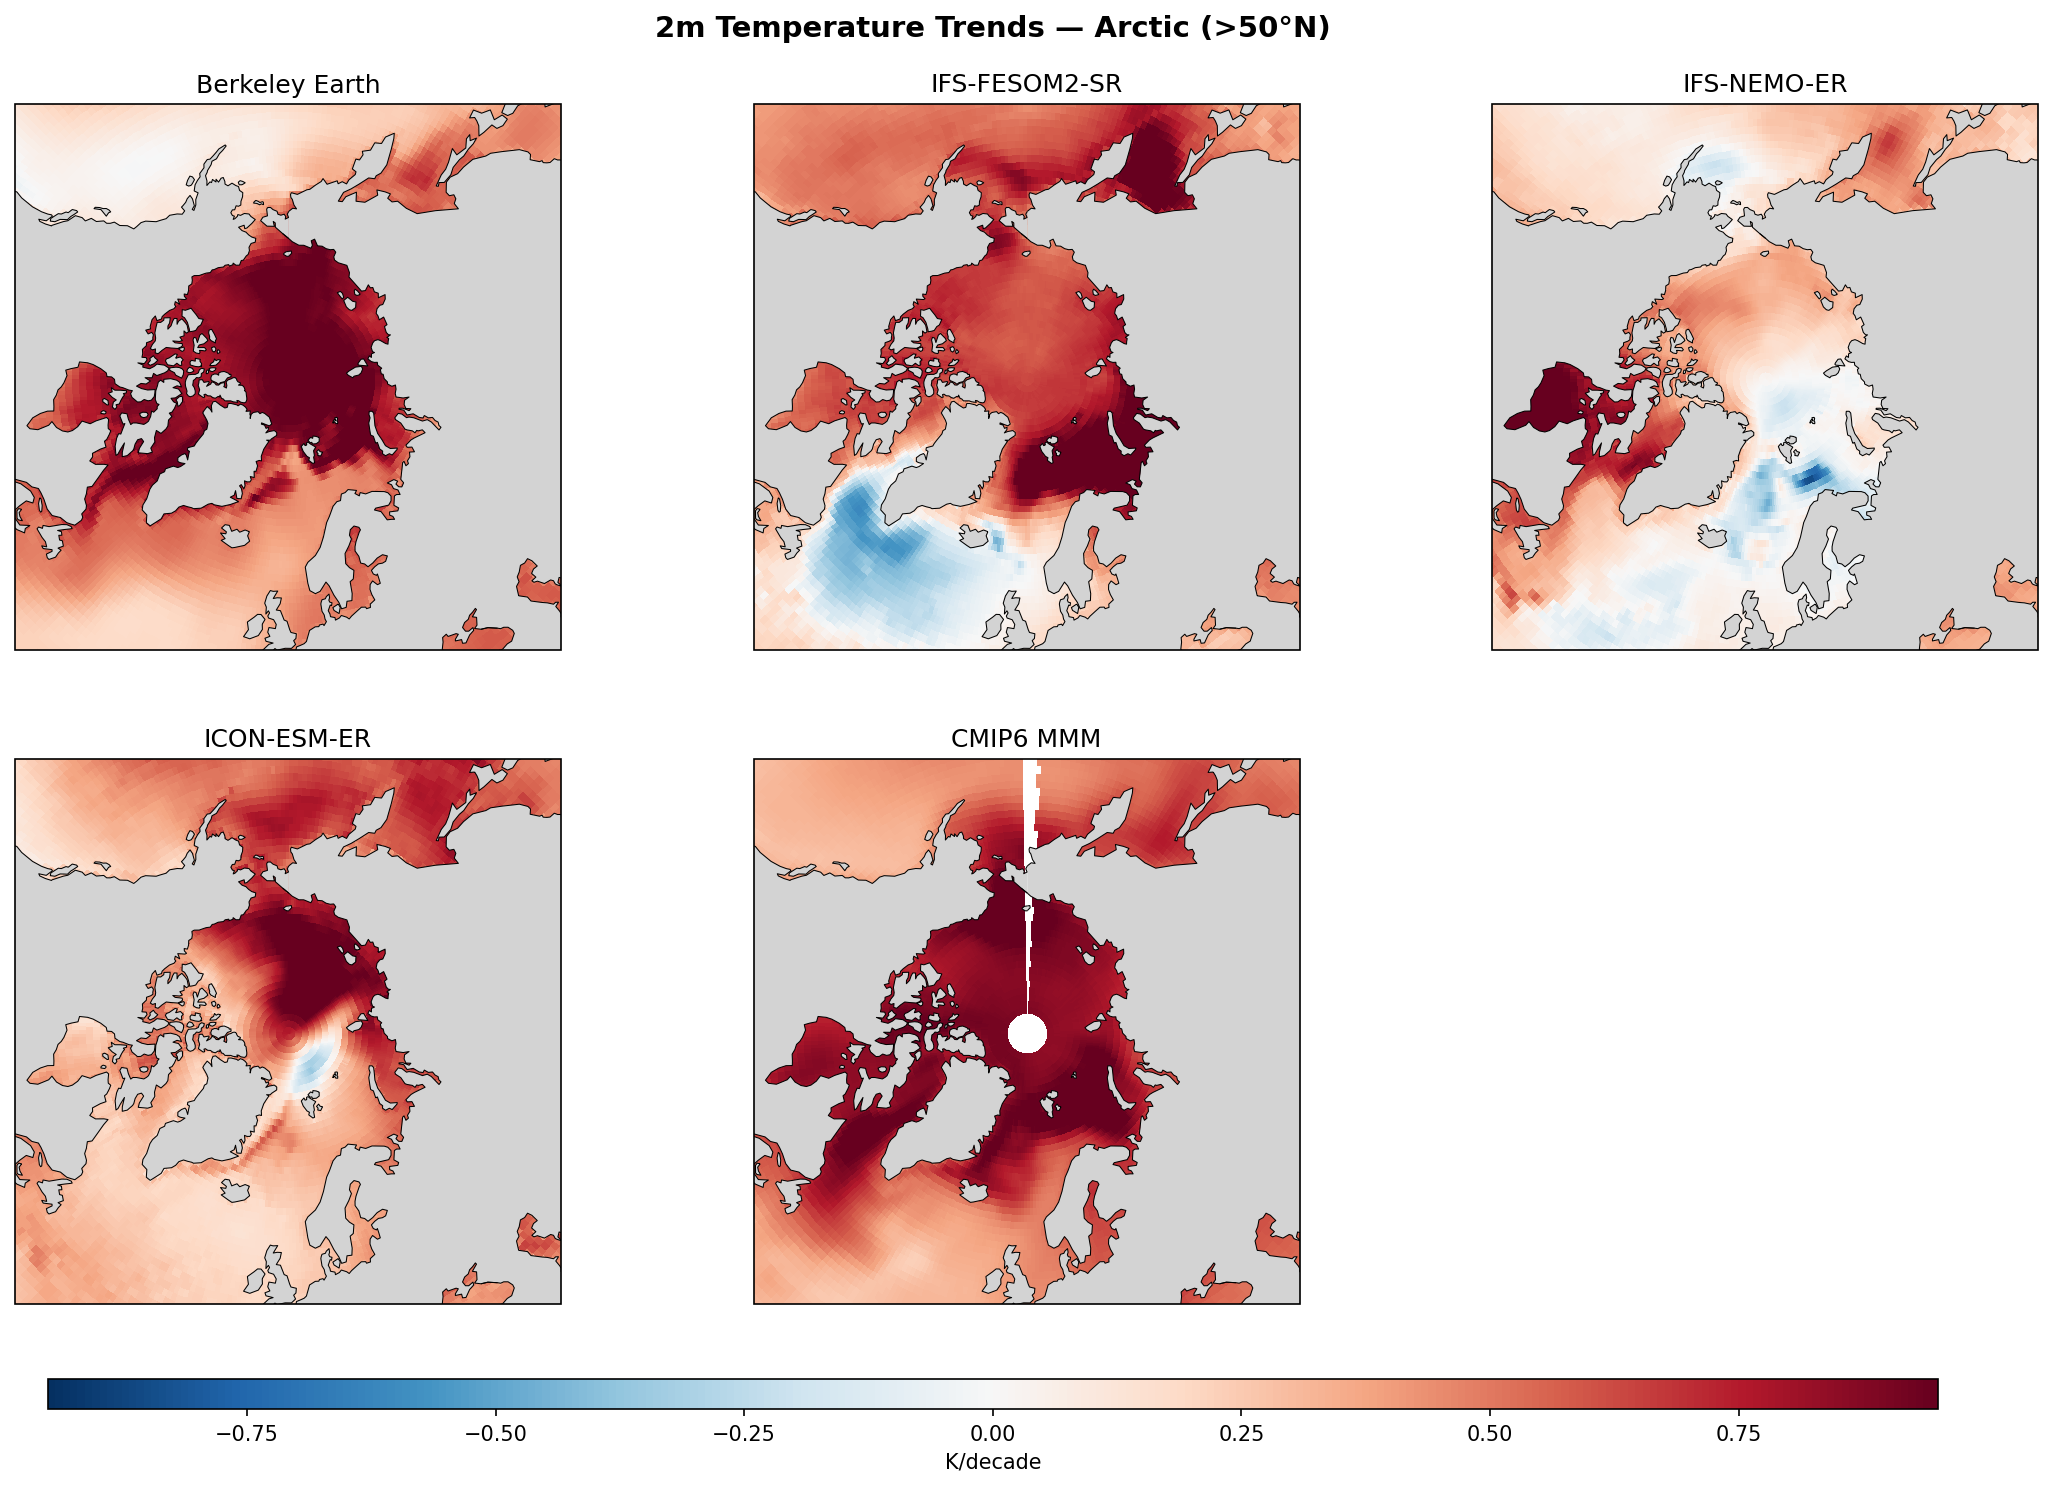
This figure evaluates linear trends in 2m temperature (1980–2014) across the Arctic (>50°N), comparing four high-resolution models against Berkeley Earth observations and the CMIP6 Multi-Model Mean. While observations show robust Arctic Amplification focused in the Barents-Kara region, the models exhibit large divergences in magnitude and spatial structure, ranging from widespread overheating (HadGEM3) to underestimation (IFS-NEMO).
Key Findings
- HadGEM3-GC5 displays excessive Arctic Amplification, with warming trends >1.0 K/decade covering nearly the entire Arctic Ocean, significantly exceeding observations.
- IFS-NEMO-ER underestimates Arctic warming, showing weak trends in the central Arctic and distinct cooling patches in the Greenland and Barents Seas, contrary to the strong observed warming.
- IFS-FESOM2-SR captures the Barents-Kara warming hotspot but exhibits a prominent and likely exaggerated cooling trend (North Atlantic warming hole) in the subpolar North Atlantic south of Greenland.
- CMIP6 MMM closely matches the observational pattern of Arctic Amplification, particularly the warming maximum in the Barents-Kara sector, smoothing out the internal variability seen in individual high-res realizations.
Spatial Patterns
Berkeley Earth shows a classic Arctic Amplification pattern with maxima (>1 K/decade) in the Barents and Kara Seas (associated with sea ice loss) and broad warming over land. IFS-FESOM2-SR reproduces the Barents-Kara signal but juxtaposes it with strong cooling in the North Atlantic (blue blob). ICON-ESM-ER shows a focused warming pattern but with a localized cooling anomaly in the Nordic Seas. HadGEM3-GC5 extends the extreme warming signal across the entire polar cap.
Model Agreement
Inter-model agreement is low regarding the magnitude of Arctic warming. HadGEM3-GC5 and IFS-NEMO-ER represent opposite extremes (too hot vs. too cold/weak). The CMIP6 MMM provides a better match to the observational spatial structure than most individual high-res simulations, likely due to ensemble averaging cancelling out internal variability.
Physical Interpretation
The intense warming trends (red) are primarily driven by the ice-albedo feedback, where sea ice retreat exposes darker ocean water; HadGEM3 likely has excessive ice loss while IFS-NEMO likely retains too much ice. The cooling trend in the subpolar North Atlantic (visible in IFS-FESOM2-SR and to a lesser extent in observations) is associated with the 'warming hole,' often linked to AMOC slowdown or subpolar gyre dynamics, which can be exaggerated in high-resolution ocean models due to adjustment drifts.
Caveats
- Trends are calculated over a relatively short 35-year period (1980-2014), making them susceptible to internal climate variability (e.g., IPO, AMO) in single-realization runs.
- The linear trend assumption may not capture accelerating warming rates in the latter part of the record.
2m Temperature Warming Trends
| Variables | tas |
|---|---|
| Models | IFS-FESOM2-SR, IFS-NEMO-ER, ICON-ESM-ER, HadGEM3-GC5, CMIP6 MMM |
| Reference Dataset | Berkeley Earth |
| Units | K |
| Period | 1980–2014 |
| Method | Linear OLS regression per grid point, x10 for K/decade |
Summary high
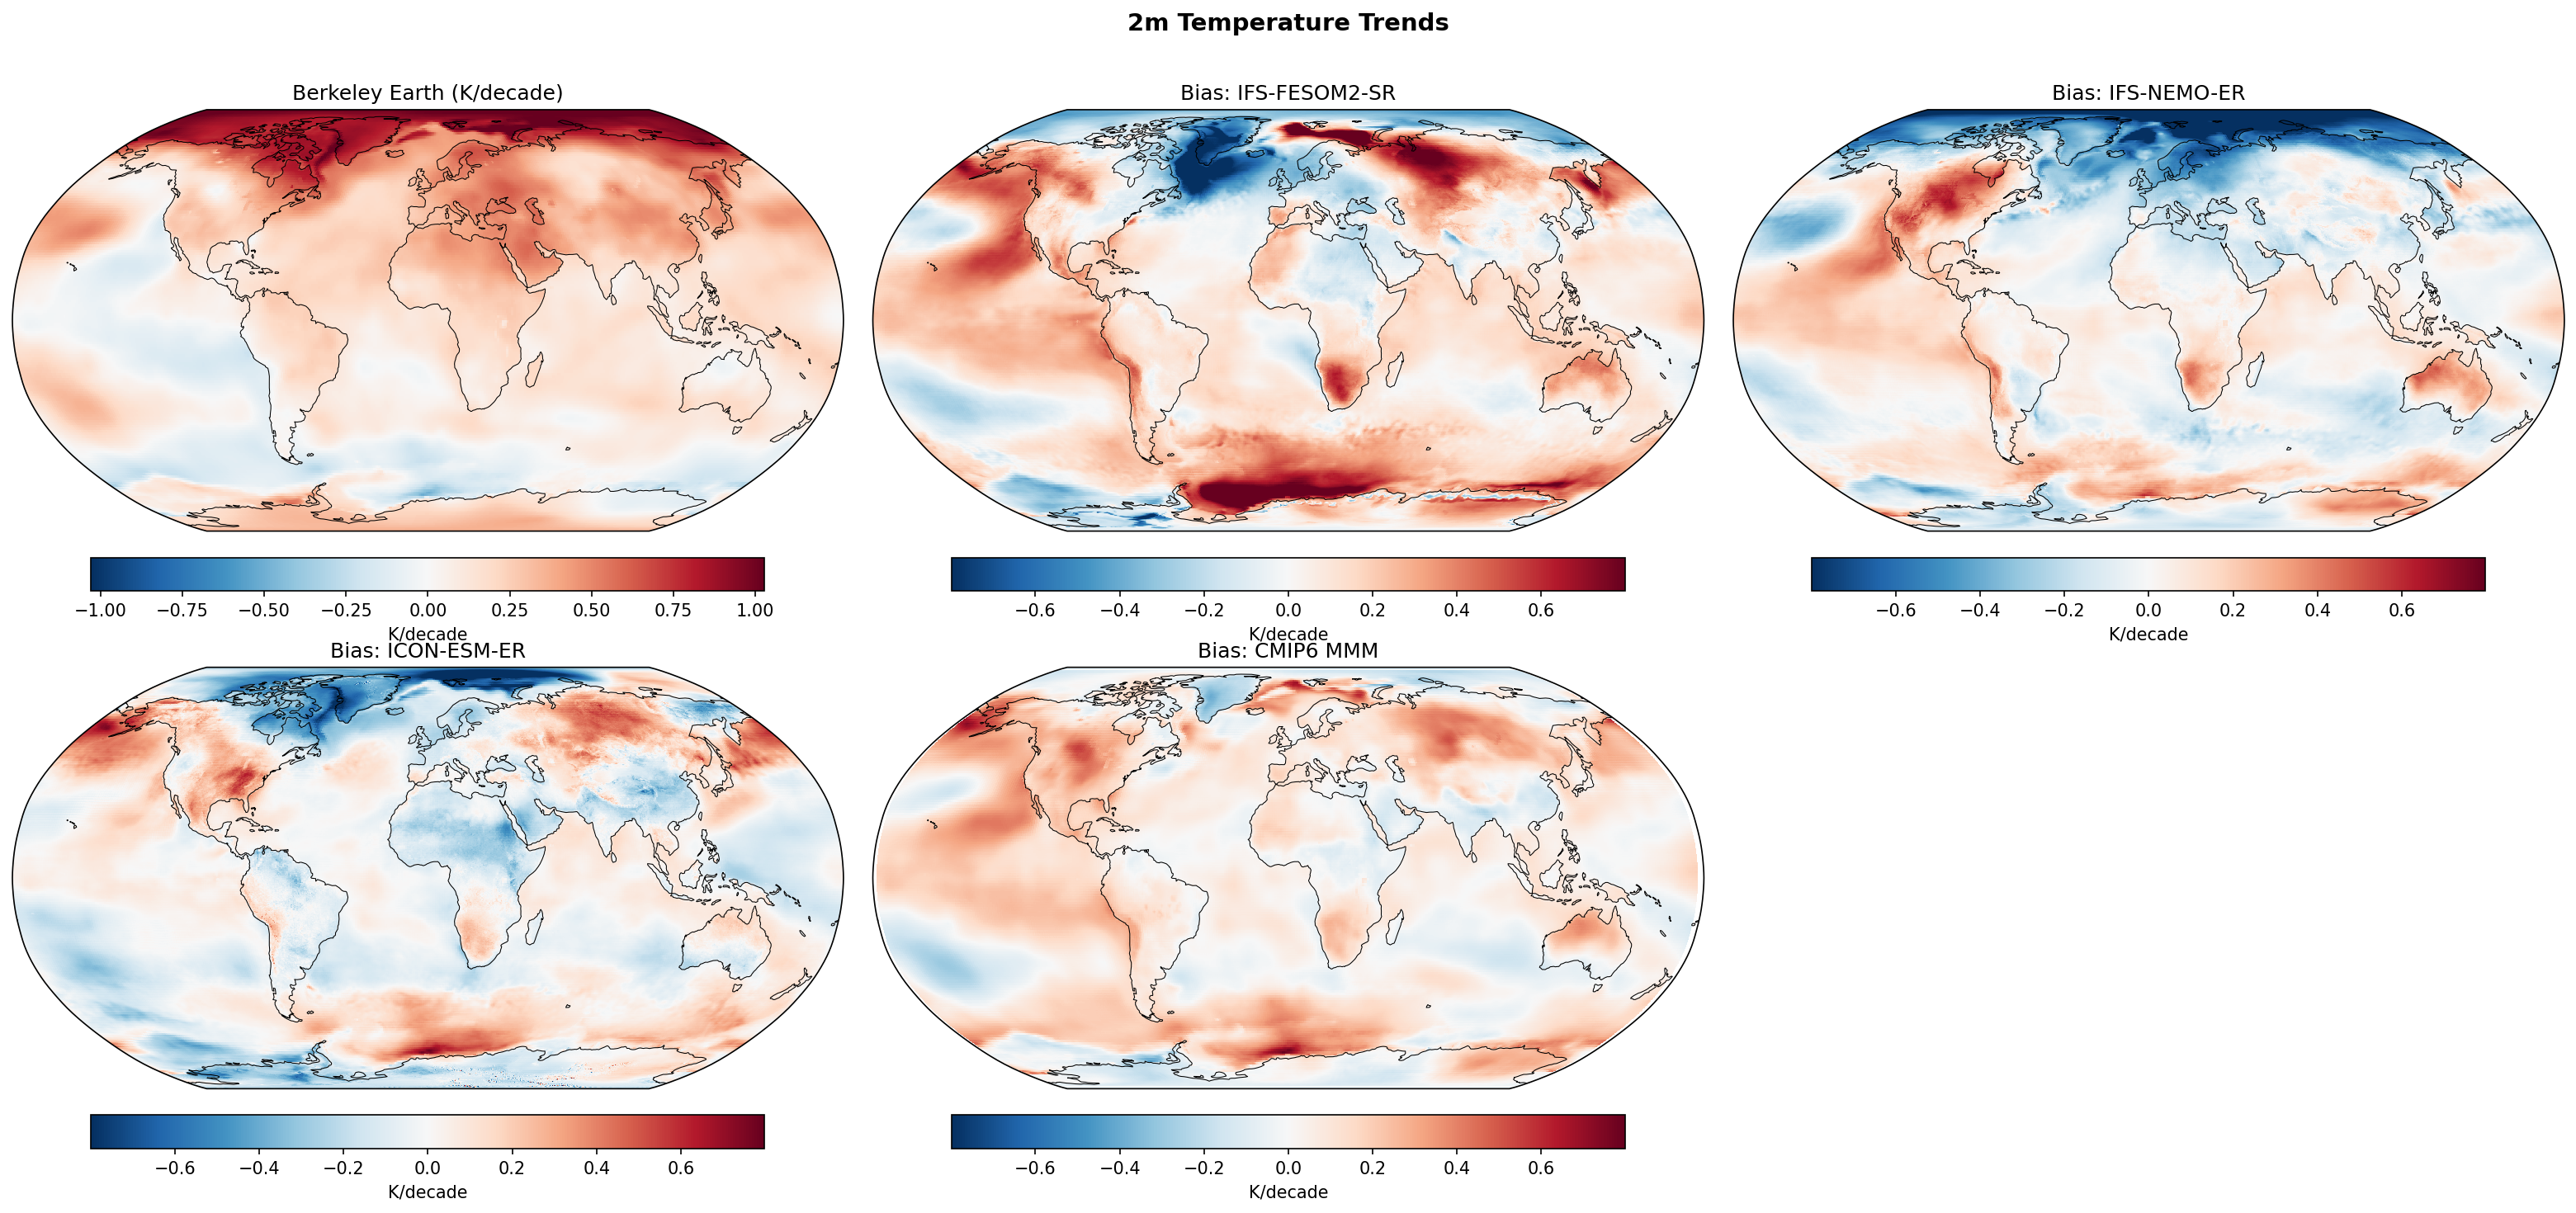
This figure evaluates linear trends in 2-meter temperature over the 1980–2014 period, comparing four high-resolution models and the CMIP6 multi-model mean against Berkeley Earth observations. While the observations show strong Arctic amplification and a distinct North Atlantic 'warming hole', the models exhibit diverse biases in capturing the magnitude and spatial distribution of these trends.
Key Findings
- HadGEM3-GC5 shows a strong positive trend bias in the Arctic (>0.75 K/decade), indicating a significant overestimation of Arctic Amplification compared to observations.
- IFS-FESOM2-SR exhibits a striking dipole bias: an exaggerated cooling trend in the North Atlantic (amplifying the observed 'warming hole') and excessive warming in the Weddell Sea/Southern Ocean.
- ICON-ESM-ER and IFS-NEMO-ER generally display negative trend biases (blue colors) globally, particularly in the Arctic and over continents, suggesting they underestimate the rate of recent warming.
- The CMIP6 MMM displays a characteristic 'warming bias' in the Eastern Tropical Pacific and Southern Ocean, reflecting the ensemble's inability to capture the observed cooling/neutral trends associated with internal variability (e.g., negative IPO) during this specific period.
Spatial Patterns
Observations show intense warming in the Arctic (>1 K/decade) and parts of Eurasia, with a localized cooling trend in the North Atlantic subpolar gyre. Model biases are regionally structured: IFS-FESOM2-SR concentrates errors in the Atlantic and Southern Oceans; HadGEM3-GC5 biases are focused at the poles (over-warming); and ICON-ESM-ER shows a diffuse under-warming pattern across most land masses.
Model Agreement
Inter-model agreement is low regarding Arctic trends, with HadGEM3-GC5 overshooting and ICON/IFS-NEMO undershooting the observed warming rate. In the Eastern Pacific, the high-resolution models (particularly ICON and IFS-NEMO) show smaller biases than the CMIP6 MMM, which shows a strong spurious warming trend. IFS-FESOM2-SR is an outlier in the North Atlantic, producing a much stronger cooling signal than any other model or the observations.
Physical Interpretation
The exaggerated North Atlantic cooling in IFS-FESOM2-SR suggests an excessive slowdown of the Atlantic Meridional Overturning Circulation (AMOC) or issues with deep convection parameterization in the subpolar gyre. The varying Arctic signals likely stem from differences in sea-ice albedo feedbacks; HadGEM3-GC5 likely experiences excessive sea ice loss, amplifying warming. The widespread red bias in the CMIP6 MMM Pacific reflects the mismatch between forced model responses and the observed phase of decadal variability (PDO/IPO) which induced cooling in the tropical Pacific during 1980–2014.
Caveats
- Trends are calculated over a 35-year period (1980–2014), which is heavily influenced by internal decadal variability (e.g., PDO, AMO), complicating the separation of forced climate change signals from internal noise.
- The CMIP6 MMM benefits from ensemble averaging which cancels out internal variability noise, whereas individual high-res realizations include their own internal variability phases that may not align with observations.
2m Temperature Zonal Mean Profile
| Variables | tas |
|---|---|
| Models | CMIP6 MMM, IFS-FESOM2-SR, IFS-NEMO-ER, ICON-ESM-ER, HadGEM3-GC5 |
| Reference Dataset | Berkeley Earth |
| Units | K |
| Period | 1980–2014 |
Summary high
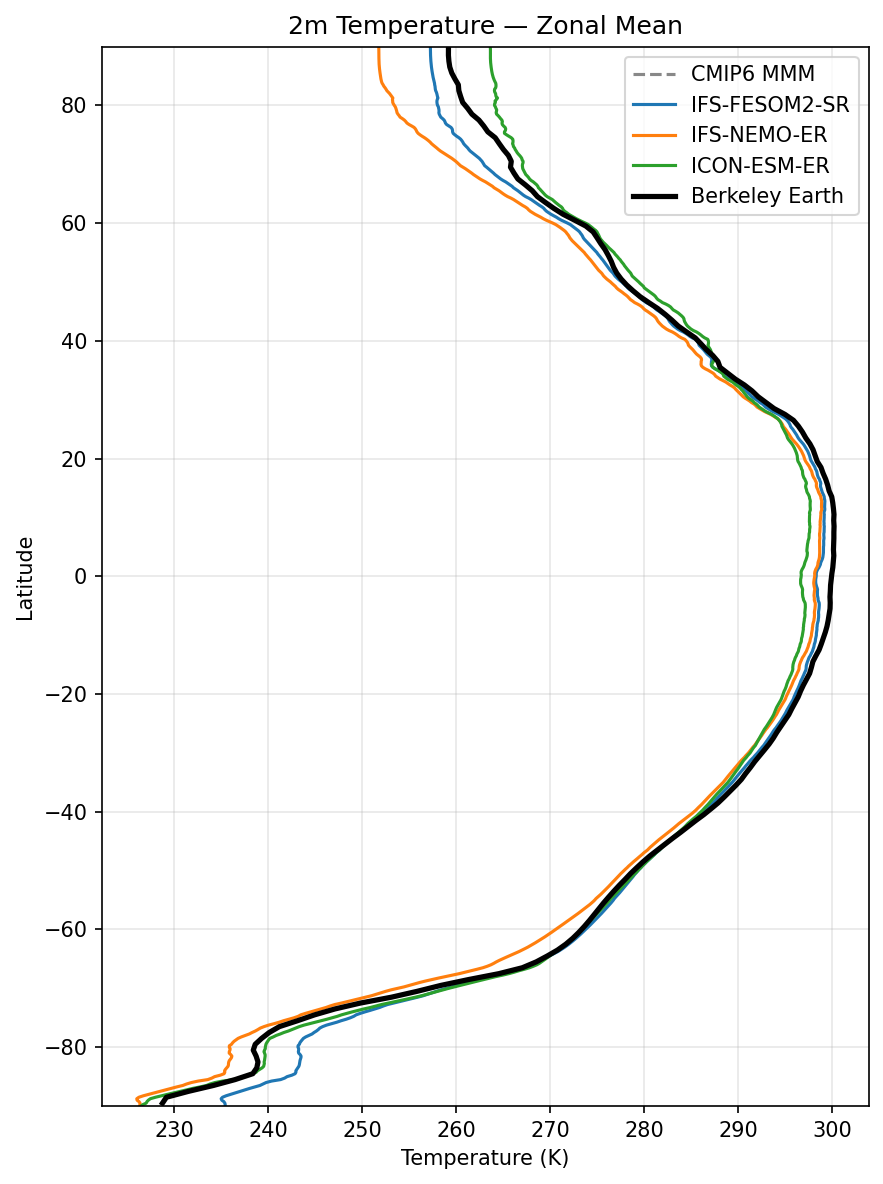
This figure presents the zonal mean 2m temperature profile (1980–2014) for four high-resolution climate models compared to Berkeley Earth observations and the CMIP6 multi-model mean. While the broad latitudinal temperature gradient is captured by all models, significant deviations occur in the polar regions and the tropics, with inter-model spread maximizing in the Arctic.
Key Findings
- HadGEM3-GC5 shows exceptional agreement with observations across nearly all latitudes, effectively overlapping with the Berkeley Earth reference line.
- Severe cold biases exist in the Arctic (>60°N) for both IFS-based models (IFS-NEMO-ER and IFS-FESOM2-SR), reaching deviations of ~5–10 K below observations, whereas ICON-ESM-ER displays a warm bias in the same region.
- A pervasive cold bias affects the tropics (30°S–30°N) in IFS-FESOM2-SR and ICON-ESM-ER (approx. 2–3 K cooler than obs), while IFS-NEMO-ER is closer to observations.
- IFS-NEMO-ER exhibits a distinct warm bias in the Southern Ocean (~50°S–70°S), while IFS-FESOM2-SR shows a sharp warm anomaly specifically at the South Pole.
Spatial Patterns
The analysis reveals a zonal asymmetry in model performance: the Southern Hemisphere (excluding the deep Southern Ocean in IFS-NEMO) generally sees better agreement than the Northern Hemisphere high latitudes. The 'cold tropics' bias is a dominant feature for the unstructured grid models (ICON, IFS-FESOM).
Model Agreement
HadGEM3-GC5 is the best performing model, closely matching the CMIP6 MMM and observations. The IFS models (NEMO vs FESOM) behave similarly in the Northern Hemisphere (cold bias) but diverge in the Southern Hemisphere. ICON-ESM-ER is the outlier in the Arctic, being too warm while others are too cold.
Physical Interpretation
The large Arctic spread suggests strong sensitivity to sea ice physics and albedo feedbacks; the cold bias in IFS models implies excessive sea ice or weak atmospheric heat transport, while ICON's warm bias suggests the inverse. The tropical cold bias in IFS-FESOM and ICON likely relates to excessive equatorial upwelling or cloud radiative cooling errors. The Southern Ocean warm bias in IFS-NEMO is a known issue often attributed to insufficient supercooled liquid clouds allowing excessive shortwave radiation to reach the surface.
Caveats
- Zonal averaging obscures regional biases, particularly land-sea contrasts which are critical in the mid-latitudes.
- Extreme biases at the poles (90°S/N) may be partially influenced by differences in orography representation and interpolation over ice sheets.