Precipitation Precipitation Evaluation (MSWEP) CMIP6
CMIP6 Multi-Model Mean Context
Comparison with CMIP6 ensemble mean from 11 members.
Contributing models: ACCESS-ESM1-5, AWI-CM-1-1-MR, CNRM-CM6-1, CNRM-ESM2-1, EC-Earth3, FGOALS-g3, GISS-E2-1-G, INM-CM5-0, IPSL-CM6A-LR, MPI-ESM1-2-LR, MRI-ESM2-0
Synthesis
Related diagnostics
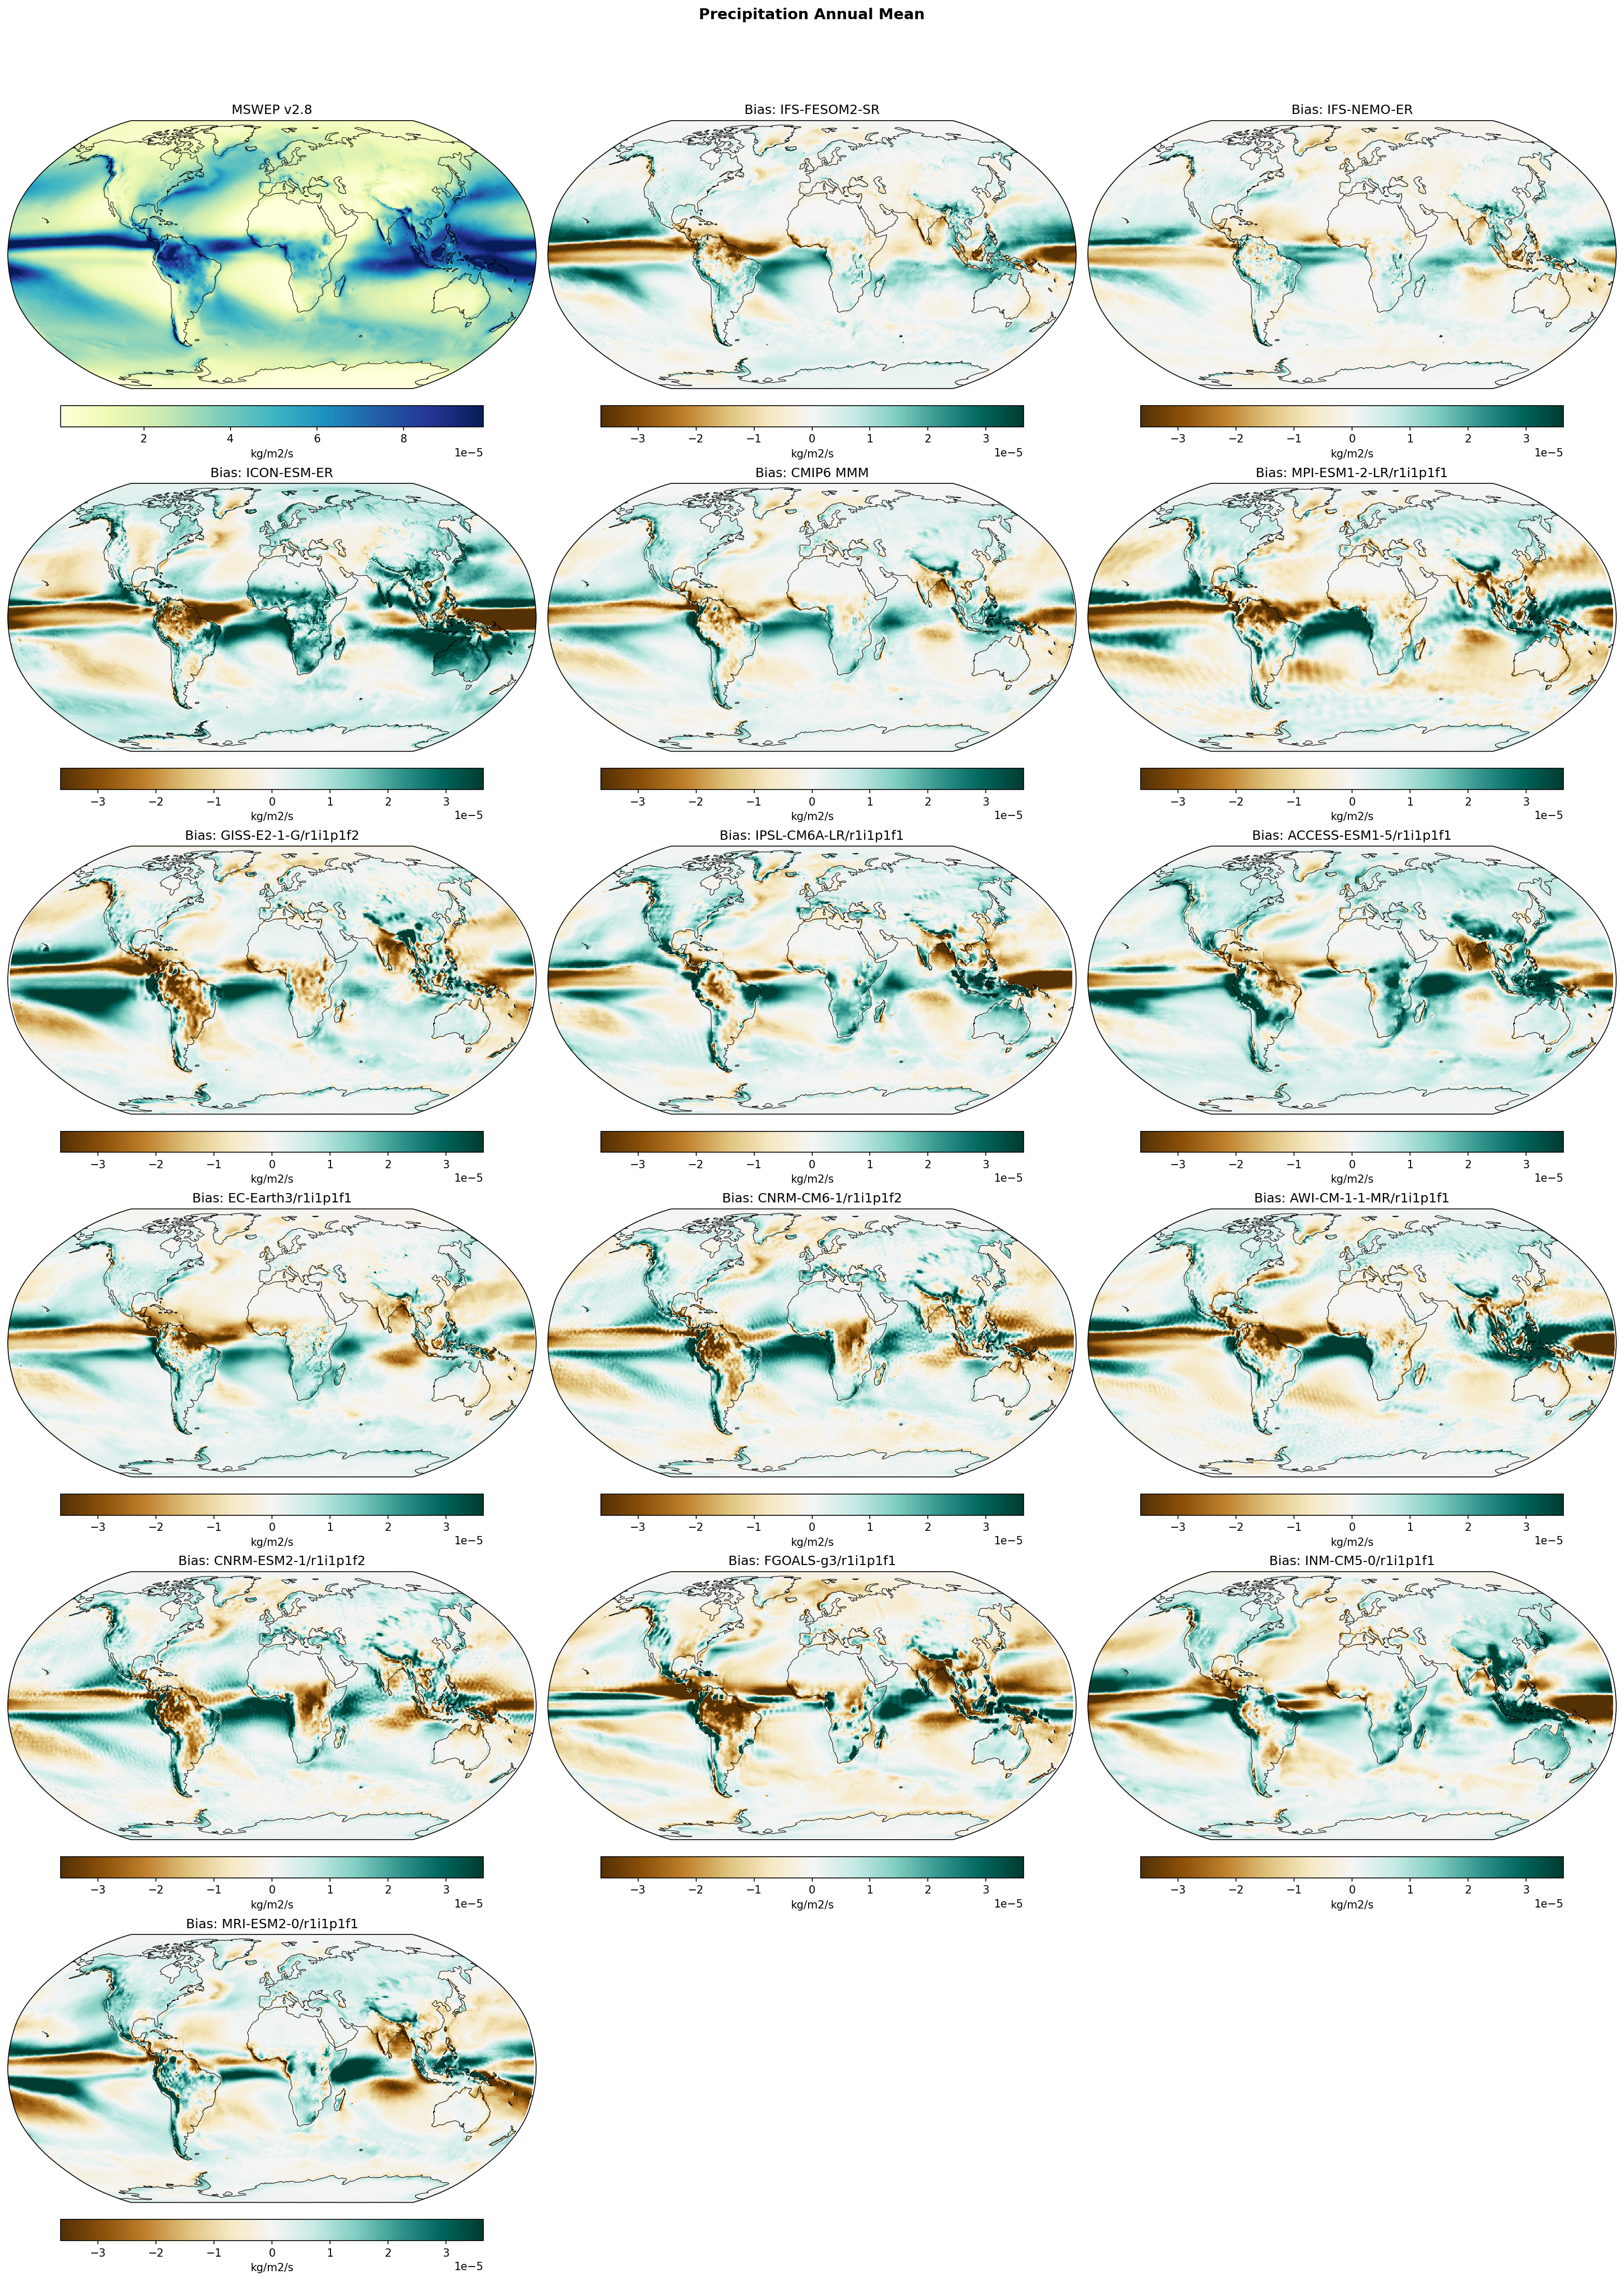
Precipitation Annual Mean Bias
| Variables | pr |
|---|---|
| Models | IFS-FESOM2-SR, IFS-NEMO-ER, ICON-ESM-ER, HadGEM3-GC5, CMIP6 MMM, MPI-ESM1-2-LR/r1i1p1f1, GISS-E2-1-G/r1i1p1f2, IPSL-CM6A-LR/r1i1p1f1, ACCESS-ESM1-5/r1i1p1f1, EC-Earth3/r1i1p1f1, CNRM-CM6-1/r1i1p1f2, AWI-CM-1-1-MR/r1i1p1f1, CNRM-ESM2-1/r1i1p1f2, FGOALS-g3/r1i1p1f1, INM-CM5-0/r1i1p1f1, MRI-ESM2-0/r1i1p1f1 |
| Reference Dataset | MSWEP |
| Units | kg/m2/s |
| Period | 1980–2014 |
| IFS-FESOM2-SR | Global Mean Bias: 0.00 · Rmse: 0.00 · Pattern Correlation: 0.91 · Std Ratio: 1.01 · Tropical Mean Bias: 0.00 · Extratropical Mean Bias: 0.00 |
| IFS-NEMO-ER | Global Mean Bias: 0.00 · Rmse: 0.00 · Pattern Correlation: 0.96 · Std Ratio: 1.10 · Tropical Mean Bias: 0.00 · Extratropical Mean Bias: 0.00 |
| ICON-ESM-ER | Global Mean Bias: 0.00 · Rmse: 0.00 · Pattern Correlation: 0.77 · Std Ratio: 1.15 · Tropical Mean Bias: 0.00 · Extratropical Mean Bias: 0.00 |
| HadGEM3-GC5 | Global Mean Bias: 0.00 · Rmse: 0.00 · Pattern Correlation: 0.91 · Std Ratio: 1.15 · Tropical Mean Bias: 0.00 · Extratropical Mean Bias: 0.00 |
| CMIP6 MMM | Global Mean Bias: 0.00 · Rmse: 0.00 |
Summary high
High-resolution IFS-NEMO-ER demonstrates remarkable skill, significantly outperforming IFS-FESOM2-SR, ICON-ESM-ER, and the CMIP6 multi-model mean by effectively minimizing the pervasive double-ITCZ bias. While IFS-FESOM2-SR retains typical coupled model errors (Amazon drying, Pacific double ITCZ), ICON-ESM-ER exhibits a strong systematic global wet bias.
Key Findings
- IFS-NEMO-ER achieves the highest pattern correlation (0.96) and lowest RMSE (0.79e-5 kg/m²/s), largely resolving the double-ITCZ bias that plagues most CMIP6 models.
- IFS-FESOM2-SR exhibits classic structural biases: a prominent southern ITCZ band in the Pacific, severe drying over the Amazon, and wet biases in the western Indian Ocean, resembling the CMIP6 Mean state.
- ICON-ESM-ER is an outlier with a large global wet bias (4.1e-6 kg/m²/s, ~4x that of IFS models) and overly intense/broad precipitation bands in the tropics.
- The Amazon 'dry bias', a common feature in CMIP6 (e.g., MPI-ESM, ACCESS, EC-Earth), is present in IFS-FESOM2-SR but absent in IFS-NEMO-ER, which instead shows a slight wet bias over the Andes.
Spatial Patterns
The most distinct feature is the 'Double ITCZ'—a spurious band of precipitation south of the equator in the Pacific. It is strong in IFS-FESOM2-SR, ICON-ESM-ER, and CMIP6 MMM, but faint in IFS-NEMO-ER. ICON shows excessive precipitation across the entire tropical belt (Atlantic and Pacific) and Indian Ocean. IFS-FESOM2-SR displays a dipole in the Indian Ocean (wet West, dry East/Maritime Continent).
Model Agreement
IFS-NEMO-ER shows the best agreement with MSWEP observations. IFS-FESOM2-SR aligns closely with the CMIP6 ensemble behavior (pattern correlation ~0.91). ICON-ESM-ER diverges significantly due to its systematic wet offset (pattern correlation ~0.77).
Physical Interpretation
The stark difference between IFS-NEMO-ER and IFS-FESOM2-SR (assuming similar atmospheric physics but different ocean components/grids) suggests that the eddy-rich ocean resolution (NEMO-ER) or specific air-sea coupling setup is crucial for maintaining correct tropical SST gradients, thereby suppressing the spurious southern convection branch (Double ITCZ). The systematic wetness in ICON suggests untuned convective microphysics or parameterization at this resolution.
Caveats
- Differences in specific resolution configurations (SR vs ER) between the IFS variants may confound the comparison of ocean model impact (FESOM vs NEMO).
- MSWEP observations have higher uncertainty over open oceans compared to land.
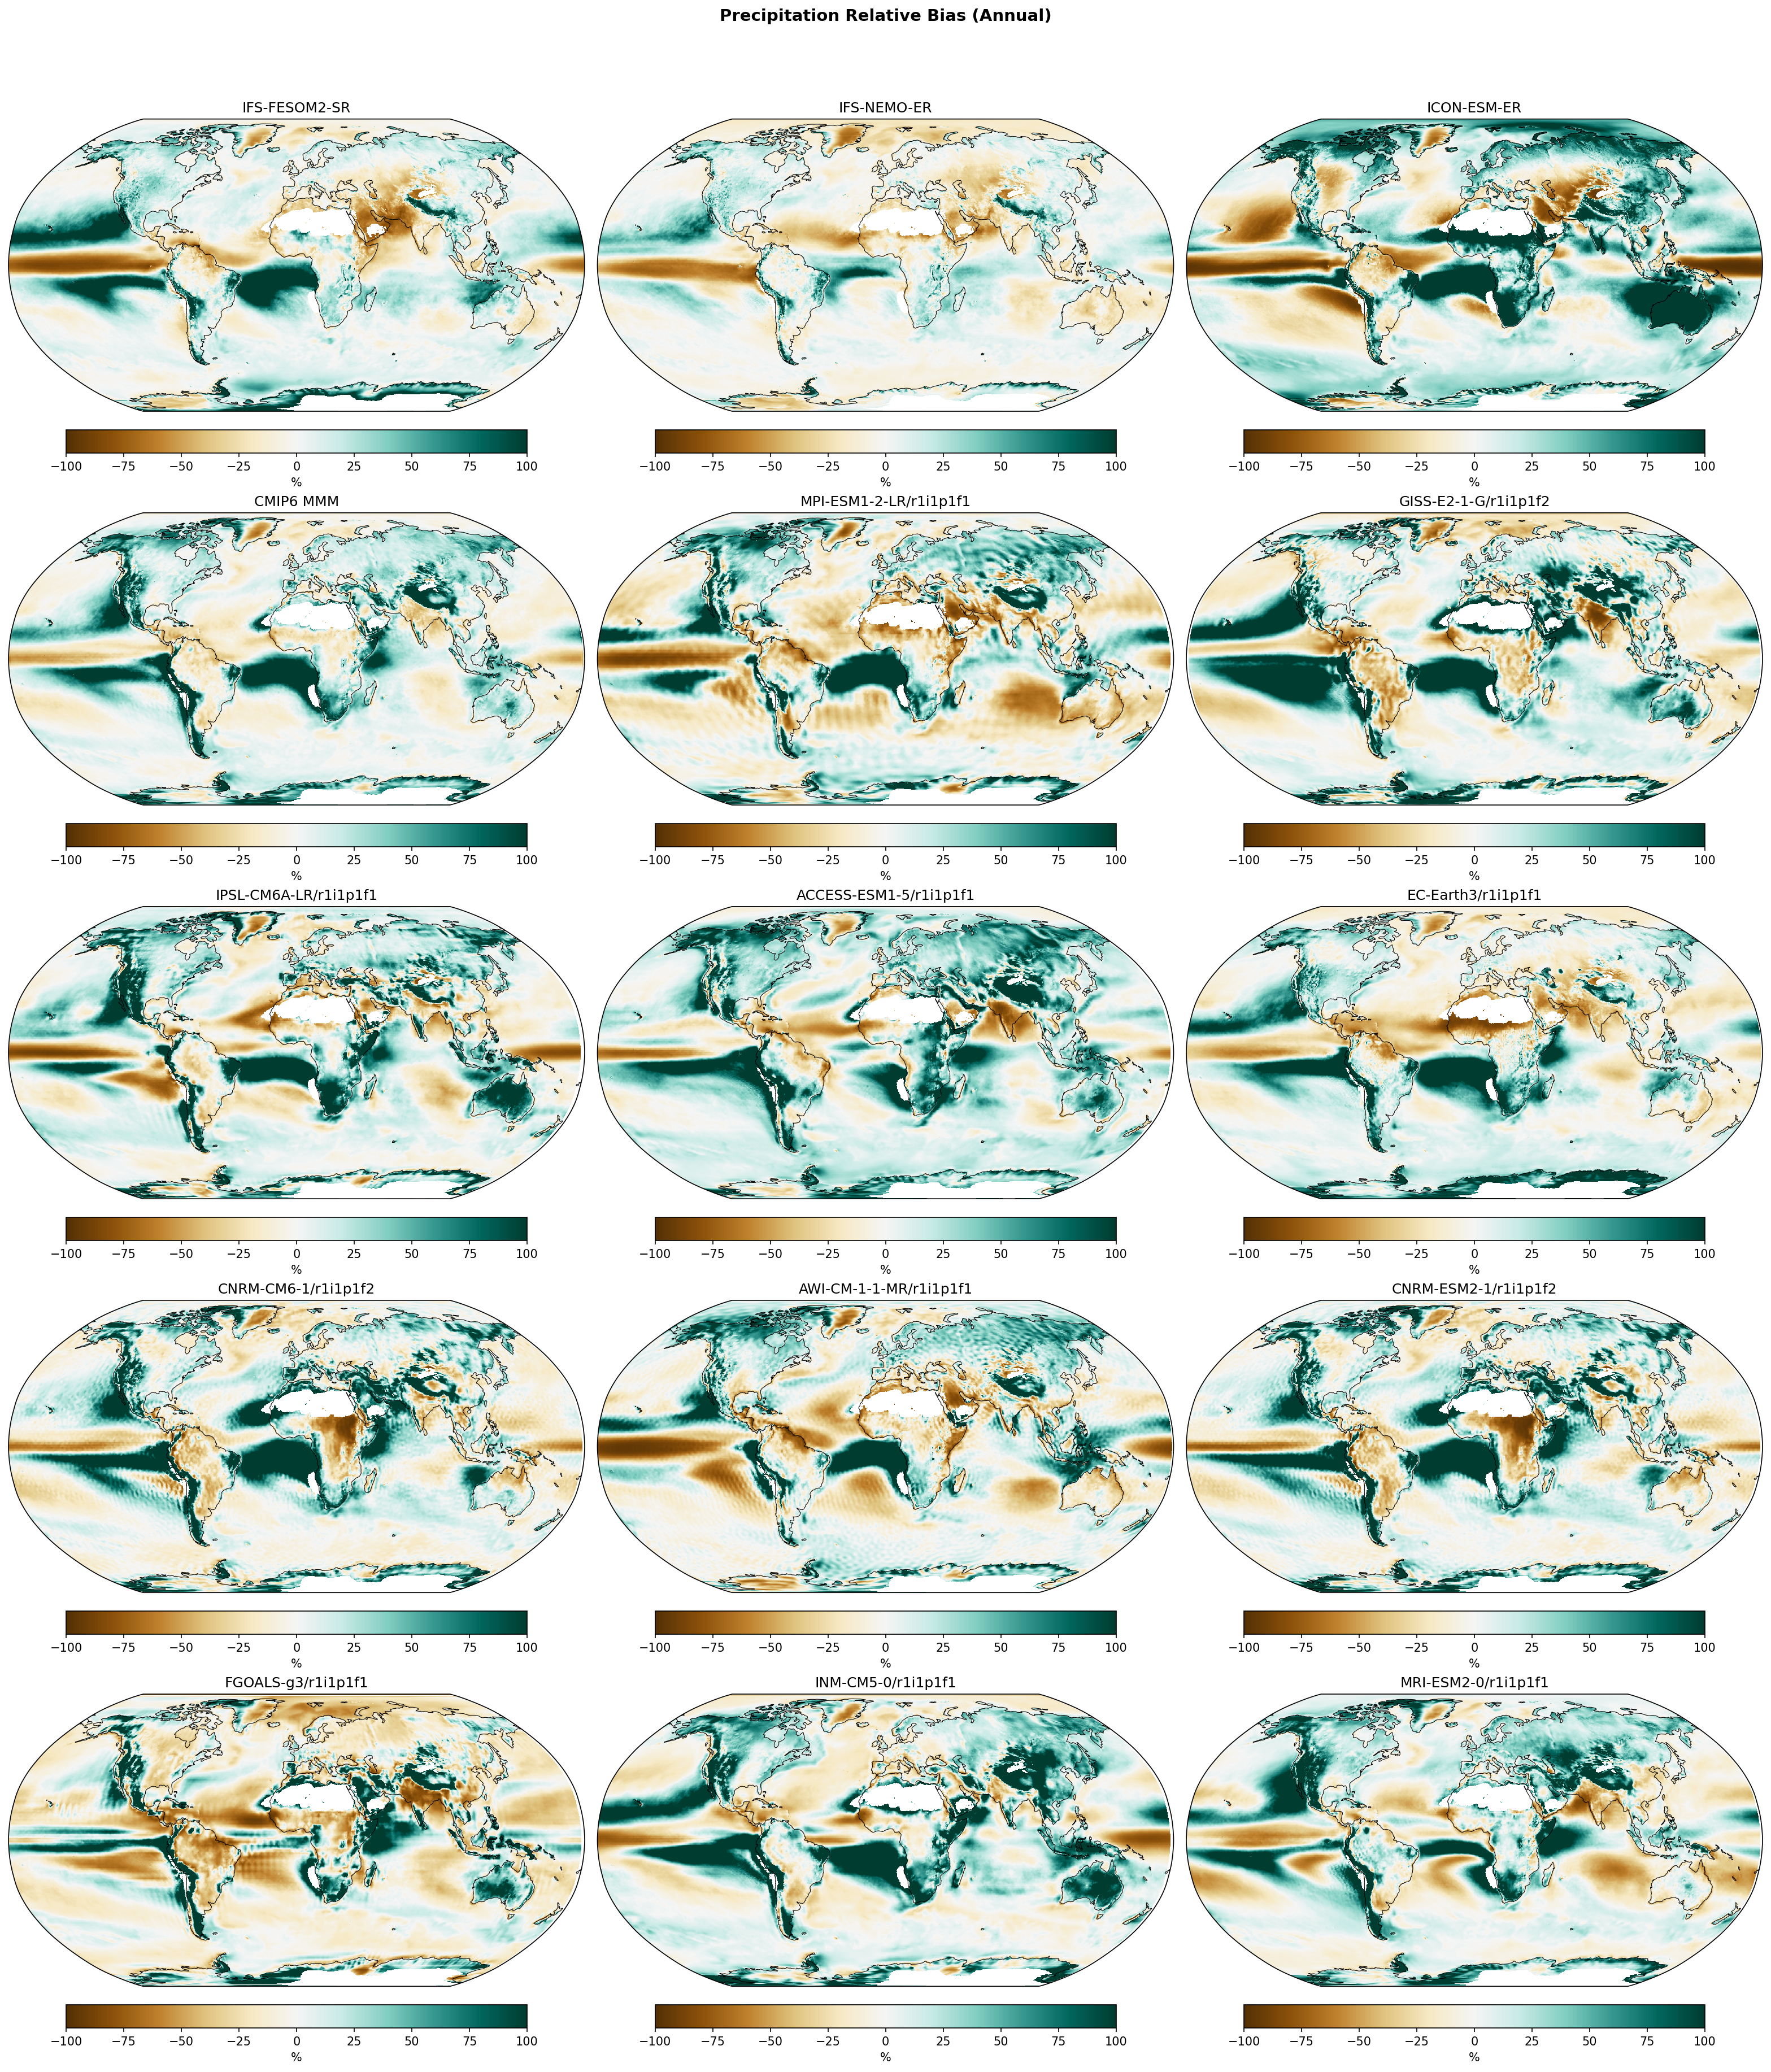
Precipitation Relative Bias (Annual)
| Variables | pr |
|---|---|
| Models | IFS-FESOM2-SR, IFS-NEMO-ER, ICON-ESM-ER, HadGEM3-GC5, CMIP6 MMM, MPI-ESM1-2-LR/r1i1p1f1, GISS-E2-1-G/r1i1p1f2, IPSL-CM6A-LR/r1i1p1f1, ACCESS-ESM1-5/r1i1p1f1, EC-Earth3/r1i1p1f1, CNRM-CM6-1/r1i1p1f2, AWI-CM-1-1-MR/r1i1p1f1, CNRM-ESM2-1/r1i1p1f2, FGOALS-g3/r1i1p1f1, INM-CM5-0/r1i1p1f1, MRI-ESM2-0/r1i1p1f1 |
| Reference Dataset | MSWEP |
| Units | kg/m2/s |
| Period | 1980–2014 |
Summary high
This multi-panel figure displays the annual mean precipitation relative bias (%) for four high-resolution EERIE models (IFS-FESOM2-SR, IFS-NEMO-ER, ICON-ESM-ER, HadGEM3-GC5) and a suite of CMIP6 models compared to MSWEP v2.8 observations, highlighting persistent systematic biases in tropical convection and storm tracks.
Key Findings
- A severe and systematic dry bias (exceeding -50%) over the Amazon basin is present in almost all models (IFS, ICON, HadGEM3, and the CMIP6 MMM), indicating a pervasive difficulty in capturing rainforest hydroclimatology.
- The 'Double ITCZ' bias is evident in the Pacific, manifesting as wet bias bands flanking the equator (particularly the southern branch) and a dry bias on the equator; this is distinct in the CMIP6 MMM and ICON-ESM-ER.
- ICON-ESM-ER exhibits a widespread wet bias across most global oceans, significantly more pronounced than in the IFS or HadGEM3 models.
- The Southern Ocean and Northern Hemisphere storm tracks generally exhibit wet biases (+25% to +75%) across the ensemble.
- Biases in the high-resolution EERIE models are qualitatively similar to standard-resolution CMIP6 models, suggesting that increased resolution alone does not resolve these fundamental parametric errors.
Spatial Patterns
The biases show strong zonal organization in the tropics. The Equatorial Pacific is characterized by a dry bias along the equator (cold tongue region) flanked by wet biases north and south. Continental biases are dominated by the dry Amazon and, to a lesser extent, dry Central Africa (Congo Basin). Orographic regions (e.g., Andes, Himalayas) often show wet biases.
Model Agreement
There is strong inter-model agreement on the sign of errors in the Amazon (dry) and Southern Ocean (wet). The two IFS-based models (IFS-FESOM2-SR and IFS-NEMO-ER) show nearly identical bias patterns, confirming that atmospheric physics (IFS) rather than the ocean component dominates precipitation errors. ICON-ESM-ER is an outlier in terms of the magnitude of oceanic wet bias.
Physical Interpretation
The persistent Amazon dry bias points to deficiencies in deep convection parameterisation or land-atmosphere moisture recycling. The Pacific zonal bias structure relates to the coupled 'Double ITCZ' syndrome, often driven by errors in meridional SST gradients and cloud-radiative feedbacks. The wet biases in storm tracks may indicate excessive drizzle or overly frequent synoptic precipitation events.
Caveats
- Relative bias can be large where mean precipitation is small, though the <0.1 mm/day mask mitigates this for arid regions.
- MSWEP observational uncertainty is higher over oceans than over land.
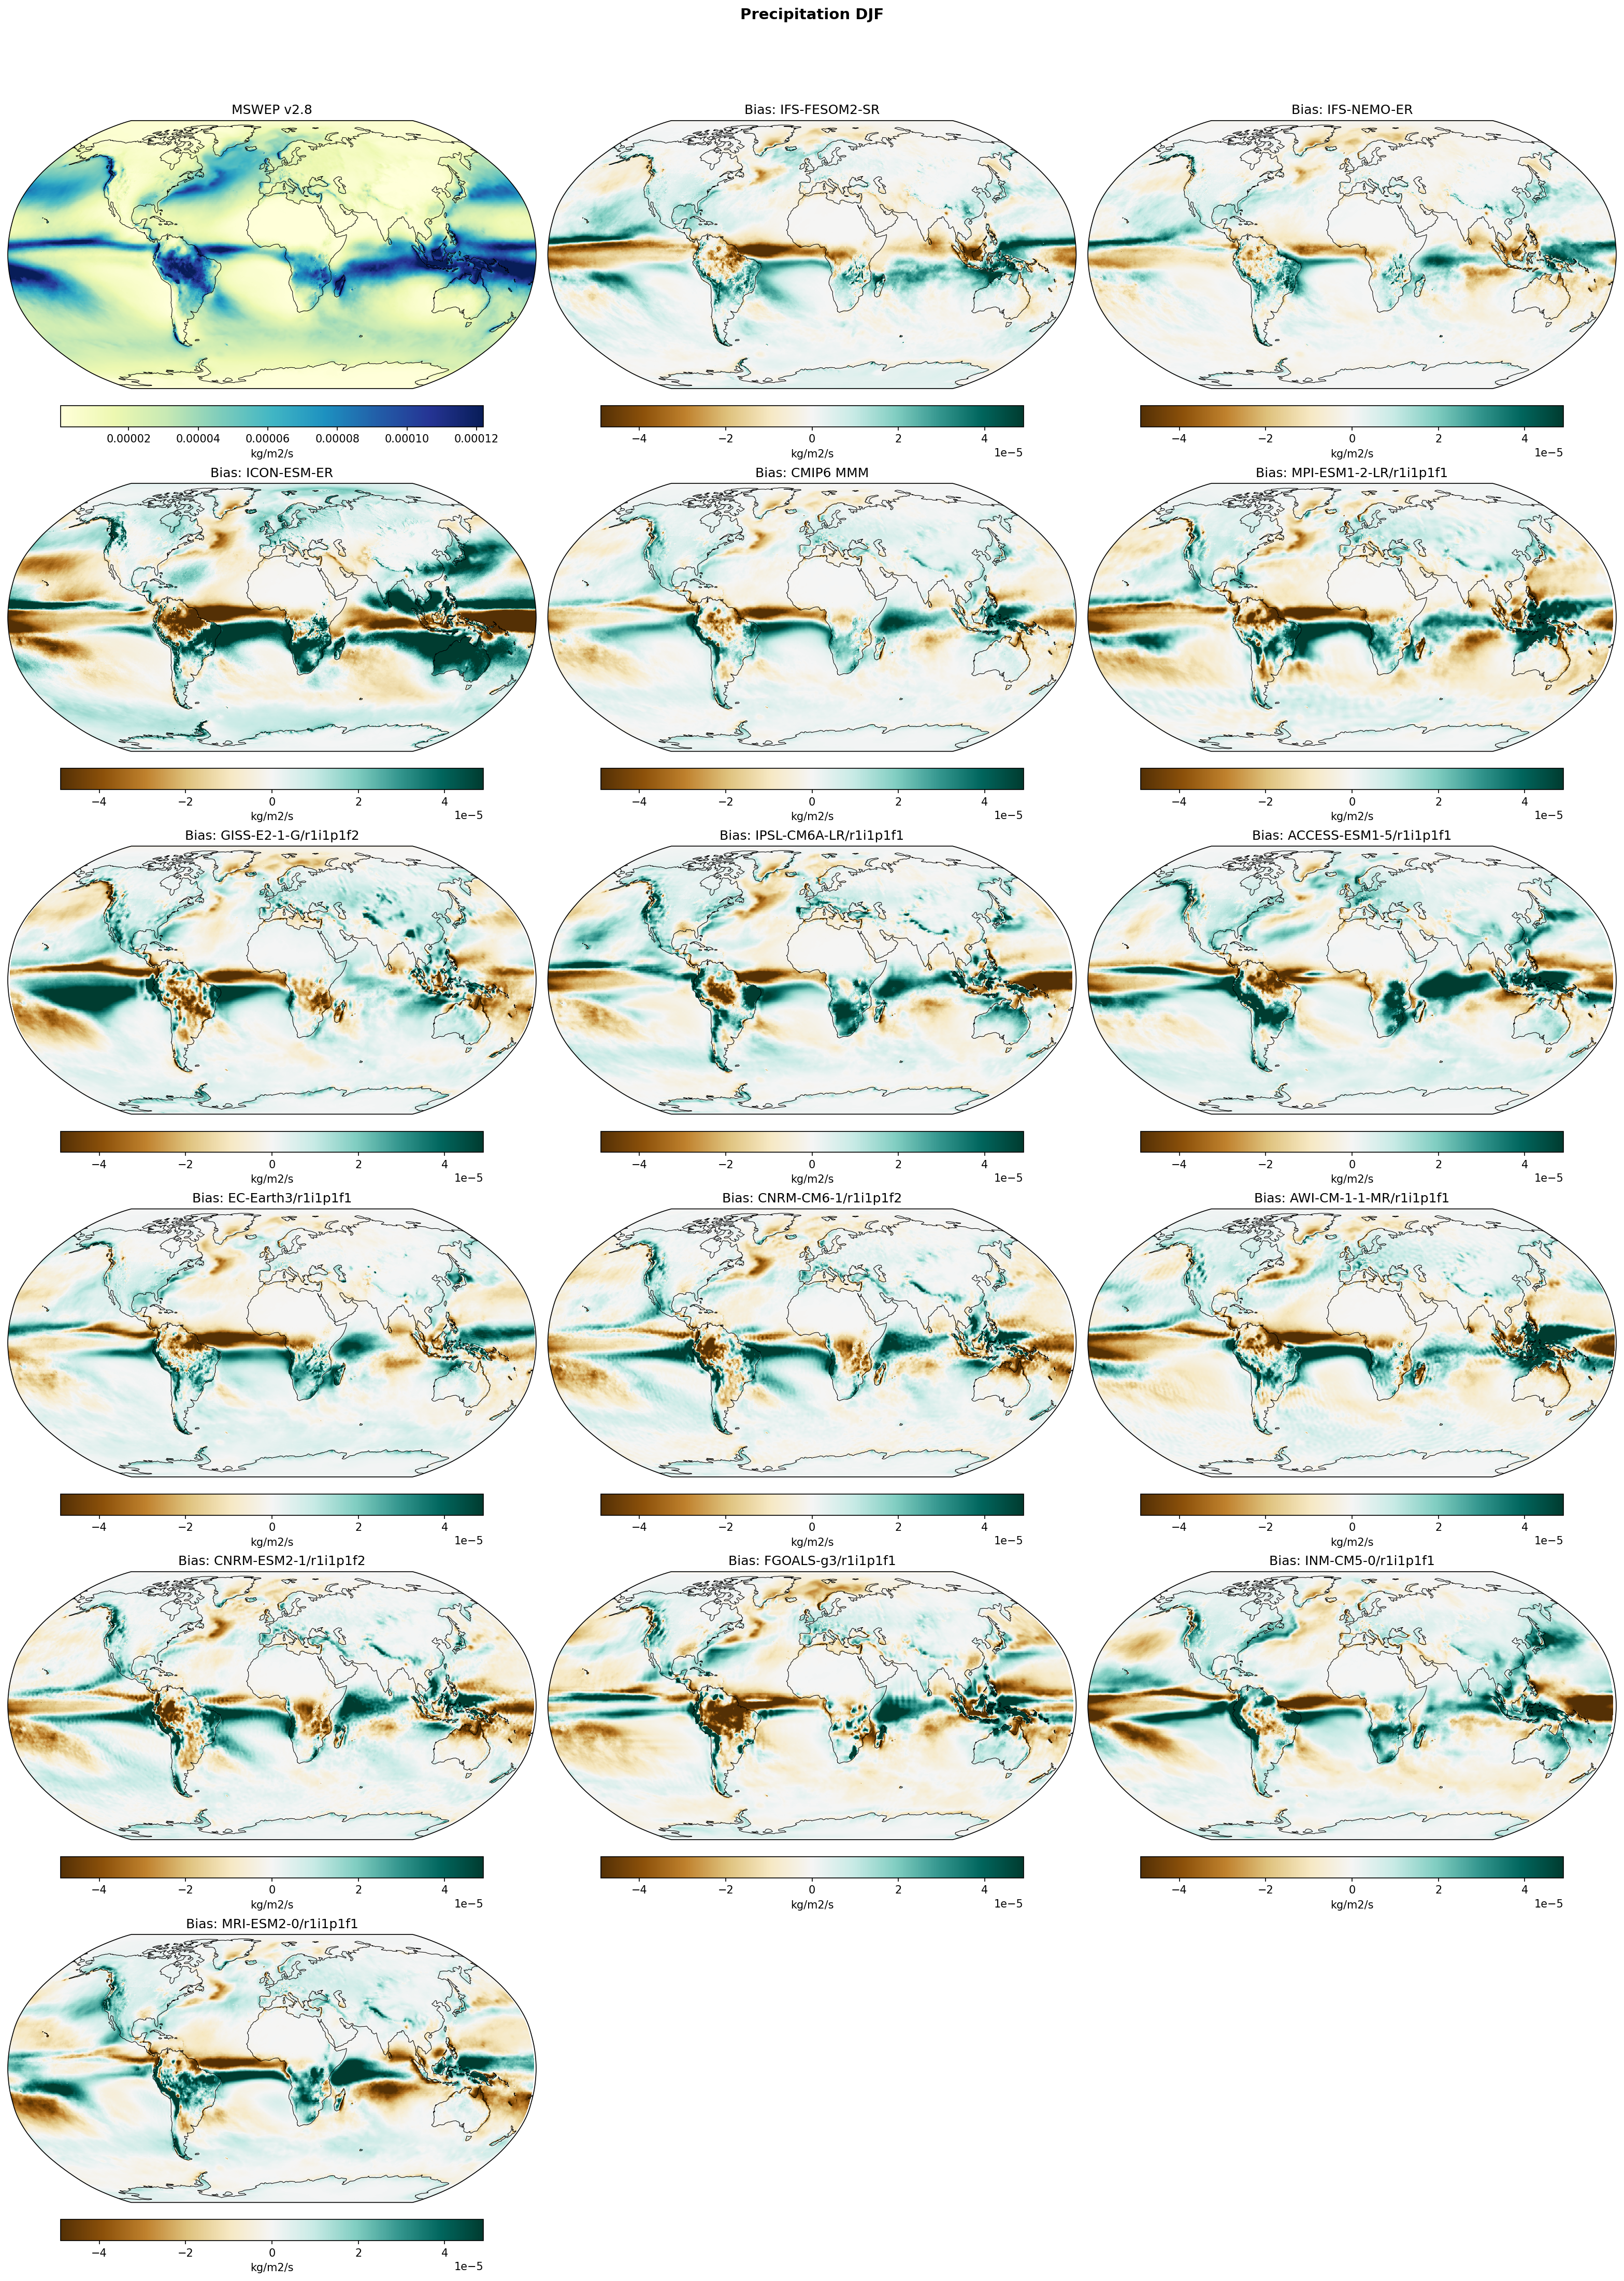
Precipitation DJF Bias
| Variables | pr |
|---|---|
| Models | IFS-FESOM2-SR, IFS-NEMO-ER, ICON-ESM-ER, HadGEM3-GC5, CMIP6 MMM, MPI-ESM1-2-LR/r1i1p1f1, GISS-E2-1-G/r1i1p1f2, IPSL-CM6A-LR/r1i1p1f1, ACCESS-ESM1-5/r1i1p1f1, EC-Earth3/r1i1p1f1, CNRM-CM6-1/r1i1p1f2, AWI-CM-1-1-MR/r1i1p1f1, CNRM-ESM2-1/r1i1p1f2, FGOALS-g3/r1i1p1f1, INM-CM5-0/r1i1p1f1, MRI-ESM2-0/r1i1p1f1 |
| Reference Dataset | MSWEP |
| Units | kg/m2/s |
| Period | 1980–2014 |
| CMIP6 MMM | Global Mean Bias: 0.00 · Rmse: None |
Summary high
This figure illustrates the precipitation biases in Dec-Jan-Feb (DJF) for high-resolution EERIE simulations (IFS-FESOM2-SR, IFS-NEMO-ER, ICON-ESM-ER) and a suite of CMIP6 models relative to MSWEP v2.8 observations. The analysis reveals persistent systematic biases across generations and resolutions, most notably severe drying over the Amazon and characteristic double-ITCZ patterns in the Pacific.
Key Findings
- A severe dry bias over the Amazon basin is ubiquitous, appearing in both the high-resolution EERIE models (IFS and ICON) and the majority of CMIP6 models, with magnitudes exceeding -4e-5 kg/m²/s (~3.5 mm/day).
- IFS-based models (IFS-FESOM2-SR, IFS-NEMO-ER, EC-Earth3) exhibit a distinct dipole in the tropical Pacific: a dry bias along the equator and a wet bias in the southern tropics (SPCZ region), indicative of a double-ITCZ or southward-shifted ITCZ bias.
- ICON-ESM-ER diverges from the IFS models in the Maritime Continent and Indian Ocean, showing a widespread wet bias, whereas IFS models show a dry bias over the Maritime Continent.
- Extratropical storm tracks (North Atlantic and North Pacific) generally exhibit wet biases across most models, particularly in ICON-ESM-ER and GISS-E2-1-G.
Spatial Patterns
The dominant spatial features are the 'double ITCZ' signature in the Pacific (wet southern band, dry equatorial band), the strong continental dry bias over South America (Amazon), and a dipole in the Indian Ocean (wet western/dry eastern) seen in IFS and CMIP6 MMM. ICON-ESM-ER shows a broader wet bias extending across the tropical Pacific and Maritime Continent. Biases in the high-resolution models reach magnitudes comparable to the mean climatology in some regions.
Model Agreement
There is strong inter-model agreement on the dry bias over South America and the existence of Pacific ITCZ biases. The two IFS-based EERIE models are nearly identical, confirming that atmospheric physics (IFS) rather than ocean coupling (FESOM2 vs NEMO) dominates precipitation errors. ICON-ESM-ER disagrees with IFS in the Maritime Continent and shows stronger wet biases in mid-latitudes, indicating sensitivity to the atmospheric component (ICON vs IFS).
Physical Interpretation
The pervasive Amazon dry bias points to systematic deficiencies in deep convection parameterizations or land-surface coupling (evapotranspiration feedbacks) common to many global models. The Pacific bias patterns (dry equator, wet off-equator) are classic symptoms of the 'double ITCZ' problem, often linked to cold tongue biases and errors in the trade wind strength/Walker circulation. The contrast between IFS (dry Maritime Continent) and ICON (wet Maritime Continent) suggests different treatments of convective triggering or moisture convergence in the Indo-Pacific warm pool.
Caveats
- Analysis is restricted to DJF (Austral summer), which is the wet season for the Amazon and Southern Hemisphere tropics; biases here represent large absolute errors in water availability.
- Observational uncertainty in MSWEP over open oceans should be considered, though the model biases are likely large enough to be robust.
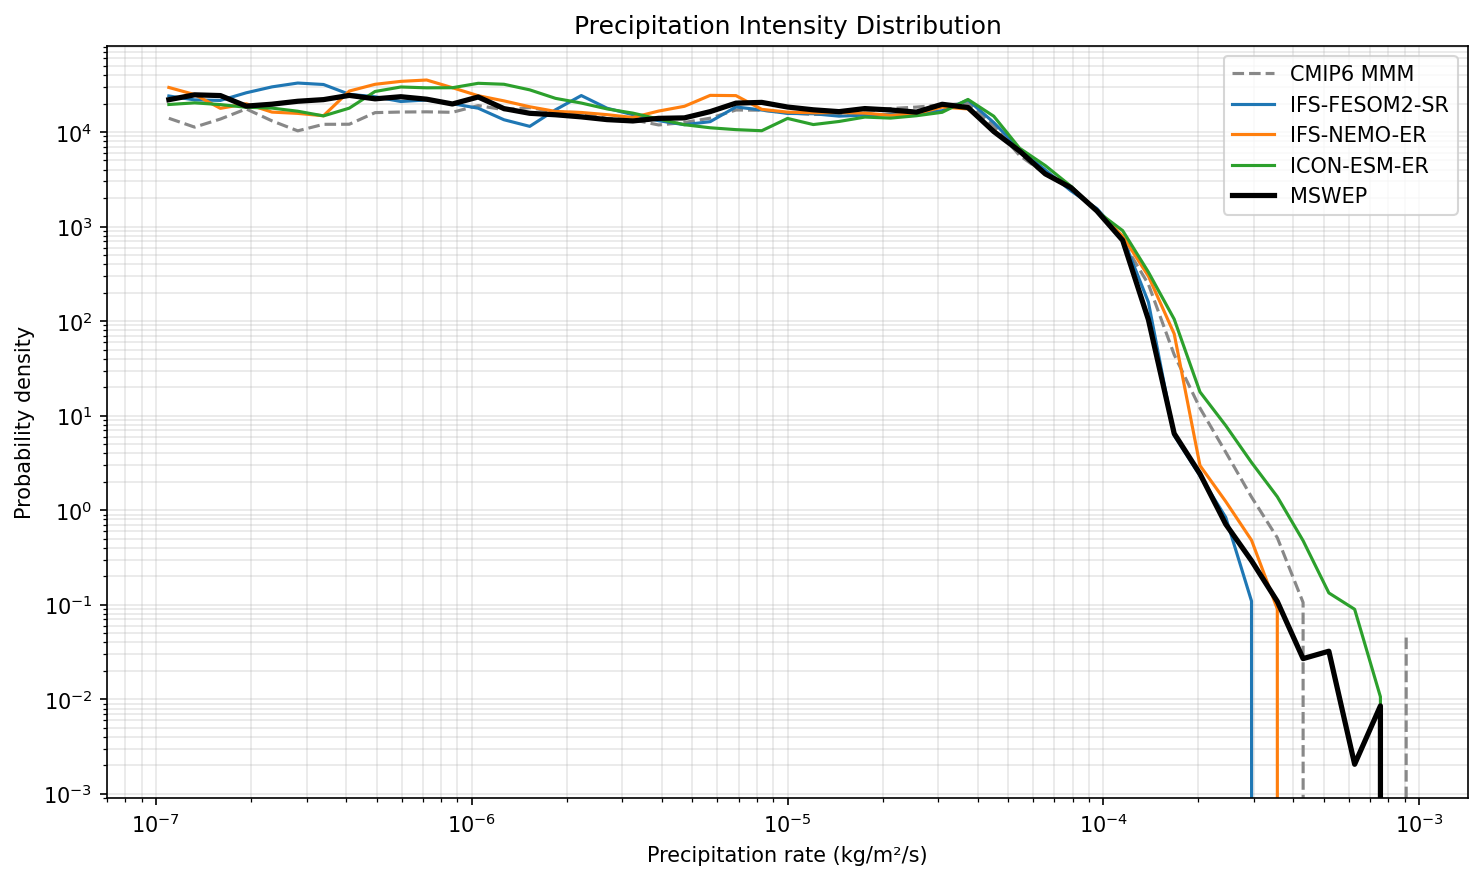
Precipitation Intensity Distribution
| Variables | pr |
|---|---|
| Models | CMIP6 MMM, IFS-FESOM2-SR, IFS-NEMO-ER, ICON-ESM-ER, HadGEM3-GC5, MSWEP |
| Reference Dataset | MSWEP |
| Units | kg/m2/s |
| Period | 1980–2014 |
Summary high
This figure displays the probability density function (PDF) of precipitation rates (intensity distribution) on a log-log scale, comparing three EERIE simulations and the CMIP6 multi-model mean against MSWEP observations.
Key Findings
- All models and the CMIP6 mean show excellent agreement with MSWEP observations for light to moderate precipitation rates (up to ~4 × 10⁻⁵ kg/m²/s).
- ICON-ESM-ER significantly overestimates the frequency of heavy precipitation events, exhibiting a 'heavy tail' bias where rates >10⁻⁴ kg/m²/s occur much more frequently than in observations.
- A clear resolution effect is visible within the IFS models: the higher-resolution IFS-NEMO-ER captures more extreme precipitation intensities than the lower-resolution IFS-FESOM2-SR, which underestimates the tail.
- IFS-FESOM2-SR drops off the earliest, underestimating the frequency of intense precipitation compared to both MSWEP and the other models.
Spatial Patterns
While this is a global distribution, the regimes correspond to physical phenomena: the broad flat region (< 10⁻⁵ kg/m²/s) corresponds to widespread light rain/drizzle, while the tail (> 10⁻⁴ kg/m²/s) represents intense convective precipitation (ITCZ, storm tracks). The divergence is confined almost entirely to the convective tail.
Model Agreement
Agreement is high for the bulk of the distribution (light/moderate rain). Divergence is significant in the extremes: ICON-ESM-ER > CMIP6 MMM > IFS-NEMO-ER > MSWEP > IFS-FESOM2-SR in terms of tail heaviness at the very extreme end (around 2-3 × 10⁻⁴ kg/m²/s), though ICON is the distinct high outlier.
Physical Interpretation
The 'heavy tail' in ICON-ESM-ER suggests overly vigorous deep convection or insufficient grid-scale mixing of moisture, a common issue when pushing resolution without retuning convective parameterizations. The difference between IFS-NEMO-ER and IFS-FESOM2-SR illustrates the impact of atmospheric resolution: the 'ER' (Eddy-Rich, high-res) configuration resolves smaller, more intense features than the 'SR' (Standard Resolution) configuration, which averages them out. The general agreement in light rain suggests the models do not suffer from the 'too much drizzle' bias often seen in older generations.
Caveats
- Comparison of grid-cell PDFs depends heavily on the native grid resolution; coarser grids naturally smooth out extremes.
- MSWEP observations themselves have uncertainties in estimating extreme precipitation rates, particularly over oceans.
Precipitation JJA Bias
| Variables | pr |
|---|---|
| Models | IFS-FESOM2-SR, IFS-NEMO-ER, ICON-ESM-ER, HadGEM3-GC5, CMIP6 MMM, MPI-ESM1-2-LR/r1i1p1f1, GISS-E2-1-G/r1i1p1f2, IPSL-CM6A-LR/r1i1p1f1, ACCESS-ESM1-5/r1i1p1f1, EC-Earth3/r1i1p1f1, CNRM-CM6-1/r1i1p1f2, AWI-CM-1-1-MR/r1i1p1f1, CNRM-ESM2-1/r1i1p1f2, FGOALS-g3/r1i1p1f1, INM-CM5-0/r1i1p1f1, MRI-ESM2-0/r1i1p1f1 |
| Reference Dataset | MSWEP |
| Units | kg/m2/s |
| Period | 1980–2014 |
| CMIP6 MMM | Global Mean Bias: 0.00 · Rmse: None |
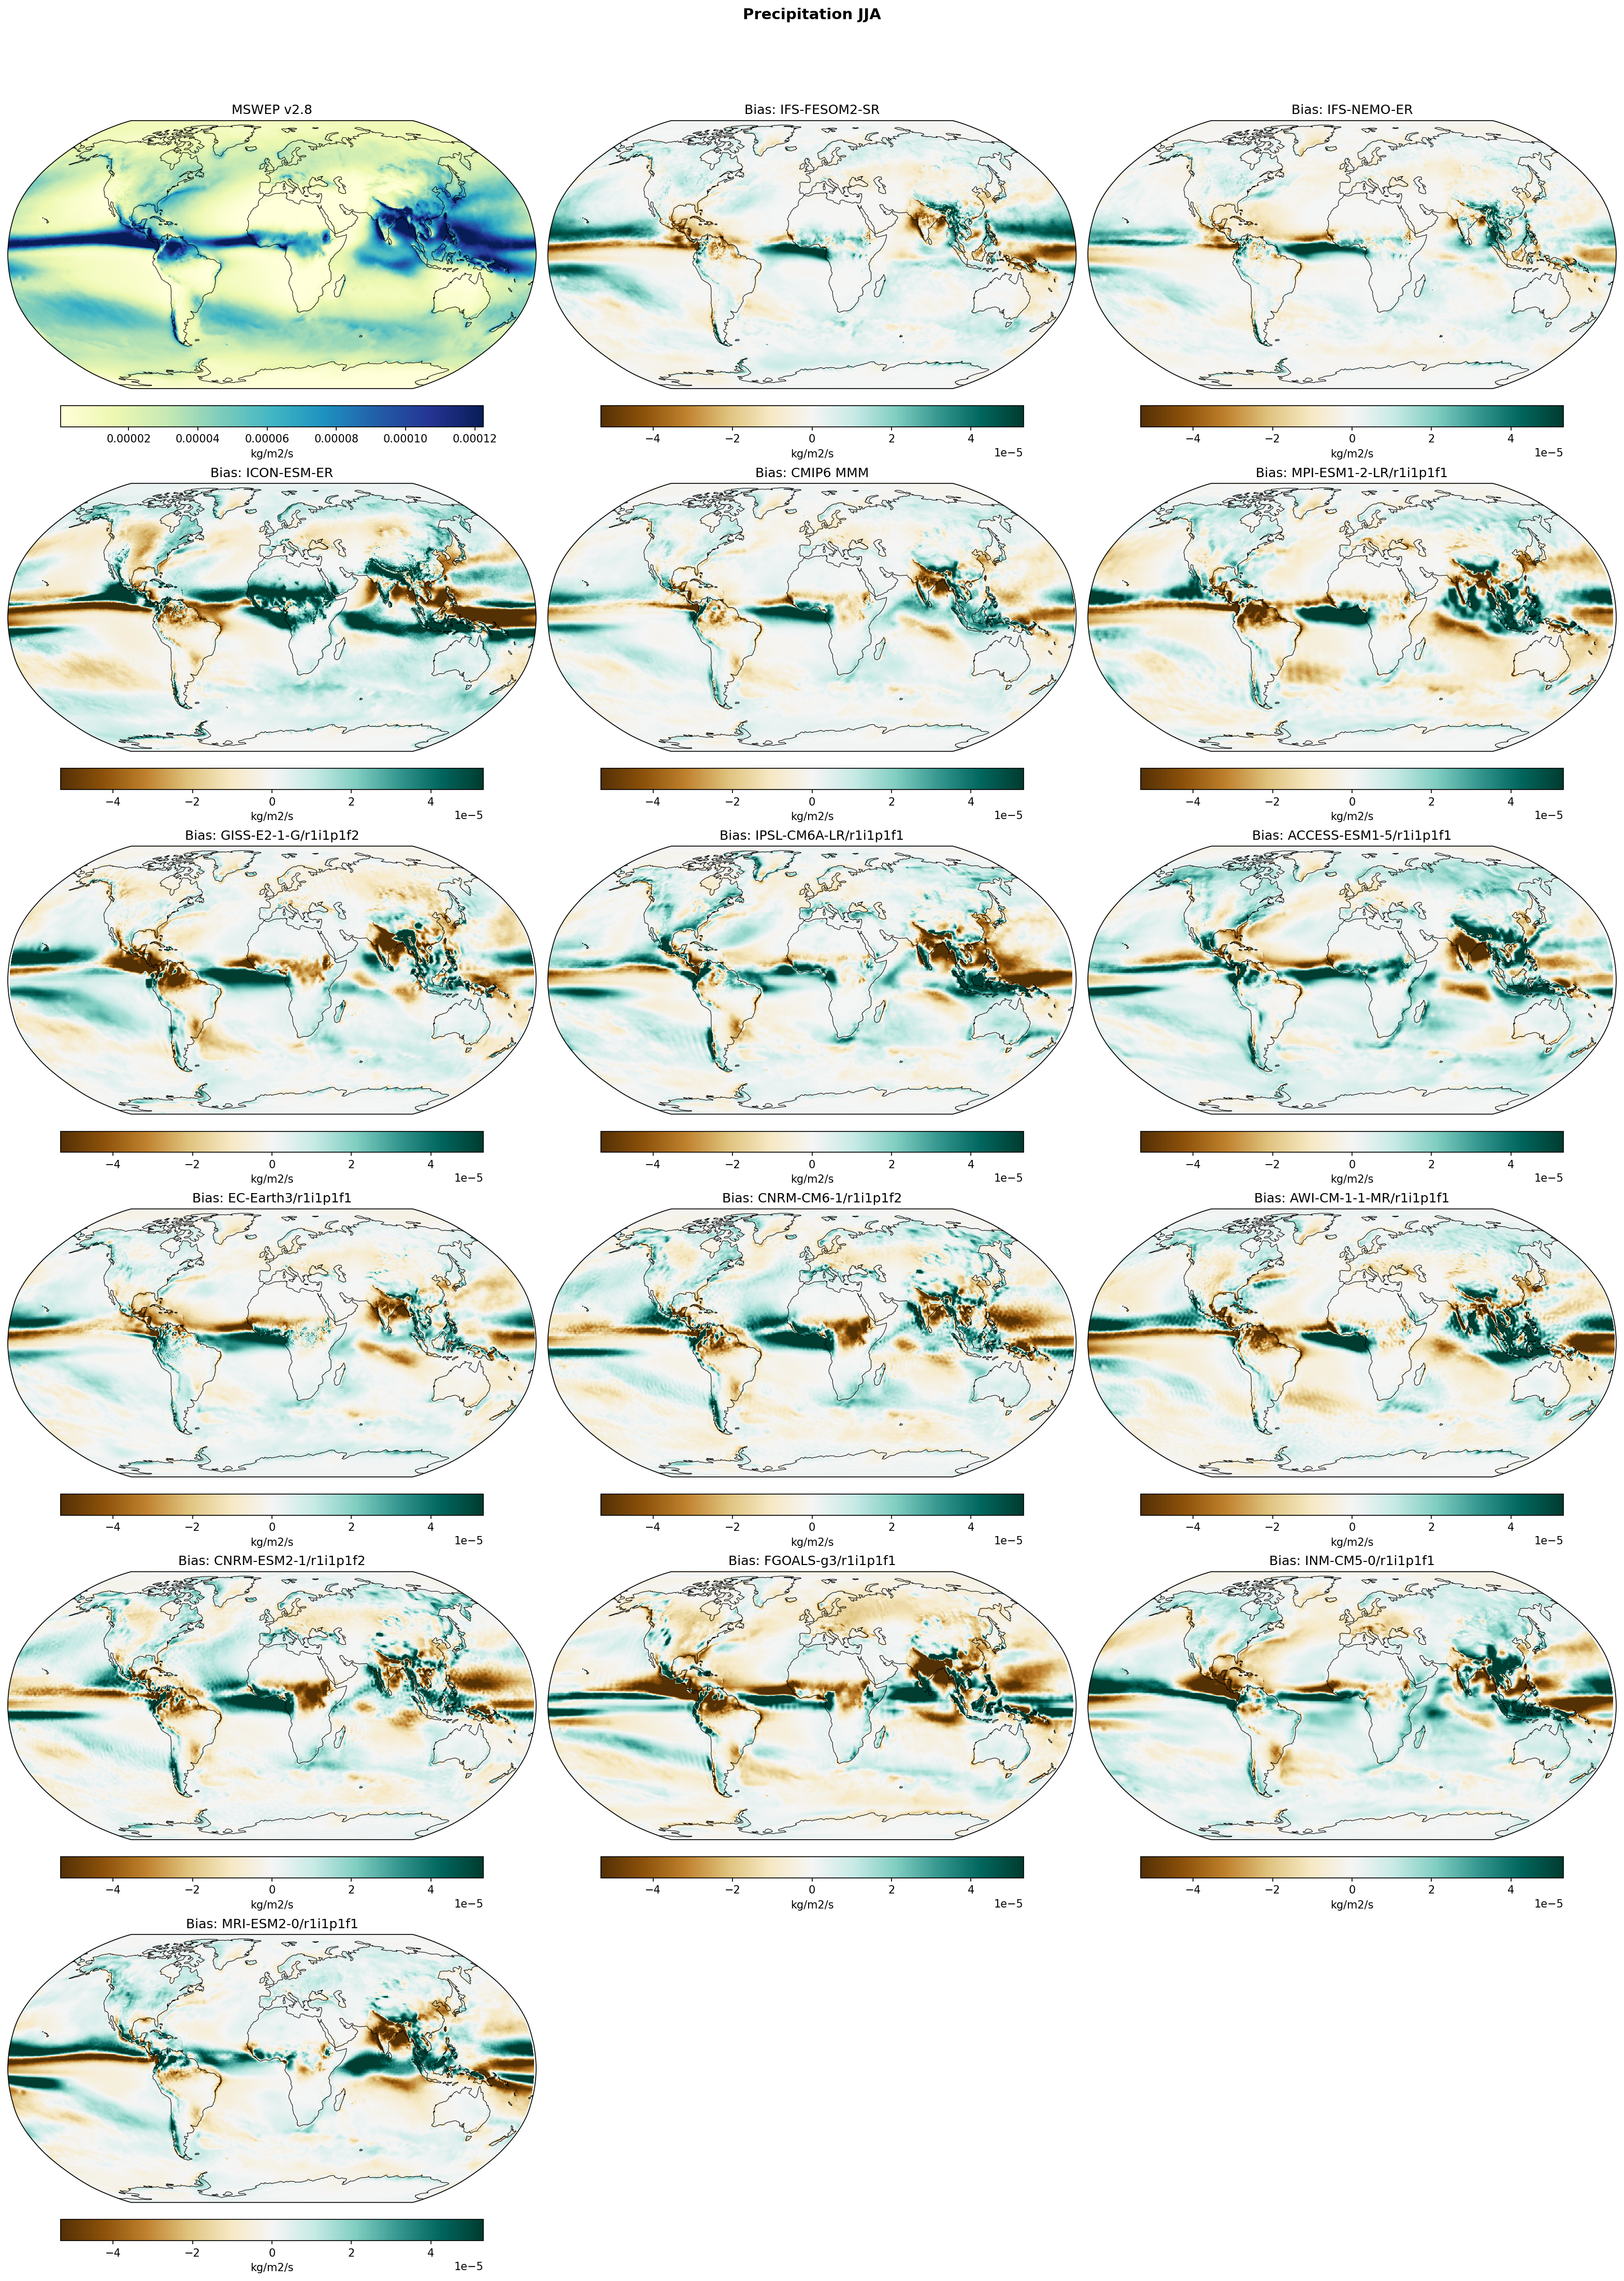
Summary high
This figure evaluates JJA precipitation biases in high-resolution EERIE models and CMIP6 simulations against MSWEP v2.8 observations. While high-resolution models capture sharper orographic features, they exhibit persistent systematic biases in major monsoon systems and the ITCZ that often resemble those in standard-resolution CMIP6 models.
Key Findings
- IFS and ICON variants exhibit a prominent 'dry India / wet Equatorial Indian Ocean' dipole, indicating a failure to fully propagate the South Asian Monsoon rainfall northward onto the subcontinent.
- A strong divergence exists in the West African Monsoon representation: HadGEM3-GC5 shows a pronounced wet bias extending into the Sahel and Sahara, whereas IFS and ICON models display dry biases in the same region.
- Almost all models, including the high-resolution ones, display a systematic dry bias over the Amazon basin and Central America during the JJA season.
- ICON-ESM-ER stands out with an excessive wet bias over the Maritime Continent and Western Pacific compared to other EERIE models.
Spatial Patterns
The plots reveal a classic 'double ITCZ' bias signature (wet bias in the SE Pacific roughly 5-10°S) in the CMIP6 MMM and several individual models, which persists to varying degrees in the high-resolution runs. Sharp dipolar biases are visible along major mountain ranges (Himalayas, Andes) in the high-resolution models, reflecting the interaction of resolved topography with atmospheric flow. The North Atlantic storm track region generally shows wet biases in ICON and HadGEM3.
Model Agreement
There is broad agreement on dry biases over the Amazon and Central America. However, models disagree significantly on the sign of the bias in the Sahel (HadGEM3 wet vs. others dry) and the magnitude of precipitation over the Maritime Continent. The IFS-FESOM2-SR and IFS-NEMO-ER show very similar bias patterns, suggesting the atmospheric component dominates the error structure over the ocean model choice.
Physical Interpretation
The pervasive dry India/wet Indian Ocean pattern suggests dynamic issues with the cross-equatorial flow or convective parameterizations that limit the northward migration of the ITCZ over land. The dry Amazon bias likely involves land-atmosphere feedbacks, where soil moisture depletion or insufficient evapotranspiration exacerbates the seasonal dry signal. The wet bias in the Sahel in HadGEM3 may result from an overly vigorous West African Monsoon circulation or surface albedo feedbacks.
Caveats
- Biases are relative to MSWEP v2.8, which itself has uncertainties, particularly over open oceans and sparsely gauged regions like the Amazon and Central Africa.
- The color scale saturates at ±5e-5 kg/m²/s (~4.3 mm/day), meaning extreme biases in the core of the ITCZ or monsoon regions may be larger than visually distinguished.
Precipitation Seasonal Cycle
| Variables | pr |
|---|---|
| Models | IFS-FESOM2-SR, IFS-NEMO-ER, ICON-ESM-ER, HadGEM3-GC5, MPI-ESM1-2-LR, GISS-E2-1-G, IPSL-CM6A-LR, ACCESS-ESM1-5, EC-Earth3, CNRM-CM6-1, AWI-CM-1-1-MR, CNRM-ESM2-1, FGOALS-g3, INM-CM5-0, MRI-ESM2-0 |
| Reference Dataset | MSWEP |
| Units | kg/m2/s |
| Period | 1980–2014 |
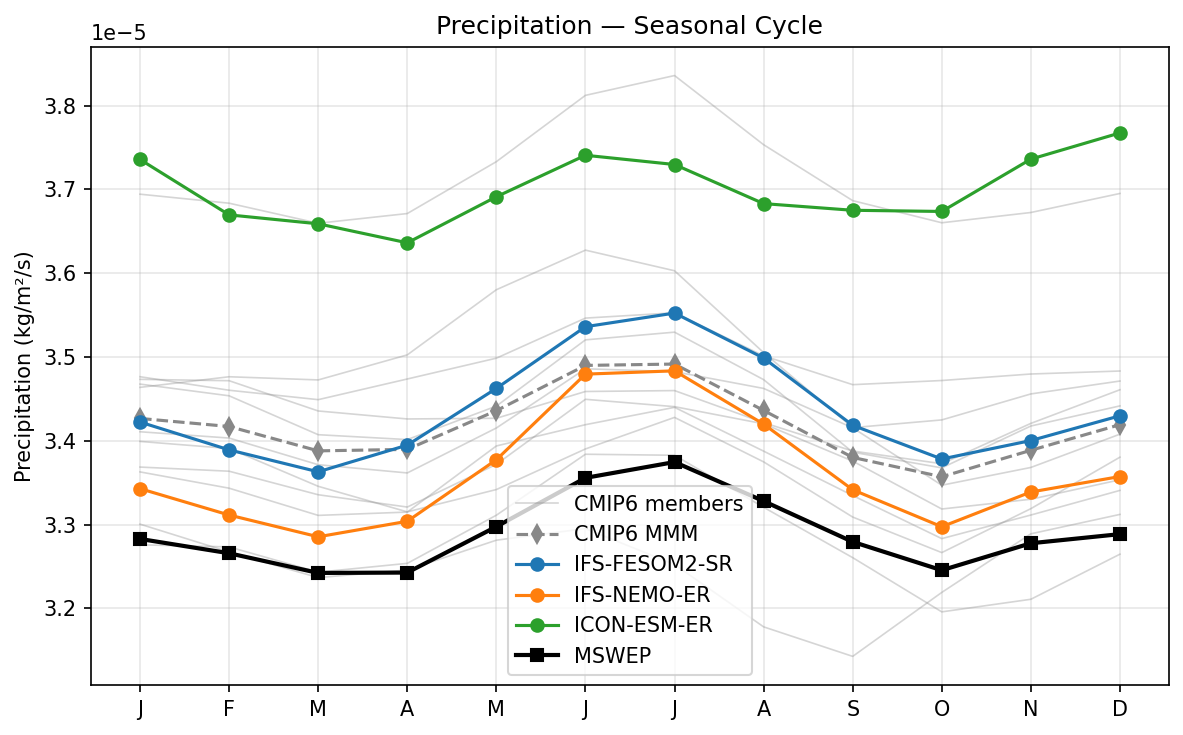
Summary high
This figure evaluates the global mean precipitation seasonal cycle, revealing a systematic wet bias across all EERIE models and the CMIP6 ensemble relative to MSWEP observations.
Key Findings
- All analyzed models overestimate global mean precipitation compared to MSWEP (approx. 3.25e-5 kg/m²/s), with biases ranging from moderate (+3%) to severe (+13%).
- IFS-NEMO-ER performs best among the high-resolution models, showing the smallest wet bias and tracking below the CMIP6 Multi-Model Mean (MMM).
- ICON-ESM-ER and HadGEM3-GC5 exhibit the largest wet biases, exceeding the CMIP6 MMM and aligning with the wettest members of the CMIP6 ensemble (approx. 3.7e-5 kg/m²/s).
- Models exaggerate the seasonal cycle amplitude, showing a distinct peak in boreal summer (June-August) that is much weaker in observations.
Spatial Patterns
While observations show a relatively flat global precipitation rate year-round, models produce a pronounced seasonal cycle peaking in JJA. This implies an imbalance where Northern Hemisphere summer precipitation (likely monsoonal) increases more than Southern Hemisphere precipitation decreases.
Model Agreement
There is significant inter-model spread in the magnitude of the hydrological cycle, with a clear separation between the drier IFS configurations and the wetter ICON/HadGEM3 models. However, all models agree on the phase of the seasonal cycle (JJA peak), disagreeing with the flatter observational profile.
Physical Interpretation
The pervasive wet bias indicates an overly intense global hydrological cycle, a common GCM issue often linked to excessive convective precipitation and surface evaporation rates. The strong JJA peak suggests models may have overly active Northern Hemisphere monsoon systems or ITCZ convection that is not dynamically compensated elsewhere. The superior performance of IFS-NEMO-ER (Eddy-Rich) compared to IFS-FESOM2-SR suggests that higher resolution or specific ocean coupling configurations can mitigate this bias.
Caveats
- Global means can mask large regional compensating errors (e.g., spatial shifts in the ITCZ).
- Precipitation observations over oceans have higher uncertainty than over land.
Precipitation Global Mean Time Series
| Variables | pr |
|---|---|
| Models | IFS-FESOM2-SR, IFS-NEMO-ER, ICON-ESM-ER, HadGEM3-GC5, MPI-ESM1-2-LR, GISS-E2-1-G, IPSL-CM6A-LR, ACCESS-ESM1-5, EC-Earth3, CNRM-CM6-1, AWI-CM-1-1-MR, CNRM-ESM2-1, FGOALS-g3, INM-CM5-0, MRI-ESM2-0 |
| Reference Dataset | MSWEP |
| Units | kg/m2/s |
| Period | 1980–2014 |
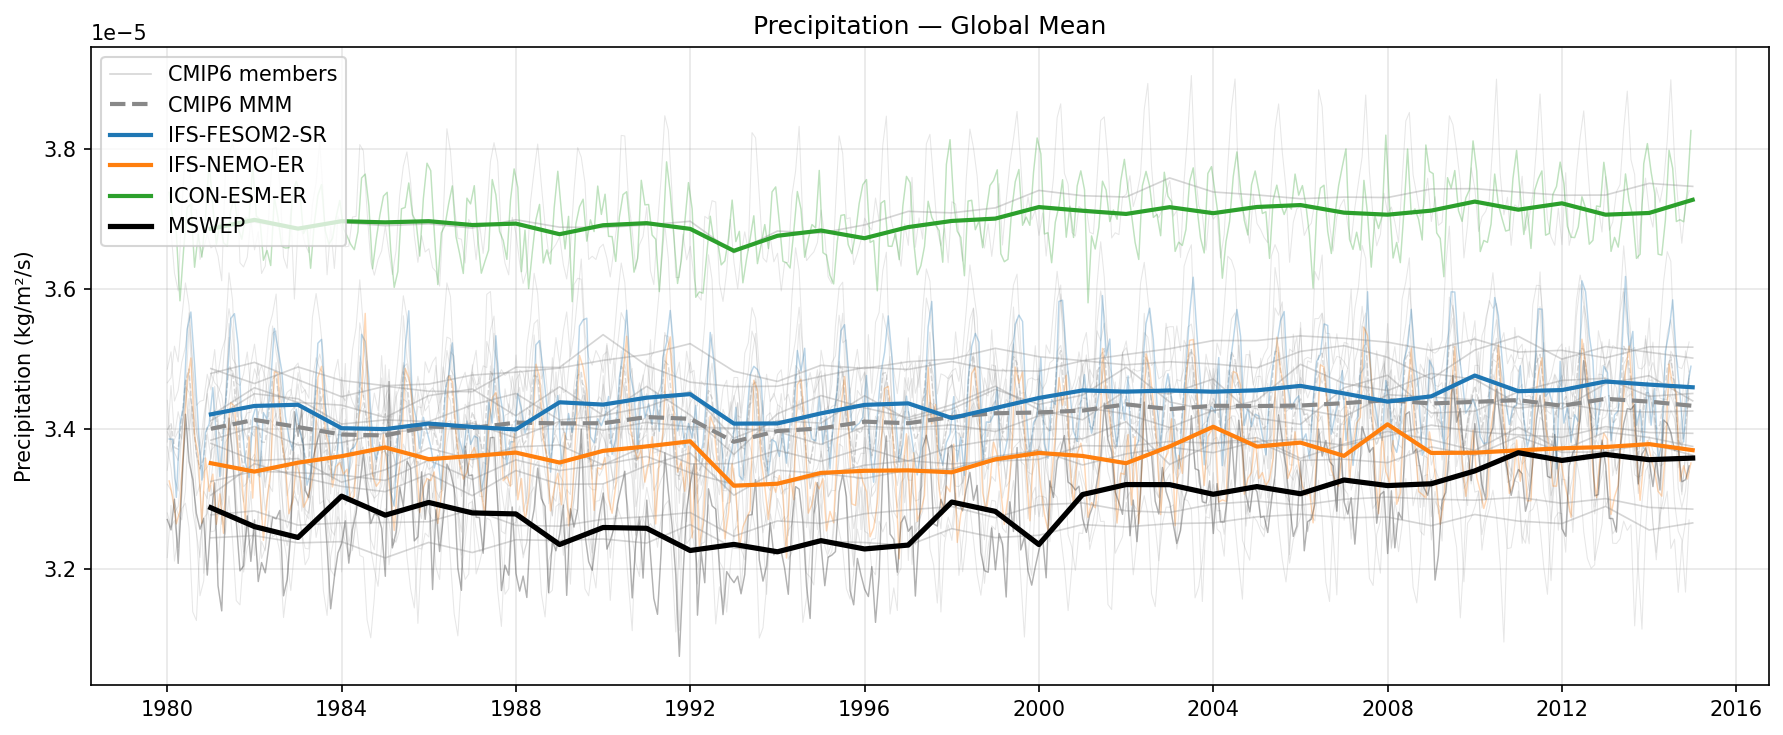
Summary high
This time series compares global mean precipitation (1980–2014) from three high-resolution models (IFS-FESOM2-SR, IFS-NEMO-ER, ICON-ESM-ER) and the CMIP6 ensemble against MSWEP observations. All models exhibit a wet bias relative to MSWEP, with ICON-ESM-ER showing the largest overestimate and IFS-NEMO-ER tracking closest to observations.
Key Findings
- ICON-ESM-ER exhibits a substantial wet bias, averaging ~3.7e-5 kg/m²/s compared to the observational mean of ~3.3e-5 kg/m²/s (an overestimation of approx. 12%).
- IFS-NEMO-ER shows the best agreement with observations among the highlighted models, lying just above the MSWEP line (~3.35-3.4e-5 kg/m²/s) and performing better than the CMIP6 Multi-Model Mean.
- IFS-FESOM2-SR lies between the other two, closely following the CMIP6 Multi-Model Mean trajectory.
- A distinct drop in global precipitation is visible around 1991-1992 in the IFS models and MSWEP, likely the hydrological response to the Mt. Pinatubo eruption.
- MSWEP shows a marked upward trend in global precipitation from roughly 2000 onwards which is not fully captured in magnitude by the models.
Spatial Patterns
While this is a global mean time series, temporal patterns reveal a hydrological sensitivity to volcanic forcing (1991 Pinatubo dip) and a multi-decadal increase in the observational record that exceeds the linear trends seen in most models.
Model Agreement
There is a systematic wet bias across the model ensemble (CMIP6 and EERIE models) relative to MSWEP. IFS-NEMO-ER is the best-performing outlier on the lower (drier) side, while ICON-ESM-ER is an outlier on the higher (wetter) side, sitting at the upper bound of the CMIP6 ensemble spread.
Physical Interpretation
Global mean precipitation is energetically constrained by the radiative cooling of the atmosphere (balancing latent heat release). The excess precipitation in ICON-ESM-ER suggests a too-vigorous hydrological cycle, possibly linked to excessive surface evaporation or radiative cooling biases. The 1991 dip demonstrates the fast hydrological response to solar dimming from volcanic aerosols (reduced surface energy availability). The lower bias in IFS-NEMO-ER compared to IFS-FESOM2-SR may result from cooler SSTs in the eddy-rich configuration or differences in atmospheric tuning.
Caveats
- Global mean precipitation observations are subject to considerable uncertainty; MSWEP blends gauge, satellite, and reanalysis data, but other datasets (e.g., GPCP) might show different absolute means.
- The apparent trend in MSWEP post-2000 could partially result from inhomogeneities in the observing system (e.g., changing satellite constellations).
Precipitation Zonal Mean Profile
| Variables | pr |
|---|---|
| Models | CMIP6 MMM, IFS-FESOM2-SR, IFS-NEMO-ER, ICON-ESM-ER, HadGEM3-GC5, MSWEP |
| Reference Dataset | MSWEP |
| Units | kg/m2/s |
| Period | 1980–2014 |
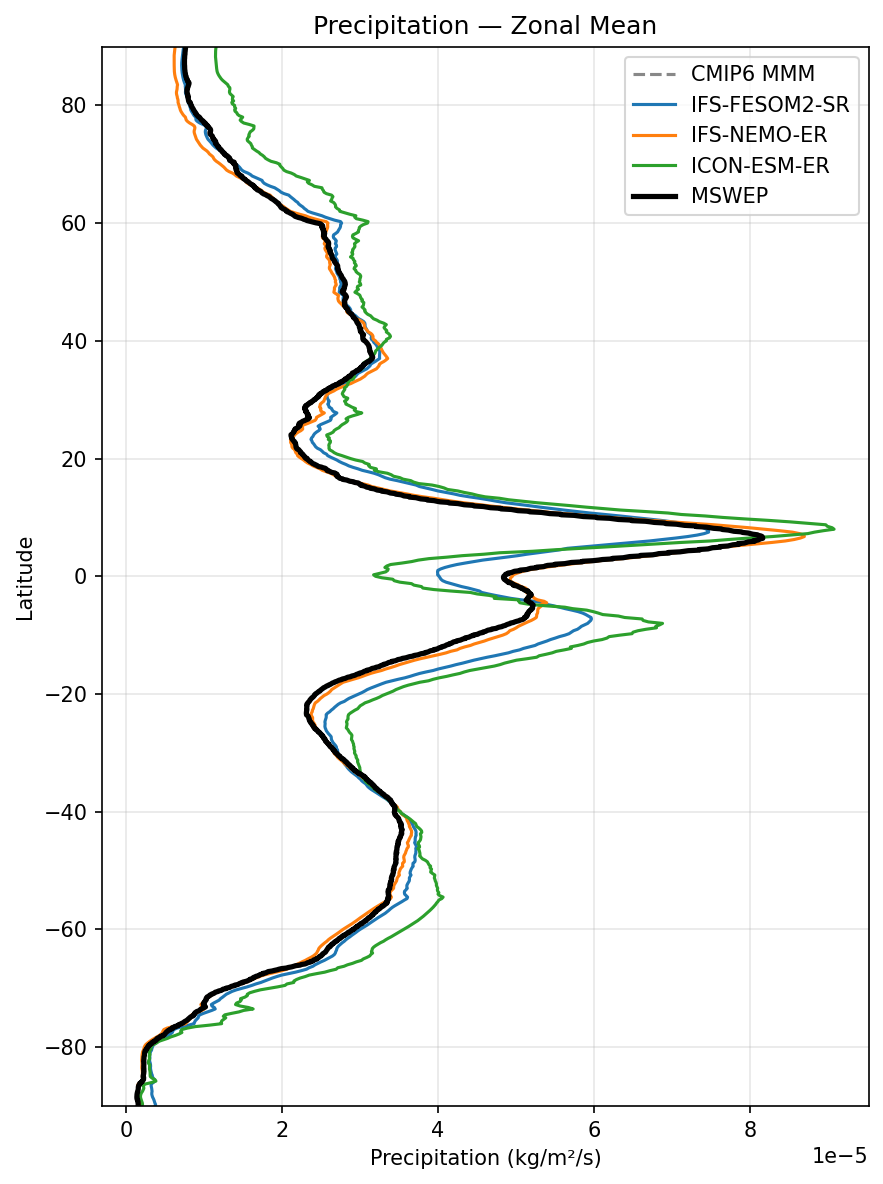
Summary high
The figure presents zonal mean precipitation profiles, comparing three high-resolution coupled models against MSWEP observations. While the IFS-based models demonstrate high skill in reproducing the observed latitudinal structure, ICON-ESM-ER exhibits a systematic wet bias across the tropics and mid-latitudes, obscuring the definition of subtropical dry zones.
Key Findings
- IFS-FESOM2-SR (blue) and IFS-NEMO-ER (orange) show excellent agreement with observations, accurately capturing the ITCZ peak intensity (~8.5e-5 kg/m²/s) and the depth of the subtropical dry zones.
- ICON-ESM-ER (green) is a significant outlier with a global positive precipitation bias; it overestimates the ITCZ peak and fails to reproduce the low precipitation rates in the subtropical subsidence regions (approx. 15-30° N/S).
- ICON-ESM-ER displays a 'double ITCZ' tendency, evidenced by a broad tropical peak and excessive precipitation in the Southern Hemisphere tropics (0-10°S) compared to the sharp, northern-hemisphere-dominated peak in MSWEP and IFS models.
Spatial Patterns
The profile clearly delineates the major limbs of the global circulation: the equatorial ITCZ rainfall maximum (peaking ~6-8°N), the subtropical dry zones (Hadley cell subsidence regions around 20-30° latitude), and the secondary maxima in the mid-latitude storm tracks (40-50° latitude). The observational asymmetry (wetter NH ITCZ) is well captured by IFS, while ICON produces a more symmetric, broader tropical wet zone.
Model Agreement
There is strong agreement between the two IFS variants (FESOM2 and NEMO), suggesting that the choice of ocean model grid (unstructured vs. structured) has minimal impact on the zonal mean atmospheric precipitation state compared to the atmospheric physics package. In contrast, the inter-model spread is large due to ICON-ESM-ER's pervasive wet bias, which diverges significantly from both IFS models and observations.
Physical Interpretation
The systematic wet bias in ICON-ESM-ER, particularly in the subtropical dry zones, suggests issues with convective parameterization (triggering too frequently or insufficient entrainment/drying) or weak large-scale subsidence in the Hadley circulation. The excessive precipitation in the mid-latitudes for ICON indicates potentially overactive storm tracks or excessive poleward moisture transport. The IFS atmospheric component appears better tuned, balancing radiative cooling and latent heating to match observed precipitation rates closely.
Caveats
- The CMIP6 MMM line, while listed in the legend, is not clearly visible in the plot, preventing a direct comparison with standard-resolution models.
- Zonal averaging masks potential regional biases (e.g., specific monsoon failures or dry biases over land vs. ocean) that might cancel out in the mean.